
Tariff News, Dealer Balance Sheets, and the COMEX Premium
What Public Data Can and Cannot Say About the 2024 to 2025 Gold and Silver Dislocation
Felix Nikolas Prehn · October 2026 · ORCID 0009-0003-0238-8790
About this report
Between November 2024 and April 2025 the price of gold for delivery on COMEX in New York exceeded the London benchmark price by a margin several times its historical size, and more than ten million troy ounces entered COMEX registered warehouses. The prevailing interpretation attributes the premium to the anticipated extension of United States import tariffs to bullion. This paper tests the event-study implication of that interpretation: if the premium priced tariff risk, it should have widened on news that raised the probability of a bullion tariff and narrowed on news that lowered it. The futures leg is constructed from CME Group daily settlements by explicit contract month with a documented roll rule, and the premium is financed to the delivery month of the contract held. The data comprise 917 trading days from January 2023 to September 2026, eleven tariff event windows dated from the Federal Register and the press, weekly CFTC positioning data, and partial COMEX depository stock records. The financing-adjusted gold premium averaged 0.02 percent of spot over the 2023 to October 2024 baseline (standard deviation 0.70), averaged 0.12 percent from November 2024 to April 2025, reached 1.71 percent (56 dollars an ounce at a London price of 3,279 dollars) on 28 April 2025, and reached 2.27 percent on 2 September 2025 after press reports of a customs ruling. The event study does not detect a response of the premium to general trade-policy news. Over the ten event windows with an unambiguous sign, the mean signed two-day change in the gold premium is minus 0.16 percent (standard error 0.35, t equal to minus 0.44) and 5 of ten events move in the hypothesized direction; the silver mean is 0.23 percent (t equal to 0.36). The seven events that concerned trade policy in general have means of minus 0.50 percent for gold (standard error 0.42) and minus 0.32 for silver (0.78). The three events that concerned bullion specifically have means in the hypothesized direction, 0.64 percent for gold (standard error 0.64, t equal to 0.99, 2 of 3 with the hypothesized sign) and 1.53 for silver (1.19, t equal to 1.29, 3 of 3), driven by the minus 2.14 percent two-day narrowing of the gold premium after the 5 September 2025 exemption order; this evidence is more consistent with the tariff hypothesis than the general events are, but it rests on three events in one episode and does not reject zero. In a regression of the daily premium change on the signed event dummy and financing controls over 372 trading days, the event coefficient is minus 0.08 percent for gold (standard error 0.27) and 0.14 for silver (0.26); adding the same-day futures return moves the gold coefficient to 0.11 (0.22). The placebo on platinum and copper futures returns is an inappropriate test of a location-spread hypothesis, and the absence of a platinum premium series is a limitation of the paper. The results are unchanged under a maturity-matched financing rate and under three roll rules. The paper then asks whether the public record on dealer positioning and warehouse stocks is consistent with an alternative in which the premium compensates dealers for balance-sheet capacity, following Hanson, Malkhozov and Venter (2024) and Greenwood, Hanson, Stein and Sunderam (2023). The evidence for that alternative is weak for gold, where weekly swap-dealer net positions are correlated with the premium at minus 0.32 over 79 weeks, and the model fails for silver: the swap-dealer correlation has the opposite sign (0.25), and the producer and merchant category, which carries the predicted sign (minus 0.30), is not a category that any institutional source links to bullion-bank location books. The primary contribution is the finding, subject to the low power of ten signed events, that general trade-policy news had no detectable effect on the premium at the two-day and ten-day horizons; the limited bullion-specific evidence points in the direction the tariff hypothesis predicts, and the dealer-capacity account is a tentative alternative that the data do not establish for gold and contradict for silver.
Keywords gold, silver, COMEX, EFP, basis, tariffs, intermediary asset pricing, dealer balance sheets, event study
1. Introduction
Between November 2024 and April 2025 the price of gold for delivery on COMEX, the New York futures exchange operated by CME Group, exceeded the London benchmark price by a margin several times its historical size, and registered COMEX gold stocks rose from 13.5 million troy ounces to more than 23 million within two months. Silver showed the same pattern: a premium that peaked at 4.6 percent of spot in mid-January 2025 and registered stocks that more than doubled over the following months. The prevailing interpretation in the financial press attributed both the premium and the inventory build to a single cause, the prospect that United States import tariffs announced by the incoming administration would extend to bullion, which would have made metal held in New York more valuable than metal held in London. This paper asks whether the premium responded to tariff news in the way that interpretation requires. It finds no detectable response, at the two-day or ten-day horizon, to the broad trade-policy announcements of late 2024 and 2025. For the three events that concerned bullion specifically the signed changes are in the hypothesized direction on average, which is more consistent with the tariff hypothesis, but they are three events drawn from one episode, August and September 2025, and they do not reject zero. It then asks whether the public record on dealer positioning and warehouse stocks is consistent with an alternative in which the premium compensates dealers for balance-sheet capacity, and finds that record weak for gold and contradicted for silver. The paper also states a limitation of its own placebo: a test on platinum and copper futures returns is the wrong test of a location-spread hypothesis, and the platinum premium that would be the right one could not be constructed.
The tariff interpretation has a testable implication. If the premium was compensation for tariff risk, it should have responded to news that changed the probability of a bullion tariff: widening on announcements that raised that probability and narrowing on announcements that lowered it. Metals that were not plausible tariff targets should not have responded on the same days in the same direction. The first contribution of the paper is to carry out that test with a dated set of tariff events and a premium series whose futures leg is built from explicit contract months under a documented roll rule.
The second, and more tentative, contribution is to set the tariff hypothesis against an alternative drawn from intermediary asset pricing. In that literature the price gap between two near-identical claims on the same asset, held in different locations or in different legal forms, is compensation for the balance-sheet capacity of the dealers who intermediate between them. Hanson, Malkhozov and Venter (2024) model the long-term swap spread as the price at which leverage-constrained intermediaries absorb an imbalance between end-user demand and supply, inclusive of a risk premium for the possibility that the imbalance widens before it closes. Greenwood, Hanson, Stein and Sunderam (2023) apply the same logic to term premia and exchange rates. In precious metals the corresponding object is the exchange-for-physical (EFP) spread, the difference between the price of a COMEX futures contract and the price of London metal that a dealer must bridge in order to deliver one against the other. A dealer short COMEX futures and long London metal is hedged with respect to the gold price but exposed to location. When many dealers hold that position simultaneously and their balance sheets are constrained by other commitments, the premium paid by a buyer of New York metal rises independently of tariff news.
The two hypotheses are not mutually exclusive and the available data do not separate them cleanly, but they differ in three predictions. Under the tariff hypothesis the premium responds to tariff news; under the dealer-capacity hypothesis it responds to any shock that strains dealer balance sheets, including movements in the gold price itself, and tariff news is one candidate among several. Under the tariff hypothesis gold and silver, which were plausible tariff targets, behave differently from platinum and copper, which were not; under the dealer-capacity hypothesis metals that share dealers and funding move together. Under both hypotheses a wide premium is followed by metal entering registered warehouses, since that is the arbitrage that closes it, but the dealer-capacity hypothesis additionally predicts co-movement between the premium and dealer inventory and positioning, for which the CFTC publishes weekly data.
The data comprise 917 trading days of COMEX settlement prices by contract month and London benchmark prices from January 2023 to September 2026, twelve tariff events dated from the Federal Register where an official document exists and from the press where it does not, of which two share a trading-day window and are treated as one event of ambiguous sign, weekly CFTC swap-dealer positions, and partial COMEX depository stock records assembled from archived CME Group reports. The financing-adjusted gold premium is defined as the settlement of the contract held under the roll rule minus the London benchmark price minus the cost of financing the metal to the delivery month of that contract at the three-month bill rate. It averaged 0.02 percent of spot over the 2023 to October 2024 baseline, with a standard deviation of 0.70 percent. From November 2024 to April 2025 it averaged 0.12 percent and reached 1.71 percent, or 56 dollars an ounce at a London price of 3,279 dollars, on 28 April 2025; it averaged minus 0.08 percent in the ten weeks after 2 April 2025, and reached 2.27 percent on 2 September 2025. The silver premium was larger and more volatile, averaging 0.10 percent in the baseline and 0.77 percent in the episode, and peaking at 4.61 percent on 15 January 2025 and 3.90 percent on 29 August 2025. The dislocation described in the press is therefore present in the data, although the level of the gold premium outside the episode is lower than the first version of this paper reported, because the continuous front-month series used there embedded a roll premium that the explicit contract series removes.
The event-study results show no detectable effect of general trade-policy news. Across the ten event windows with an unambiguous hypothesized sign, the mean two-day change in the gold premium, signed so that widening on tariff-raising news and narrowing on tariff-lowering news both enter as positive, is minus 0.16 percent, with a standard error of 0.35 percent computed from the 337 non-event two-day changes and a t statistic of minus 0.44. Five of the ten gold events move in the hypothesized direction. The corresponding silver mean is 0.23 percent (t equal to 0.36). Over a ten-day window the gold mean is 0.04 percent (t equal to 0.11) and the silver mean is 0.31 (t equal to 0.38). The seven general trade-policy events have means of minus 0.50 (0.42) for gold and minus 0.32 (0.78) for silver. The three events that concerned bullion specifically (the 2 April 2025 exemption, the August 2025 customs ruling, and the 5 September 2025 exemption) have a mean signed two-day change of 0.64 percent for gold (standard error 0.64, t equal to 0.99) and 1.53 percent for silver (1.19, t equal to 1.29), 2 of 3 and 3 of 3 in the hypothesized direction. The gold figure is produced by the minus 2.14 percent narrowing over the two trading days after the 5 September 2025 exemption order (E12), the third version of this paper having dated that window from the signing day rather than from the first trading day after it. The bullion-specific evidence is therefore more consistent with the tariff hypothesis than the general events are, and it is also the weakest part of the design: three events, one episode, and a standard error of 0.64 percent. Excluding the two windows in which the gold premium moved most against the hypothesis, E06 and E09, the gold mean is 0.50 percent (standard error 0.39, t equal to 1.26); excluding E10 as well, it is 0.18 (0.42). In a regression of the daily change in the premium on the signed event dummy with changes in the bill rate and in SOFR as controls, over the 372 trading days from July 2024 to December 2025 with heteroskedasticity and autocorrelation consistent standard errors, the event coefficient is minus 0.08 percent for gold (standard error 0.27) and 0.14 percent for silver (0.26). Adding the same-day futures return as a control, which absorbs both the timing gap between the London fix and the New York settlement and any effect of the news that operates through the futures price, moves the gold coefficient to 0.11 (0.22) and the silver coefficient to 0.16 (0.30). Signed returns on platinum and copper on the same event days are not statistically distinguishable from those on gold and silver, but that placebo tests prices rather than location spreads and is an inappropriate test of the hypothesis, as Section 5.3 states; the absence of a London platinum benchmark, and hence of a platinum premium, is a limitation of the paper rather than a result. The results are unchanged when the financing adjustment uses a rate interpolated from the Treasury bill curve at the time to delivery of the contract held rather than the three-month bill rate (Section 5.9).
The positioning evidence is consistent with the dealer-capacity hypothesis for gold, and the hypothesis fails for silver; the statistical content is limited in both cases. Weekly swap-dealer net positions in gold futures are correlated with the premium at minus 0.32 over 79 weeks from July 2024 to December 2025, the sign implied by the dealer-capacity hypothesis if swap dealers are the parties short futures against London metal; in a regression of the premium on swap-dealer and managed-money net positions the swap-dealer slope is minus 0.008 percent per thousand contracts with a standard error of 0.006, which is not significant at conventional levels. In silver the swap-dealer correlation is 0.25, the opposite sign, and among the four CFTC trader categories the one whose net position carries the predicted negative sign is the producer, merchant, processor and user category (correlation minus 0.30, slope minus 0.089 percent per thousand contracts, standard error 0.032); no institutional source identifies that category with the bullion-bank location book, so the silver evidence is read as a failure of the model rather than as a different channel. Registered gold rose from 13.47 million ounces on 29 January 2025 to 24.25 million on 4 April 2025 in the archived reports, but the archive is too sparse in 2025 to relate daily inventory changes to the premium during the episode, and the regression that can be run in a dense 2026 window (gold coefficient 0.030 million ounces per percentage point, standard error 0.024, n equal to 51) has very low power and is uninformative about the 2025 episode.
The identifying assumptions are that the hypothesized sign of each event was fixed before the premium changes were computed, that the two-day and ten-day windows capture the response of a liquid market to public news, and that the non-event distribution of premium changes in the same sample is the appropriate null. The non-event sample is defined in Section 4.2 as every k-day change in the 372-day regression sample whose k-day interval does not overlap any k-day event window, which leaves 337 two-day and 228 ten-day changes. The limits of the design follow from those assumptions. Ten signed events give low power: with a non-event two-day standard deviation of 1.11 percent the standard error of the mean signed change is 0.35 percent, so an effect would have to be of order 0.7 percent to be detected at conventional levels. The futures-minus-London spread is the observable counterpart of the EFP spread that dealers quote, not the spread itself, and it carries an eight-hour timing gap between the London fix and the New York settlement. Public data do not identify who owned the metal that moved, by what route, or why. The two large exemption events of 2 April and 5 September 2025 are consistent with both hypotheses. Failure to reject the null of no tariff-news effect is not evidence for the dealer-capacity alternative, and the positioning and inventory patterns that are consistent with that alternative are correlations rather than identified effects.
The remainder of the paper is organized as follows. Section 2 sets out the two hypotheses and the related literature. Section 3 describes the data, including the construction of the futures series and a source-by-source account of coverage. Section 4 describes the methods. Section 5 presents the results, including the specification without the futures return control, the ten-day windows, the split of events into bullion-specific and general, the outlier exclusions, a case study of August and September 2025, the CFTC trader categories, and robustness checks on dealer spot quotations and on the financing rate. Section 6 discusses the interpretation, including a physical delivery cost channel that the data cannot measure. Section 7 lists the limitations. Section 8 concludes. Appendix A defines the events and Appendix B documents the roll rule and the sensitivity of the results to it.
2. Two hypotheses and the related literature
2.1 The tariff hypothesis
The tariff hypothesis holds that the COMEX premium in late 2024 and 2025 was a price for the risk that gold and silver bars imported into the United States would become subject to a customs duty. If a duty of x percent is imposed on imported bullion, then metal already inside the United States is worth up to x percent more than metal in London, since a buyer in New York can no longer obtain London metal without paying the duty. Before the duty is imposed, the premium should equal the probability of the duty times its size, less the cost of moving metal across the Atlantic, which is small. Announcements that raise the probability should widen the premium; announcements that lower it should narrow the premium; and the premium should collapse to the shipping cost when the duty is definitively ruled out. The last of these, compression after a definitive exemption, is the most parsimonious prediction of the tariff model, because it requires no assumption about how market participants read ambiguous trade-policy news; Section 5.4 examines it.
The hypothesis has an event-study implication, which I test. It also has a cross-sectional implication: metals that were credible tariff targets should behave differently from metals that were not. Gold and silver bullion were discussed as possible targets in the press from late 2024. Platinum is traded on NYMEX (also operated by CME Group) and is a plausible candidate in principle. In the press coverage reviewed for this paper, platinum did not appear as a bullion-tariff target in the way gold and silver did. No London platinum benchmark price series was available to this study, so platinum enters through its futures return rather than through a premium; Sections 5.3 and 7 discuss what that substitution costs. Copper is an industrial metal with a futures contract on COMEX; it was the subject of a separate Section 232 investigation in 2025, which makes it an imperfect placebo for tariff news in general but a usable placebo for bullion-specific tariff news, since no one proposed to treat copper as bullion.
2.2 The dealer-capacity hypothesis
The dealer-capacity hypothesis holds that the premium is a price for the balance-sheet capacity of the intermediaries who bridge the London and New York markets. The modern precious-metals market is a two-location market. London is the center of the over-the-counter market in physical metal; New York is the center of the futures market. Dealers, most of them large banks, are long London metal and short COMEX futures, or the reverse, as a matter of course, and they quote the EFP spread at which a customer can exchange one for the other. When end-user demand to hold New York exposure rises relative to London exposure, dealers must absorb the imbalance. Absorbing it uses balance sheet, exposes the dealer to the risk that the imbalance widens before it closes, and therefore commands a premium.
This is the mechanism of Hanson, Malkhozov and Venter (2024) for the swap spread and of Greenwood, Hanson, Stein and Sunderam (2023) for term premia and exchange rates, applied to a market where the two legs are the same bar of metal. It is also the mechanism of the covered interest parity literature, where Du, Tepper and Verdelhan (2018) show that post-2008 CIP deviations are priced by the balance-sheet costs of the banks that would otherwise arbitrage them away. The older limits-to-arbitrage literature, in particular Gromb and Vayanos (2002) and Shleifer and Vishny (1997), supplies the general point that arbitrage requires capital and that the price of a near-arbitrage is the price of that capital. He and Krishnamurthy (2013) give it a general-equilibrium form in which intermediary net worth is the state variable that prices assets.
In commodity markets specifically, Acharya, Lochstoer and Ramadorai (2013) show that limits to arbitrage affect commodity futures risk premia through the hedging demand of producers and the capital of speculators, and Kang, Rouwenhorst and Tang (2020) decompose futures risk premia into components that compensate hedgers and components that compensate speculators for providing liquidity. The theory of storage (Working, 1949; Fama and French, 1987) links the futures-spot basis to inventories and the convenience yield; in a two-location market, the location basis plays the same role for inventory in a particular place.
The dealer-capacity hypothesis has three implications that I examine. First, the premium should respond to anything that strains dealer capacity, of which the gold price itself is the most obvious candidate: a sharp rise in the gold price raises the dollar value of every dealer’s position and the margin it must post, and a dealer that is short futures faces margin calls as the price rises. The same-day futures return should therefore explain a share of the premium change, although at the daily frequency this prediction cannot be separated from the timing gap between the London fix and the New York settlement. Second, gold, silver, platinum and copper share dealers and funding markets, so their price movements on days of stress should be correlated regardless of tariff exposure. Third, dealer positioning as reported to the CFTC should co-move with the premium, and a wide premium should be followed by metal moving into registered warehouses, since that is the physical form the arbitrage takes.
2.3 The policy-uncertainty literature
The tariff hypothesis is a special case of the general proposition that policy uncertainty is priced. Pastor and Veronesi (2012) model the pricing of uncertainty about government policy; Baker, Bloom and Davis (2016) measure it; Caldara, Iacoviello, Molligo, Prestipino and Raffo (2020) measure trade-policy uncertainty in particular and find real effects on investment. The 2018 to 2019 tariff episode has been studied for its effects on prices and welfare by Amiti, Redding and Weinstein (2019) and Fajgelbaum, Goldberg, Kennedy and Khandelwal (2020), who find near-complete pass-through of tariffs to domestic prices. The present paper does not estimate pass-through; a tariff on bullion was never imposed. It asks whether the anticipation of one was priced in the location spread, which is a narrower question.
2.4 Gold as an asset
Gold is held for reasons that have little to do with its industrial use. Erb and Harvey (2013) document the weak relation between gold and inflation at horizons investors care about; Baur and Lucey (2010) examine gold as a hedge and a safe haven. None of that literature bears on the location spread, which is the subject here, but it matters for interpretation: a rise in the gold price driven by safe-haven demand is itself a strain on dealer balance sheets, and 2025 was a year of very large increases in the gold price.
3. Data
Every number in this paper is computed from raw files archived in the replication package by a single script, and every source is recorded in a data audit ledger with the institution that publishes the series, the coverage obtained, and the dates of the observations used. Where a primary series could not be obtained in full, the ledger records what was obtained and how the gap affects the estimates. I describe each group of sources in turn, because the coverage of the sources determines what the paper can claim.
3.1 Futures prices and the roll rule
The futures leg of the premium is built from CME Group daily settlement prices and open interest by explicit contract month for COMEX gold (GC) and silver (SI), from June 2010 to October 2026. The contract held on each day is chosen by a documented rule rather than by a compiled continuous series. The active contract months are February, April, June, August, October and December for gold and March, May, July, September and December for silver. Under the primary rule (rule A), the series holds the nearest active-month contract and rolls to the next active month on the first day on which the prior-day open interest of the next contract exceeds that of the contract held, and in all cases before the first notice day, taken as the last business day of the month preceding the delivery month. From January 2023 the gold series rolls 23 times and the silver series 19 times, and every gold roll under rule A is triggered by the open-interest crossover rather than by the first-notice backstop. Two alternative rules are used for sensitivity: rule B rolls five business days before first notice and rule C ten business days before, regardless of open interest. Appendix B lists the rules and reports the main results under each; the estimates are not sensitive to the choice.
As a check on the first version of this paper, which used a compiled continuous front-month series whose roll convention was not documented in that version (the series rolled to the next contract month ahead of first notice on a schedule that was not stated and that, judging from the days on which it diverges from rule A, held the deferred month for several trading days before the open-interest crossover), the rule A settlement matches that series to within 0.10 dollars on 87.8 percent of days for gold and 84.3 percent of days for silver. The days that do not match are concentrated around rolls, where the continuous series held a deferred contract and the premium computed from it embedded the contango between the two months. This is the reason the baseline gold premium reported here, 0.02 percent of spot, is lower than the 0.51 percent reported in the first version.
Platinum (PL) and copper (HG) enter only through their futures returns, for which a continuous front-month series is adequate because the roll affects the level and not the daily log return outside roll days.
3.2 London benchmark prices
The London price of gold is the LBMA Gold Price, set by auction at 10:30 and 15:00 London time; the London price of silver is the LBMA Silver Price, set at 12:00. The LBMA daily prices were obtained from a licensed redistributor of the benchmark, one observation per London business day from 2 January 2023 to 5 October 2026: 977 prices per metal, with four dates not yet published at the time of collection. On United Kingdom bank holidays the redistributed series carries forward the previous day’s price; these 31 gold and 37 silver dates were identified by the equality of the price with the previous close and dropped. The gold price used is the AM auction. The silver price is timestamped by the redistributor at 10:30, although the LBMA silver auction is at noon; I use the price as published.
Two checks were run. First, spot checks of the historical series against the published 21 January 1980 gold AM price (843 dollars) and the 18 January 1980 silver price (49.45 dollars) matched. Second, the spot series used in the first draft of this paper, XAUUSD and XAGUSD quotations compiled from dealer prices and timestamped near the New York futures close, was retained as a cross-check and as the basis for the robustness check in Section 5.7. Its level correlation with the LBMA price is 0.9995 for gold and 0.9983 for silver, and the mean difference, LBMA minus dealer spot, is minus 0.03 percent of spot for gold (standard deviation 0.89) and 0.10 percent for silver (standard deviation 1.87). No London platinum benchmark price was obtained, so no platinum premium is computed.
The timing of the two legs matters. The LBMA gold price is fixed at 10:30 London, which is 05:30 New York; COMEX settles at 13:30 New York. The same-day premium therefore spans eight hours of trading, and any move in the gold price during those hours enters the premium as noise. This is why the premium series computed on the LBMA price is noisier than the series computed on dealer spot quotations near the futures close, and it is why the same-day futures return is reported as a control in a second regression specification. A premium computed from a London PM price and a New York settlement would be cleaner; the PM price was not available from the redistributor at the daily frequency I used.
3.3 Financing rates
The three-month Treasury bill rate (DTB3), the four-week bill rate (DTB4WK), the Secured Overnight Financing Rate (SOFR), and the one-month, three-month and six-month constant-maturity Treasury yields (DGS1MO, DGS3MO, DGS6MO) are Federal Reserve series obtained from the Federal Reserve Bank of St. Louis FRED database. The three-month bill rate is used to compute the primary financing adjustment; a maturity-matched rate interpolated from the four-week bill, three-month bill and six-month constant-maturity yields at the time to delivery of the contract held is used in the robustness check of Section 5.9. Changes in the bill rate and in SOFR are controls in the regressions.
3.4 Tariff events
Twelve tariff events are dated. Where an official document exists, its signing date was taken from the Office of the Federal Register, whose records give the document number for ten of the twelve. Two events are press-dated: the 25 November 2024 social-media post announcing 25 percent tariffs on Canada and Mexico and an additional 10 percent on China, and the 8 August 2025 press reports of a Customs and Border Protection ruling that one-kilogram and 100-ounce gold bars would be subject to the reciprocal tariff. For the 1 February 2025 orders, the signing date in the Federal Register is 1 February but the first trading day on or after it is 3 February, which coincides with the signing date of the 3 February pause. The two documents therefore share one trading-day window, carry opposite hypothesized signs, and are treated as a single event, E03/E04, of ambiguous sign. It is reported in Table 1 but excluded from the signed statistics, which rest on the remaining ten events.
The events and their hypothesized signs are listed in Table 1. A plus sign means the event should widen the premium under the tariff hypothesis because it raised the probability or breadth of tariffs; a minus sign means the event should narrow the premium because it paused, exempted, or narrowed them. The signs were fixed before the premium changes were computed. The two events that matter most for the narrative are E08, the 2 April 2025 reciprocal-tariff order whose Annex II exempted bullion, and E12, the 5 September 2025 order that exempted gold bullion after the August customs ruling had put it in doubt. Both are hypothesized to narrow the premium.
The events fall into two groups, which Section 5.2 reports separately. Three events concerned bullion specifically: E08, whose Annex II exempted bullion from the reciprocal tariffs; E11, the press reports of a customs ruling that one-kilogram and 100-ounce gold bars were subject to the reciprocal tariff; and E12, the order that exempted gold bullion after that ruling. The remaining eight windows, seven of them signed, concerned trade policy in general and bear on bullion only through the inference that a broader or higher tariff regime made a bullion tariff more likely. The grouping was fixed on the basis of the content of each document, not on the premium changes.
No event in the list is an official announcement of a tariff on bullion, because there never was one. The events are announcements about tariffs in general, from which market participants had to infer the probability that bullion would be included. That is the correct test of the hypothesis as the press stated it, but it means the test has less power than a test of a bullion-specific announcement would have.
3.5 Positioning
Weekly Commitments of Traders data in the disaggregated futures-only format come from the CFTC’s annual historical files for 2023 through 2026. I use the net position (long minus short) of each of the four reportable categories in COMEX gold and silver, producer, merchant, processor and user; swap dealer; managed money; and other reportables, together with total open interest. Positions are as of Tuesday and are matched to the premium on the same Tuesday.
3.6 Warehouse stocks
CME Group publishes daily spreadsheets of gold and silver stocks in COMEX-approved depositories, split into registered (metal with a warrant that can be delivered against a futures contract), eligible (metal of deliverable quality without a warrant), and, for gold since 2022, pledged. A complete daily history of these reports was not available to me; the series used here is assembled from irregular archived copies of the reports, parsed into a daily panel with gaps. For gold, 69 archived reports give 79 panel days from 29 January 2025 to 1 October 2026, of which only ten fall before 2026; for silver, 102 reports give 153 days from 5 January 2024, of which twelve fall before 2026. The 2025 inventory build is therefore observed at a handful of dates rather than daily; no archived report falls in August or September 2025, so the case study of Section 5.5 has no inventory series. The regression of inventory changes on the premium is run only in the archive-dense 2026 window, and Section 5.7 states why it is uninformative about 2025. A complete daily history would be the single most valuable data improvement available to the paper.
3.7 Coverage
After aligning the contract-month settlements, London prices, financing rates and placebo returns on common London business days, dropping carried-forward holiday rows, and dropping days on which the contract held has no settlement, the panel has 917 trading days from 3 January 2023 to 29 September 2026 for every series. Daily changes are computed on the full panel before any subsample is taken. The event-study regressions use the 372 trading days from 1 July 2024 to 31 December 2025 that bracket the tariff episode, and every regression in Section 5 has 372 observations; the non-event two-day distribution has 337 observations and the non-event ten-day distribution 228, under the definition given in Section 4.2. The positioning analysis uses the 79 Tuesdays in the same span.
4. Methods
4.1 The premium
For each metal and day t, the raw premium is the settlement F(t) of the contract held under rule A minus the London price S(t), in dollars per ounce and as a percent of S(t). The financing-adjusted premium subtracts the cost of carrying the metal from t to the first business day of the delivery month of the contract held, at the three-month bill rate r(t): carry(t) equals S(t) times r(t) times T(t) divided by 360, where T(t) is the number of calendar days from t to the first business day of that delivery month, or zero once inside it. Because the contract held is known on every day, T(t) refers to the contract actually priced rather than to the next active month in the calendar, which was the approximation used in the first version. The adjusted premium in percent is 100 times (F(t) minus carry(t)) divided by S(t), minus 100. The adjustment remains approximate: it uses the bill rate rather than a gold lease or repo rate and it ignores storage and insurance. The three-month bill is not maturity-matched to T(t), which ranges from 3 to 123 calendar days with a mean of 50 over the panel. Section 5.9 replaces r(t) with a rate interpolated linearly on the Treasury bill curve at T(t), using the four-week bill, the three-month bill and the six-month constant-maturity yield as knots, and reports that no result changes. Its purpose is to remove the mechanical rise in the futures price with time to delivery so that the remainder can be read as a location premium. All results are reported for the adjusted premium; the raw premium is in the replication package.
4.2 Event study
For each event I identify t0 as the first trading day in the panel on or after the event date and t1 as the following trading day. The two-day change in the adjusted premium is the premium at t1 minus the premium at the close before t0. The ten-day change is the premium at the ninth trading day after t0 minus the premium at the close before t0, and is applied to every event rather than to a selected subset, so that the ten-day horizon is a second pre-specified window and not a post-hoc choice. The signed change multiplies each change by plus one for events hypothesized to widen the premium and minus one for events hypothesized to narrow it, so that a change in the hypothesized direction is positive. The merged event E03/E04 has no sign and is excluded from the signed statistics.
The null distribution is the empirical distribution of non-event two-day (or ten-day) changes in the 1 July 2024 to 31 December 2025 sample. A k-day change ending on trading day t, defined as the premium at t minus the premium at t minus k, is a non-event change if t lies in the 372-day sample and none of the k trading days from t minus k plus 1 to t lies inside any of the eleven k-day event windows, where the two-day window is t0 and t1 and the ten-day window is t0 to t9. The exclusion buffer therefore equals the window length. Of the 372 sample days, 370 admit a two-day change whose interval lies inside the sample; the eleven two-day windows cover 22 trading days and exclude 33 of those changes, leaving 337. Of the 362 ten-day changes whose interval lies inside the sample, the eleven ten-day windows, which cover 88 trading days (the E03/E04 and E05 and E06 windows overlap), exclude 134, leaving 228. The third version of this paper reported 339 and 239; the counts given here are produced by the replication script, which now requires the whole k-day interval to lie inside the sample rather than only its end date, and are the same for gold and silver. The third version also dated the E12 window from 5 September 2025, the signing day of the exemption order, rather than from the first trading day on or after it; the window now begins on 8 September, consistent with the rule stated above, which changes the E12 entries in Table 1 and every statistic that includes them. For each event I report the two-sided empirical p value, the fraction of non-event changes at least as large in absolute value. For the set of ten signed events I report the mean signed change; its standard error, computed as the non-event standard deviation divided by the square root of ten; the t statistic from that standard error; a second t statistic that uses the standard deviation of the ten signed event changes themselves; the share of events with the hypothesized sign; and the number of events, among all eleven windows, beyond two non-event standard deviations. For the count of exceedances I report the binomial probability of observing at least that many among eleven independent windows when each has a five percent chance of exceeding the threshold under the null. This is the event-study design of MacKinlay (1997) with an empirical rather than a parametric null. Three further summaries are reported. First, the same statistics are computed separately for the three bullion-specific events and the seven general trade-policy events defined in Section 3.4. Second, the mean signed change is recomputed after excluding the windows in which the gold premium moved most against the hypothesis, E06 and E09, and then E10 as well, which is the one large move in the hypothesized direction; these exclusions are diagnostic and were not pre-specified. Third, the standard deviation of the signed event changes themselves is reported alongside the non-event standard deviation.
The same two-day window is applied to the log returns of gold, silver, platinum and copper futures, signed the same way. If the tariff hypothesis is correct and bullion-specific, gold and silver returns should respond to the events and platinum and copper returns should not.
4.3 Regressions
The daily change in the adjusted premium is regressed on a signed event-window dummy (plus one on t0 and t1 of widening events, minus one on those of narrowing events, zero otherwise, including on the merged event), the daily change in the bill rate, and the daily change in SOFR, over the 372 trading days from 1 July 2024 to 31 December 2025. Standard errors are heteroskedasticity and autocorrelation consistent with five lags (Newey and West, 1987). With 372 observations the rule of thumb of the integer part of T to the power one quarter gives four lags and the rule of 4 times (T divided by 100) to the power two ninths gives 5.4; five lags is between the two, and Section 5.3 reports that the standard errors with four lags differ from those with five in the third decimal place. This specification without the same-day futures return is the primary one. A second specification adds the same-day log return of the metal’s own futures contract. The return is included in the second specification because of the eight-hour timing gap described in Section 3.2 and because the dealer hypothesis predicts that price moves themselves strain capacity. The return is, however, a bad control in the sense of Angrist and Pischke (2009): it is itself an outcome of the news on event days, so that if an announcement moves the futures price during the New York session the same-day return absorbs that move and the coefficient on the event dummy is biased toward zero. The two specifications therefore bound the event effect from the two sides, and the primary inference rests on the one without the return. A third specification replaces the single signed dummy with two, one for the bullion-specific events and one for the general trade-policy events. Placebo regressions put the signed log return of each of the four metals on the left-hand side, with the signed event dummy and the bill-rate change on the right, over the same 372 days.
4.4 Compression checks
For the two exemption events, E08 (2 April 2025) and E12 (5 September 2025), I report the mean adjusted premium in the ten trading days ending on the trading day before t0 and the ten trading days starting on the trading day after t0, so that the event window itself is in neither mean. The first version of this paper and the second started the E12 after window on t0 itself (8 September); the window now starts on 9 September, and the E08 before window now ends on 1 April rather than 2 April. These were specified before the premium series was computed on the LBMA price, but they are descriptive, and since the ten-day window is now applied to every event in Table 1, the compression checks are read alongside the ten-day event statistics rather than in place of them.
4.5 Positioning and inventories
For the 79 Tuesdays from 2 July 2024 to 30 December 2025 I report the correlation between the adjusted premium and the net position of each CFTC category, the slopes from a regression of the premium on the swap-dealer and managed-money net positions jointly, in percent per thousand contracts with heteroskedasticity and autocorrelation consistent standard errors with four lags (Table 8; the second version of this paper described these as single-regressor slopes with ordinary least squares standard errors, which was inaccurate), and, for each of the four categories separately, the single-regressor slope with ordinary least squares standard errors and the correlation of weekly changes (Table 8b). For warehouse stocks I report the levels at each archived pre-2026 date and, in the archive-dense window, a regression of the change in total registered stock over the next five business days on the adjusted premium.
4.6 Computation
All computations were performed by Python scripts included in the replication package. A large language model was used for drafting and editing assistance. The author verified every number against the results file and is responsible for every interpretation and claim.
5. Results
5.1 The premium, 2023 to 2026
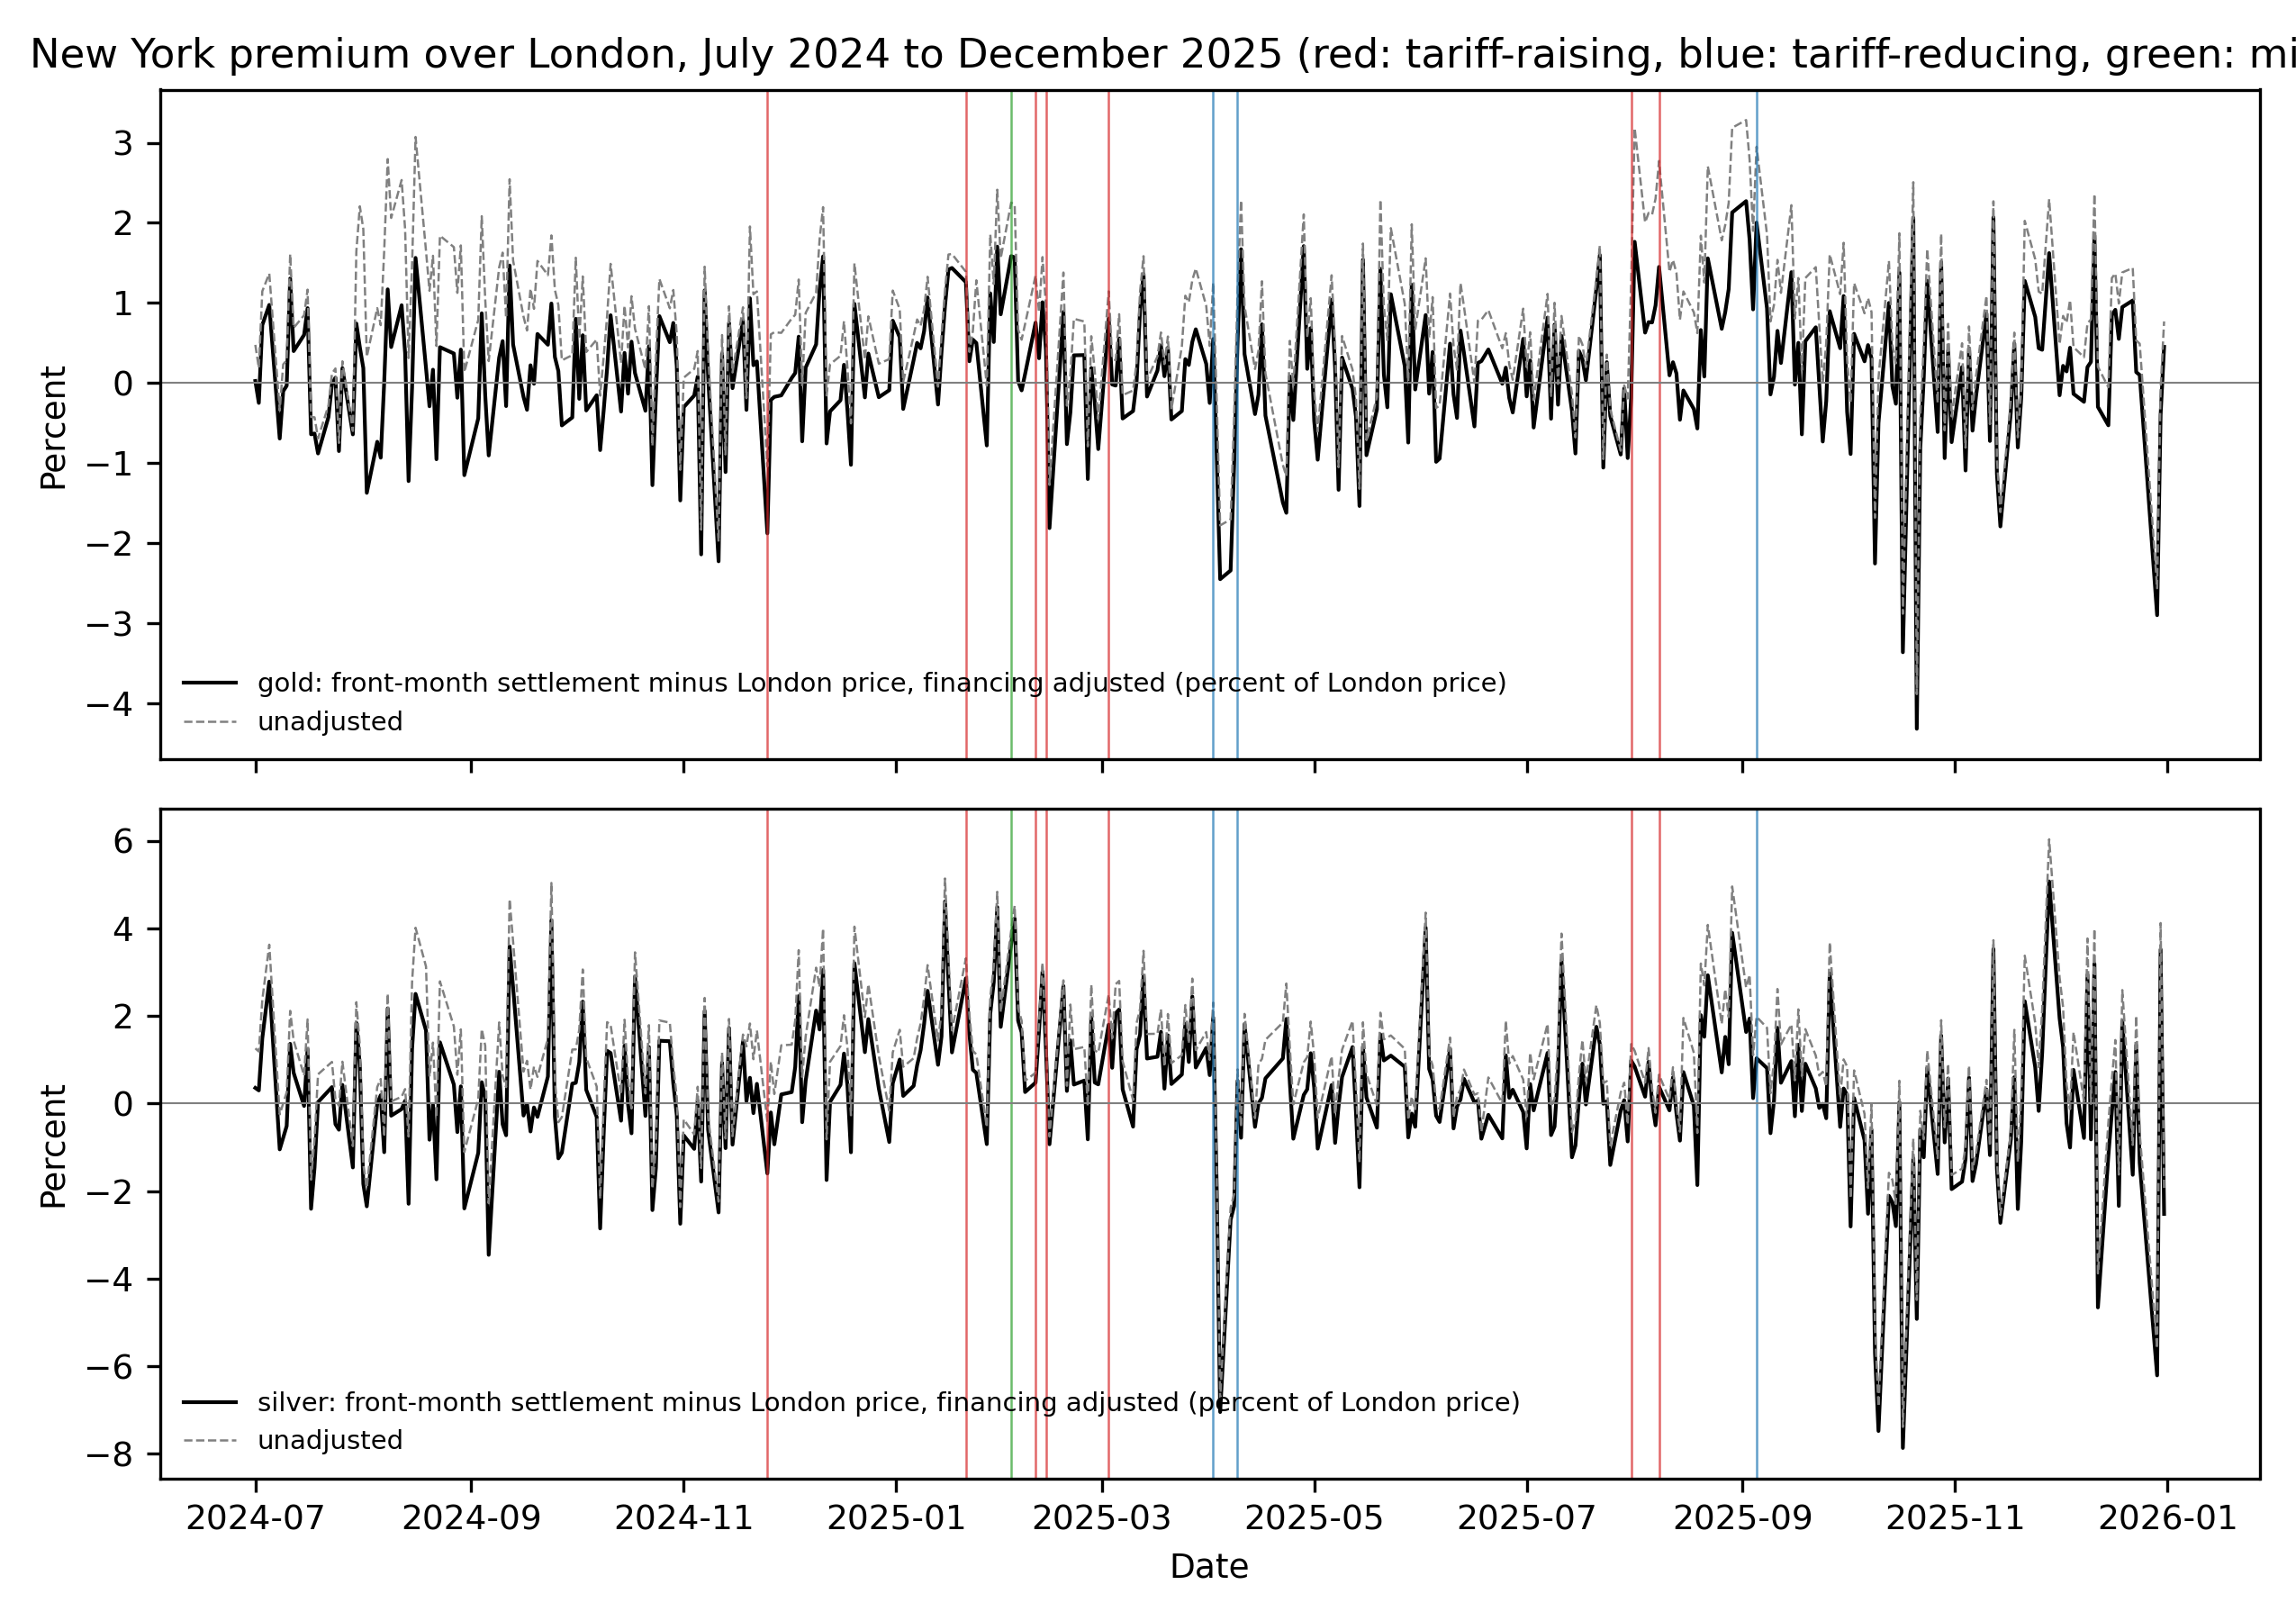
Table 2 summarizes the adjusted premium by period, and Figure 1 plots it with the event windows marked.
| Period or date | Gold | Silver |
|---|---|---|
| Baseline, January 2023 to October 2024, mean | 0.021 | 0.099 |
| Baseline, standard deviation | 0.697 | 1.382 |
| Episode, November 2024 to April 2025, mean | 0.116 | 0.765 |
| Episode, standard deviation | 0.853 | 1.561 |
| Episode peak | 1.709 (56.04 USD at a London price of 3,278.65 USD) on 2025-04-28 | 4.612 (1.38 USD at a London price of 29.99 USD) on 2025-01-15 |
| After 2 April 2025 to end-June 2025, mean | minus 0.080 | 0.018 |
| Late-summer 2025 peak | 2.271 on 2025-09-02 | 3.899 on 2025-08-29 |
| Latest observation, 2026-09-29 | 0.271 | minus 0.239 |
| Panel days | 917 | 917 |
Three features of the table bear on what follows. First, the baseline gold premium is close to zero, 0.021 percent of spot with a standard deviation of 0.697, which is what a financed location spread between two deliverable forms of the same metal should look like in normal conditions. The baseline level of 0.51 percent reported in the first version of this paper was a roll premium embedded in the compiled continuous series, not a location premium. Second, the gold premium in the November 2024 to April 2025 episode was above its baseline on average, 0.116 percent against 0.021, and its standard deviation rose from 0.697 to 0.853; the episode peak of 1.709 percent on 28 April 2025 is 2.4 baseline standard deviations above the baseline mean. The silver premium rose from 0.099 to 0.765 percent on average, and its peak of 4.612 percent on 15 January 2025 is 3.3 baseline standard deviations above the baseline mean. Third, the largest gold premium in the sample is not in the first-half 2025 episode but on 2 September 2025, after press reports on 8 August that a customs ruling had made one-kilogram and 100-ounce bars subject to the reciprocal tariff. That observation, 2.271 percent, is the one episode in the sample in which a bullion-specific tariff event preceded a specific premium move, and it ended with the 5 September exemption order.
The baseline standard deviations are large relative to the means. Part of this is variation in the location premium; part is the eight-hour timing gap between the London fix and the New York settlement. The same series computed on dealer spot quotations near the futures close has a baseline standard deviation of 0.265 percent for gold and 0.516 for silver (Table 9), which indicates how much of the variance in the LBMA-based series is timing.
5.2 Event study
Table 1 lists the eleven event windows with their dates, hypothesized signs, and two-day and ten-day changes in the adjusted premium.
| Event | Date (t0) | Description | Sign | Gold 2-day (pct) | p | Silver 2-day (pct) | p | Gold 10-day (pct) | p | Silver 10-day (pct) | p |
|---|---|---|---|---|---|---|---|---|---|---|---|
| E01 | 2024-11-25 | Social-media post: 25 pct on Canada and Mexico, 10 pct additional on China (press-dated) | plus | minus 0.48 | 0.66 | minus 0.65 | 0.75 | 0.21 | 0.82 | 1.67 | 0.42 |
| E02 | 2025-01-21 | America First Trade Policy memorandum (signed 2025-01-20, a market holiday) | plus | minus 1.16 | 0.26 | 0.42 | 0.82 | 0.15 | 0.87 | 2.48 | 0.24 |
| E03/E04 | 2025-02-03 | EO 14193, 14194, 14195: tariffs on Canada, Mexico, China (signed 2025-02-01); EO 14197, 14198: 30-day pause (signed 2025-02-03) | ambiguous | 0.71 | 0.49 | 2.47 | 0.21 | minus 2.67 | 0.044 | minus 2.68 | 0.23 |
| E05 | 2025-02-10 | Proclamations 10895, 10896: steel and aluminum | plus | 0.20 | 0.88 | 1.39 | 0.46 | 0.24 | 0.82 | 0.26 | 0.91 |
| E06 | 2025-02-13 | Reciprocal Trade and Tariffs memorandum | plus | minus 2.82 | 0.024 | minus 3.94 | 0.056 | minus 1.25 | 0.29 | minus 2.53 | 0.24 |
| E07 | 2025-03-03 | EO 14226, 14227, 14228: Canada and Mexico tariffs take effect, China to 20 pct | plus | 0.81 | 0.44 | 0.38 | 0.84 | 0.66 | 0.54 | 0.59 | 0.76 |
| E08 | 2025-04-02 | EO 14257: reciprocal tariffs; Annex II exempts bullion | minus | minus 0.65 | 0.54 | minus 2.53 | 0.20 | 0.10 | 0.89 | minus 0.65 | 0.73 |
| E09 | 2025-04-09 | EO 14266: 90-day pause | minus | 2.72 | 0.030 | 1.56 | 0.39 | 1.13 | 0.32 | 2.83 | 0.20 |
| E10 | 2025-07-31 | EO 14326: modified rates; Switzerland at 39 pct | plus | 2.70 | 0.030 | 1.71 | 0.36 | 1.06 | 0.35 | 0.64 | 0.74 |
| E11 | 2025-08-11 | Press reports of CBP ruling that 1 kg and 100 oz bars are tariffable (press-dated 2025-08-08) | plus | minus 0.87 | 0.39 | 0.34 | 0.85 | minus 0.89 | 0.42 | 2.02 | 0.35 |
| E12 | 2025-09-08 | EO exempting gold bullion from reciprocal tariffs (signed 2025-09-05) | minus | minus 2.14 | 0.056 | minus 1.71 | 0.36 | minus 1.48 | 0.21 | minus 0.12 | 0.96 |
Changes are unsigned (a positive number is a widening of the premium) in percent of the London price. Two-day change is the adjusted premium at t1 minus the adjusted premium at the close before t0; ten-day change is the premium at the ninth trading day after t0 minus the same base. p is the two-sided fraction of non-event changes (337 two-day, 228 ten-day; 1 July 2024 to 31 December 2025) at least as large in absolute value. E03 and E04 share one window because the first trading day after the 1 February signing is 3 February; they are merged and carry no sign. The t0 for E02 is 21 January 2025 because COMEX did not settle on 20 January. The t0 for E12 is 8 September 2025, the first trading day after the 5 September signing; the third version of this paper dated the E12 window from 5 September itself, which is corrected here (Section 4.2).
Table 3 summarizes the ten signed events at both horizons.
| Statistic | Gold, 2-day | Silver, 2-day | Gold, 10-day | Silver, 10-day |
|---|---|---|---|---|
| Mean signed change (pct) | minus 0.156 | 0.233 | 0.043 | 0.308 |
| Standard error (non-event SD divided by square root of 10) | 0.352 | 0.651 | 0.394 | 0.815 |
| t statistic, non-event SD | minus 0.44 | 0.36 | 0.11 | 0.38 |
| t statistic, event-sample SD | minus 0.27 | 0.39 | 0.15 | 0.55 |
| Non-event SD (pct) | 1.115 (n 337) | 2.058 (n 337) | 1.246 (n 228) | 2.578 (n 228) |
| Event-sample SD of the ten signed changes (pct) | 1.839 | 1.900 | 0.911 | 1.757 |
| Share of events with hypothesized sign | 0.50 (5 of 10) | 0.70 (7 of 10) | 0.60 (6 of 10) | 0.80 (8 of 10) |
| Windows beyond 2 non-event SD, of 11 | 3 (E06, E09, E10) | 0 | 1 (E03/E04) | 0 |
| Binomial probability of at least that many, 11 windows at 5 pct | 0.015 | 1.000 | 0.431 | 1.000 |
The signed two-day mean for gold is minus 0.16 percent with a standard error of 0.35: on average the gold premium did not move with the tariff hypothesis on event days, and five of ten events carry the hypothesized sign. Neither t statistic rejects a zero mean. Three of the eleven gold windows exceed two non-event standard deviations at the two-day horizon. Under the null that each window has a five percent chance of doing so, the probability of three or more exceedances among eleven is 0.015, so the count is more than chance would produce. The three exceedances do not, however, favor the tariff hypothesis. E10, the 31 July 2025 order that raised rates on Switzerland to 39 percent, widened the premium by 2.70 percent, in the hypothesized direction; Switzerland is the largest gold refining center, and this is the one event where the mechanism is specific enough to be credible. E06, the 13 February 2025 reciprocal-tariff memorandum, narrowed the premium by 2.82 percent, against the hypothesis; and E09, the 9 April 2025 90-day pause, widened it by 2.72 percent, also against the hypothesis. The silver premium also moved against the hypothesis on E06, by minus 3.94 percent over two days, the largest two-day silver change among the eleven windows, with a non-event p value of 0.056; no silver window exceeds two non-event standard deviations, but the largest silver move in the sample is a counter-hypothetical one. The event windows contain more large moves than non-event windows do, which is consistent with tariff announcements being days of stress in the metals market, but the direction of the moves is not the one a tariff-risk premium would produce.
Table 3b separates the three bullion-specific events from the seven general trade-policy events.
| Statistic | Gold, 2-day | Silver, 2-day | Gold, 10-day | Silver, 10-day |
|---|---|---|---|---|
| Bullion-specific (E08, E11, E12): mean signed change (pct) | 0.639 | 1.527 | 0.164 | 0.932 |
| Standard error (non-event SD divided by square root of 3) | 0.643 | 1.188 | 0.719 | 1.488 |
| t statistic, non-event SD | 0.99 | 1.29 | 0.23 | 0.63 |
| Event-sample SD (pct) | 1.509 | 1.106 | 1.206 | 0.980 |
| Share with hypothesized sign | 2 of 3 | 3 of 3 | 1 of 3 | 3 of 3 |
| Windows beyond 2 non-event SD, of 3 | 0 | 0 | 0 | 0 |
| General trade policy (E01, E02, E05, E06, E07, E09, E10): mean signed change (pct) | minus 0.497 | minus 0.322 | minus 0.009 | 0.040 |
| Standard error (non-event SD divided by square root of 7) | 0.421 | 0.778 | 0.471 | 0.974 |
| t statistic, non-event SD | minus 1.18 | minus 0.41 | minus 0.02 | 0.04 |
| Event-sample SD (pct) | 1.965 | 1.952 | 0.865 | 2.008 |
| Share with hypothesized sign | 3 of 7 | 4 of 7 | 5 of 7 | 5 of 7 |
| Windows beyond 2 non-event SD, of 8 (including E03/E04) | 3 (E06, E09, E10) | 0 | 1 (E03/E04) | 0 |
The three bullion-specific events are the ones on which the tariff hypothesis makes its sharpest prediction. For gold their mean signed two-day change is 0.64 percent with a standard error of 0.64 (t equal to 0.99), and 2 of the three carry the hypothesized sign; the mean is produced by E12, the minus 2.14 percent narrowing after the September exemption order (empirical p 0.056), with E08 at 0.65 signed and E11 at 0.87 signed. With three events the standard error is 0.64 percent, so only an effect larger than about 1.3 percent could have been detected, and the test on this subset is close to uninformative on its own. For silver the bullion-specific mean is 1.53 percent (standard error 1.19, t equal to 1.29), 3 of three in the hypothesized direction, and all three ten-day changes are in the hypothesized direction, with a mean of 0.93 percent (standard error 1.49). None of these rejects zero, but the point estimates for the bullion-specific group are in the direction the tariff hypothesis predicts for both metals at both horizons, which the third version of this paper, with the E12 window misdated, did not find. The seven general trade-policy events carry a negative gold mean, minus 0.50 percent (t equal to minus 1.18), and all three windows beyond two standard deviations fall in this group. In the regression of Section 5.3 with separate dummies for the two groups, the bullion-specific coefficient is 0.318 percent for gold (standard error 0.367) and 0.777 for silver (0.375), and the general coefficient is minus 0.262 (0.339) and minus 0.145 (0.311). The silver bullion-specific coefficient is about two standard errors from zero; it rests on the same three windows and carries the same caveat.
Table 3c reports the mean signed change after excluding the windows in which the gold premium moved most against the hypothesis.
| Exclusion | Gold, 2-day: mean (SE; t) | Silver, 2-day: mean (SE; t) | Gold, 10-day: mean (SE; t) | Silver, 10-day: mean (SE; t) | n |
|---|---|---|---|---|---|
| None (Table 3) | minus 0.156 (0.352; minus 0.44) | 0.233 (0.651; 0.36) | 0.043 (0.394; 0.11) | 0.308 (0.815; 0.38) | 10 |
| Excluding E06 and E09 | 0.497 (0.394; 1.26) | 0.978 (0.728; 1.34) | 0.350 (0.440; 0.79) | 1.056 (0.911; 1.16) | 8 |
| Excluding E06, E09 and E10 | 0.182 (0.421; 0.43) | 0.874 (0.778; 1.12) | 0.249 (0.471; 0.53) | 1.115 (0.974; 1.14) | 7 |
Standard errors use the non-event SD divided by the square root of n. The exclusions are diagnostic and were not pre-specified.
Dropping E06 and E09, the two windows that moved against the hypothesis by more than two standard deviations, turns the gold two-day mean positive, 0.50 percent, with a t statistic of 1.26; dropping E10 as well, the one large move in the hypothesized direction, lowers it to 0.18 (t equal to 0.43). The negative sign of the full-sample gold mean is therefore produced by two windows, and without them the point estimate has the hypothesized sign but is about one standard error from zero. For silver the exclusions raise the two-day mean to 0.98 and the ten-day mean to 1.06 percent, with t statistics of 1.34 and 1.16 against the non-event standard deviation; eight of eight ten-day changes then carry the hypothesized sign, which under a binomial null with probability one half has probability 0.004, but the eight changes are not independent of the gold changes on the same days and the exclusion was chosen on the gold series. The silver E06 two-day change of minus 3.94 percent (p equal to 0.056) is itself a counter-hypothetical move nearly as large as the gold one.
At the ten-day horizon there is no pattern. The gold mean is 0.04 percent (t equal to 0.11), 6 of ten events carry the hypothesized sign, and the one window beyond two standard deviations is the merged event, which has no sign. The silver mean is 0.31 percent (t equal to 0.38) with 8 of ten events in the hypothesized direction, but the non-event ten-day standard deviation for silver is 2.58 percent, so the mean is well within one standard error of zero.
The two events that matter most for the popular account are E08 and E12, the two exemptions, both hypothesized to narrow the premium. At the two-day horizon E08 narrowed the gold premium by 0.65 percent and the silver premium by 2.53 percent, with empirical p values of 0.54 and 0.20, and E12 narrowed the gold premium by 2.14 percent (p equal to 0.056) and the silver premium by 1.71 (0.36). At the ten-day horizon E08 is followed by a 0.10 percent wider gold premium and E12 by a 1.48 percent narrower one (p equal to 0.21). All four exemption-window changes are in the hypothesized direction at the two-day horizon, and the E12 gold change is the closest of them to the five percent threshold; none is distinguishable from the non-event distribution at that threshold.
5.3 Regressions
Table 4 reports the primary regressions, without the same-day futures return, and Table 5 the specification with it.
| Regressor | Gold: coefficient | Gold: SE | Gold: p | Silver: coefficient | Silver: SE | Silver: p |
|---|---|---|---|---|---|---|
| Signed event dummy | minus 0.085 | 0.269 | 0.752 | 0.136 | 0.262 | 0.604 |
| Change in 3-month bill rate (pp) | minus 0.901 | 2.696 | 0.738 | 2.565 | 5.399 | 0.635 |
| Change in SOFR (pp) | 0.417 | 1.137 | 0.713 | minus 1.135 | 2.573 | 0.659 |
| Constant | 0.001 | 0.028 | 0.982 | minus 0.002 | 0.052 | 0.970 |
| R squared | 0.001 | 0.001 | ||||
| Observations | 372 | 372 |
| Regressor | Gold: coefficient | Gold: SE | Gold: p | Silver: coefficient | Silver: SE | Silver: p |
|---|---|---|---|---|---|---|
| Signed event dummy | 0.106 | 0.221 | 0.632 | 0.161 | 0.296 | 0.585 |
| Change in 3-month bill rate (pp) | 1.507 | 2.174 | 0.488 | 3.224 | 4.418 | 0.466 |
| Change in SOFR (pp) | 0.679 | 0.757 | 0.370 | 0.942 | 1.382 | 0.495 |
| Same-day futures log return (pct) | 0.580 | 0.068 | less than 0.001 | 0.621 | 0.045 | less than 0.001 |
| Constant | minus 0.088 | 0.038 | 0.020 | minus 0.137 | 0.072 | 0.058 |
| R squared | 0.355 | 0.408 | ||||
| Observations | 372 | 372 |
In the primary specification the event dummy is minus 0.08 percent for gold with a standard error of 0.27 and 0.14 for silver with a standard error of 0.26. Neither differs from zero at conventional levels, and the gold point estimate has the wrong sign for the tariff hypothesis. The financing controls explain none of the daily variation (R squared 0.001 and 0.001). Adding the same-day futures return raises the R squared to 0.355 for gold and 0.408 for silver and moves the gold event coefficient from minus 0.08 to 0.11 and the silver coefficient from 0.14 to 0.16. The return carries a coefficient of 0.58 for gold and 0.62 for silver: a one percent rise in the futures price on a given day is associated with a 0.6 percentage point rise in the premium that day. Part of this is the timing gap, since a rally during the New York session raises F(t) but not S(t); part of it, under the dealer hypothesis, is a capacity effect; and part of it may be the channel through which tariff news reaches the premium, since an announcement that moves the futures price during the session would be absorbed by the return rather than attributed to the event dummy. The data cannot separate the three at the daily frequency. The comparison of the two tables bounds the event effect: without the return the point estimate is negative and insignificant, and with it the point estimate is positive and insignificant, so the null result for the event dummy does not depend on the control. What neither table can rule out is an effect smaller than the standard error of 0.25 percent, or an effect spread over more days than the window. With four HAC lags instead of five the event-dummy standard error is 0.273 for gold and 0.270 for silver, against 0.269 and 0.262 in Table 4. The specification with separate dummies for the bullion-specific and general events is reported in Section 5.2.
Table 6 reports the placebo regressions.
| Metal | Coefficient on signed event dummy (pct) | SE | p | Observations |
|---|---|---|---|---|
| Gold (GC) | minus 0.331 | 0.371 | 0.37 | 372 |
| Silver (SI) | minus 0.053 | 0.489 | 0.91 | 372 |
| Platinum (PL) | minus 0.260 | 0.499 | 0.60 | 372 |
| Copper (HG) | minus 1.322 | 1.160 | 0.25 | 372 |
Mean signed two-day log return over the ten signed event windows: gold minus 0.48 percent (t equal to minus 0.57), silver 0.10 (0.10), platinum minus 0.35 (minus 0.34), copper minus 2.58 (minus 1.08).
None of the four metals shows a return response to the signed events that differs from zero, and the four regression coefficients are all negative: on average prices fell on tariff-raising news and rose on tariff-lowering news, which is the risk-off and risk-on response of commodity prices to trade-war news rather than anything specific to bullion. Platinum and copper are not distinguishable from gold and silver. The limits of this placebo should be stated here rather than left to Section 7. The tariff hypothesis is a hypothesis about location spreads, and Table 6 tests prices. A bullion tariff would raise the New York price of gold relative to the London price without necessarily moving the world price of gold at all, so the futures return of gold need not respond to bullion-tariff news even if the hypothesis is correct, and the futures return of platinum need not fail to respond. The finding that the four metals move together on event days is therefore consistent with common risk-off trading and says little about whether the gold and silver location spreads responded to the news while a platinum location spread did not. The appropriate placebo would be a platinum premium computed from a London platinum benchmark, which was not available to this study. Table 6 provides little evidence against a bullion-specific effect and is reported because it was pre-specified.
5.4 Compression after the exemptions
Table 7 reports the mean adjusted premium in the ten trading days before and after the two exemption events.
| Window | Gold | Silver |
|---|---|---|
| E08: ten trading days ending 2025-04-01 | 0.143 | 1.095 |
| E08: ten trading days starting 2025-04-03 | minus 0.398 | minus 1.278 |
| E12: ten trading days ending 2025-09-05 | 1.349 | 1.621 |
| E12: ten trading days starting 2025-09-09 | 0.329 | 0.469 |
The E08 window (t0 equal to 2 April) and the E12 window (t0 equal to 8 September, the first trading day after the 5 September signing) are excluded from both means. The second version of this paper reported 0.189 and 1.258 for the E08 before window, which included 2 April, and 0.352 and 0.515 for the E12 after window, which began on 8 September.
At the ten-day horizon both exemptions were followed by a lower premium. The gold premium fell from 0.14 to minus 0.40 percent around 2 April and from 1.35 to 0.33 percent around 5 September. The silver premium fell from 1.10 percent to minus 1.28 percent around 2 April, a period in which COMEX silver traded below London silver, and from 1.62 to 0.47 percent around 5 September. These before-and-after differences are consistent with the tariff hypothesis, and they are also consistent with the dealer hypothesis: once the risk that metal in New York would be worth more than metal in London was removed, the end-user demand for New York exposure that dealers had been absorbing fell away, and the premium that compensated them for absorbing it fell with it. The compression indicates that tariff risk was part of the demand that dealers were pricing; it does not establish that the premium was the tariff risk. Compression after a definitive exemption is, as Section 2.1 states, the most parsimonious prediction of the tariff model, and it is the one prediction of that model that the data do not contradict. The ten-day event changes in Table 1 place the two windows in context: E12’s ten-day change of minus 1.48 percent has an empirical p of 0.21 and E08’s ten-day change is 0.10 percent, so neither compression is unusual against the distribution of ten-day changes in the sample. The September episode is examined day by day in Section 5.5.
5.5 Case study: August and September 2025
The two bullion-specific events of the summer of 2025, E11 and E12, are the only sequence in the sample in which a document that named gold bullion preceded a move in the premium, and Table 7b lists the daily gold and silver premium through the sequence, with the archived inventory and weekly positioning data that exist for the period.
| Date | Gold premium (pct) | Silver premium (pct) | Gold settlement, contract held (USD) | LBMA gold AM (USD) | Swap-dealer net, gold (contracts, Tuesdays) | Managed-money net, gold (contracts, Tuesdays) |
|---|---|---|---|---|---|---|
| -08-01 | 1.76 | 0.84 | 3399.8 | 3294.90 | ||
| 2025-08-04 | 0.63 | 0.16 | 3426.4 | 3359.05 | ||
| 2025-08-05 | 0.76 | 0.95 | 3434.7 | 3363.25 | minus 236,129 | 153,987 |
| 2025-08-06 | 0.76 | 0.04 | 3433.4 | 3362.70 | ||
| 2025-08-07 | 0.97 | minus 0.50 | 3453.7 | 3375.95 | ||
| 2025-08-08 (press reports of customs ruling) | 1.45 | 0.38 | 3491.3 | 3397.10 | ||
| 2025-08-11 (E11 t0) | 0.10 | minus 0.16 | 3404.7 | 3358.10 | ||
| 2025-08-12 | 0.26 | 0.60 | 3399.0 | 3347.55 | minus 223,315 | 148,287 |
| 2025-08-13 | 0.12 | minus 0.22 | 3408.3 | 3362.05 | ||
| 2025-08-14 | minus 0.46 | minus 0.85 | 3383.2 | 3356.70 | ||
| 2025-08-15 | minus 0.09 | 0.72 | 3382.6 | 3344.35 | ||
| 2025-08-18 | minus 0.33 | minus 0.05 | 3378.0 | 3348.45 | ||
| 2025-08-19 | minus 0.57 | minus 1.86 | 3358.7 | 3337.90 | minus 209,960 | 137,385 |
| 2025-08-20 | 0.66 | 2.02 | 3388.5 | 3327.25 | ||
| 2025-08-21 | 0.08 | 1.52 | 3381.6 | 3339.70 | ||
| 2025-08-22 | 1.56 | 2.93 | 3418.5 | 3328.40 | ||
| 2025-08-26 | 0.68 | 0.71 | 3433.0 | 3372.90 | minus 208,637 | 141,917 |
| 2025-08-27 | 0.88 | 1.52 | 3448.6 | 3381.90 | ||
| 2025-08-28 | 1.17 | 0.90 | 3474.3 | 3397.85 | ||
| 2025-08-29 | 2.13 | 3.90 | 3516.1 | 3407.50 | ||
| 2025-09-02 | 2.27 | 1.63 | 3592.2 | 3478.00 | minus 218,596 | 161,502 |
| 2025-09-03 | 1.79 | 1.94 | 3635.5 | 3536.90 | ||
| 2025-09-04 | 0.92 | 0.12 | 3606.7 | 3539.45 | ||
| 2025-09-05 (exemption order signed) | 2.00 | 1.03 | 3653.3 | 3548.60 | ||
| 2025-09-08 (E12 t0) | 0.93 | 0.81 | 3677.4 | 3610.50 | ||
| 2025-09-09 | minus 0.14 | minus 0.68 | 3682.2 | 3654.10 | minus 210,821 | 163,519 |
| 2025-09-10 | 0.08 | 0.06 | 3682.0 | 3646.40 | ||
| 2025-09-11 | 0.65 | 1.73 | 3673.6 | 3617.95 | ||
| 2025-09-12 | 0.25 | 0.47 | 3686.4 | 3645.35 | ||
| 2025-09-15 | 1.38 | 0.97 | 3719.0 | 3638.20 | ||
| 2025-09-16 | minus 0.02 | minus 0.29 | 3725.1 | 3695.40 | minus 236,987 | 158,971 |
| 2025-09-17 | 0.50 | 1.34 | 3717.8 | 3669.70 | ||
| 2025-09-18 | minus 0.64 | minus 0.17 | 3678.3 | 3672.45 | ||
| 2025-09-19 | 0.52 | 0.91 | 3705.8 | 3657.85 | ||
| 2025-09-22 | 0.70 | 0.34 | 3775.1 | 3721.25 | ||
| 2025-09-23 | minus 0.02 | minus 0.10 | 3815.7 | 3788.40 | minus 231,251 | 160,549 |
| 2025-09-24 | minus 0.73 | minus 0.01 | 3768.1 | 3768.05 | ||
| 2025-09-25 | minus 0.23 | minus 0.34 | 3771.1 | 3752.40 | ||
| 2025-09-26 | 0.90 | 2.97 | 3809.0 | 3748.75 | ||
| 2025-09-29 | 0.44 | minus 0.53 | 3855.2 | 3812.85 | ||
| 2025-09-30 | 1.09 | 0.34 | 3873.2 | 3806.55 | minus 222,839 | 145,227 |
No archived COMEX depository report falls between 10 July 2025 and 30 December 2025, so registered stocks cannot be shown for the window. 25 August 2025 is a London bank holiday and is dropped.
The daily series qualifies the summary given in the second version of this paper. The gold premium was 1.45 percent on Friday 8 August, the day of the press reports, having risen from a mean of 0.18 percent over 1 July to 7 August; on Monday 11 August, the first trading day of the E11 window, it was 0.10 percent, and it was negative on five of the following seven trading days. The two-day E11 change of minus 0.87 percent in Table 1 is this fall from the 8 August level. The premium then rose through the last ten days of August to 2.13 percent on 29 August and the sample maximum of 2.27 percent on 2 September, fell to 0.92 on 4 September, and was 2.00 percent on Friday 5 September, the day the exemption order was signed. On Monday 8 September it was 0.93 percent and on 9 September minus 0.14 percent. Its mean over the 19 trading days from 11 August to 5 September was 0.73 percent, and over 9 to 30 September 0.30 percent. The silver premium followed the same path with a peak of 3.90 percent on 29 August and means of 0.91 and 0.44 percent over the same two spans.
Read against the tariff hypothesis, the sequence has one feature in its favor and two against. In its favor, the premium was higher between the customs ruling and the exemption than before or after, and it fell by about 2 percentage points over the two trading days after the exemption order. Against it, the premium did not rise on the first trading day after the ruling became public but fell, from 1.45 to 0.10 percent, and the rise to the sample maximum came two to three weeks later, during a 100-dollar rally in the gold price between 19 August and 2 September. The daily premium in this window has a standard deviation of about 0.8 percent, so single-day readings carry little weight, and the pattern is consistent with the same-day futures return relation of Table 5 as much as with the news. The weekly positioning data show swap dealers reducing their net short from 236,129 contracts on 5 August to 208,637 on 26 August while the premium was rising, and extending it to 236,987 on 16 September after the premium had fallen, which is the opposite of the co-movement the dealer-capacity model predicts over this window; managed money was most net long on 2 and 9 September, at the peak of the premium. No inventory data exist for the window. The case study therefore does not resolve the question that Table 1 leaves open: the episode is consistent with a tariff effect concentrated in the days immediately after the exemption, and the two-day E12 change of minus 2.14 percent in Table 1 (empirical p 0.056) is the fall from the 5 September base of 2.00 percent to the 9 September reading of minus 0.14. The third version of this paper reported this change as 0.01 percent because it dated the window from 5 September, so that the base was the 4 September reading of 0.92 and the window ended on 8 September; Section 4.2 records the correction. It is one episode, and it is the largest single piece of evidence in the paper for the tariff hypothesis.
5.6 Positioning
Table 8 reports the co-movement of the premium with CFTC positioning over the 79 Tuesdays from 2 July 2024 to 30 December 2025.
| Statistic | Gold | Silver |
|---|---|---|
| Correlation, premium with swap-dealer net position | minus 0.317 | 0.253 |
| Slope, pct of spot per 1,000 contracts of swap-dealer net, joint regression with managed money (HAC(4) SE) | minus 0.0078 (0.0060) | 0.162 (0.035) |
| Correlation, premium with managed-money net position | 0.283 | 0.094 |
| Slope, pct per 1,000 contracts of managed-money net, same joint regression (HAC(4) SE) | 0.0015 (0.0035) | 0.132 (0.037) |
| Mean swap-dealer net position (contracts); weeks net short | minus 211,717; 79 of 79 | minus 36,999; 79 of 79 |
| Open interest peak (contracts) and week | 579,862 on 2024-07-16 | 184,831 on 2025-06-17 |
For gold the signs are those the dealer hypothesis predicts, but the magnitudes are modest. Swap dealers, the CFTC category closest to the bullion banks, are net short gold futures in every week of the sample, with a mean net position of minus 211,717 contracts, since they hedge London metal and customer long positions. The more net short they are, the more location risk they carry, and the wider the premium should be. The correlation of minus 0.32 between the premium and the swap-dealer net position has that sign, and the slope of minus 0.0078 percent per thousand contracts in the joint regression has a standard error of 0.0060, so it is not significant at the five percent level; the single-regressor slope in Table 8b is minus 0.0093 (0.0032). Managed money, the speculative category, is positively correlated with the premium at 0.28, with a slope of 0.0015 (standard error 0.0035). The first version of this paper reported a correlation of minus 0.42 and a slope of minus 0.0169 (standard error 0.0065) for swap dealers; the weaker relation here is the consequence of removing the roll premium from the series, and it should be read as a correlation in the predicted direction rather than as evidence that dealer positioning determines the premium.
For silver the signs are reversed. Swap dealers are net short silver in every week as well, with a mean of minus 36,999 contracts, but the premium is positively related to their net position: the correlation is 0.25 and the joint-regression slope is 0.162 percent per thousand contracts with a standard error of 0.035. Managed money is positively related too, at 0.132 (0.037). Under the dealer-capacity model as framed in Section 2.2, a more net short swap-dealer position should accompany a wider premium, and in silver it accompanies a narrower one.
Table 8b extends the comparison to all four reportable categories.
| Category | Gold: correlation of levels | Gold: slope, pct per 1,000 contracts (OLS SE) | Gold: correlation of weekly changes | Silver: correlation of levels | Silver: slope, pct per 1,000 contracts (OLS SE) | Silver: correlation of weekly changes |
|---|---|---|---|---|---|---|
| Producer, merchant, processor, user | minus 0.143 | minus 0.0104 (0.0082) | minus 0.082 | minus 0.303 | minus 0.0887 (0.0318) | minus 0.281 |
| Swap dealer | minus 0.317 | minus 0.0093 (0.0032) | minus 0.468 | 0.253 | 0.0473 (0.0206) | minus 0.163 |
| Managed money | 0.283 | 0.0070 (0.0027) | 0.380 | 0.094 | 0.0160 (0.0193) | 0.388 |
| Other reportables | 0.139 | 0.0085 (0.0069) | 0.287 | minus 0.198 | minus 0.0950 (0.0535) | minus 0.284 |
| Mean net position (contracts): producer/merchant; swap; managed money; other | minus 58,814; minus 211,717; 155,568; 85,222 | minus 32,061; minus 36,999; 31,367; 18,339 |
Slopes are from a separate regression of the premium on each category’s net position. Correlation of weekly changes is between the week-on-week change in the premium and the week-on-week change in the net position.
In gold, the swap-dealer category carries the predicted negative sign in levels (minus 0.32) and more strongly in weekly changes (minus 0.47): weeks in which swap dealers added to their net short were weeks in which the premium widened. Managed money carries the mirror-image positive sign (0.38 in changes), as it must when the two categories are the main counterparties to each other. The producer and merchant category, which in gold is small relative to swap dealers (mean net short 58,814 contracts against 211,717), is weakly negative. In silver the pattern is different. The swap-dealer category is positively related to the premium in levels (0.25) and weakly negatively in changes (minus 0.16). The category that carries the predicted negative sign in silver is producer, merchant, processor and user: correlation minus 0.30 in levels, slope minus 0.089 percent per thousand contracts (standard error 0.032), and minus 0.28 in changes. In silver the producer and merchant net short (mean 32,061 contracts) is comparable in size to the swap-dealer net short (36,999), whereas in gold it is a quarter of it. A conjecture would be that in silver a larger share of the bullion-bank location book is reported in the producer and merchant category, so that the category whose net short tracks location risk differs between the two metals. The CFTC does not publish the composition of either category, its reporting guidance places bullion banks that deal in swaps in the swap-dealer category for both metals, and no institutional source identifies the producer and merchant category with location books in silver. Without such a source the conjecture cannot be sustained, and the reading adopted here is that the dealer-capacity model as framed in Section 2.2 does not describe silver. The correlation of weekly changes between the premium and managed-money net positions is 0.39 in silver, as in gold, which is consistent with speculative long positioning accompanying a wider premium in both metals. On the evidence of Tables 8 and 8b, the positioning support for the dealer-capacity alternative rests on gold, and on a correlation rather than an identified effect; in silver the model as framed in Section 2.2 is contradicted by the swap-dealer series, and the fit of the producer and merchant category is a coincidence of sign that nothing in the public record explains.
5.7 Inventories
Table 9 reports COMEX registered and combined gold and silver stocks at the pre-2026 dates available in the archive.
| Date | Gold registered | Gold combined | Silver registered | Silver combined |
|---|---|---|---|---|
| -01-05 | 41.9 | 281.3 | ||
| 2024-03-05 | 52.0 | 283.8 | ||
| 2024-05-14 | 65.1 | 297.8 | ||
| 2025-01-29 | 13.47 | 30.98 | ||
| 2025-01-30 | 14.15 | 31.32 | ||
| 2025-03-27 | 22.75 | 43.35 | ||
| 2025-03-28 | 23.06 | 43.81 | ||
| 2025-04-04 | 24.25 | 45.06 | 158.4 | 492.0 |
| 2025-04-07 | 24.19 | 44.95 | 157.8 | 493.0 |
| 2025-07-10 | 20.20 | 36.75 | 191.6 | 494.9 |
| 2025-07-18 | 195.9 | |||
| 2025-12-31 | 19.36 | 36.40 | ||
| 2026-10-01 (latest) | 15.09 | 23.48 | 101.1 |
Combined is registered plus eligible plus, for gold, pledged. Blank cells indicate no archived report for that metal on that date.
The inventory build is confirmed at the dates available. Registered gold rose from 13.47 million ounces on 29 January 2025 to 23.06 million on 28 March and 24.25 million on 4 April, an increase of 10.8 million ounces, or 80 percent, in nine weeks. Combined gold stocks rose from 31.0 to 45.1 million ounces. Both then fell back, to 20.2 million registered in July, 19.4 million at the end of 2025, and 15.1 million at the latest archived report in October 2026, with combined stocks at 23.5 million, below where they started. Registered silver rose from 41.9 million ounces in January 2024 to 158.4 million in April 2025 and 195.9 million in July 2025 before falling to 101.1 million.
Registered gold peaked in the first week of April 2025, immediately after the 2 April exemption order, and declined thereafter. If metal was moved to New York to get ahead of a tariff, it stopped arriving when the tariff was ruled out, which is consistent with the tariff hypothesis. If metal was moved to New York to arbitrage a premium that compensated dealers for carrying location risk, it stopped arriving when the premium compressed, which is consistent with the dealer hypothesis. The two predictions coincide here, as they do for the compression in Section 5.4.
In the one window where the archive is dense enough to run a regression, 51 observations from 5 June to 24 September 2026, the change in total registered gold over the next five business days rises by 0.030 million ounces for each percentage point of adjusted premium (standard error 0.024, p equal to 0.22). For silver, 111 observations from 4 February 2026 give a coefficient of 0.303 million ounces per percentage point (standard error 0.162, p equal to 0.062). The signs are as both hypotheses predict, but neither coefficient is significant at the five percent level, and the regressions should be read as uninformative rather than as weak support. The gold regression has 51 observations in a window in which the premium had a standard deviation near its baseline and registered stocks changed by small amounts, so its power to detect an effect of the size that the 2025 build would imply is very low; the 2025 build of 10.8 million ounces in nine weeks, set against a premium that averaged 0.12 percent over the episode, would correspond to a coefficient two orders of magnitude larger than the one estimated, which says only that the 2026 window is not the 2025 episode. The first version reported a gold coefficient of 0.045 (standard error 0.021), and the change reflects the removal of the roll premium from the regressor. The regression is reported for completeness and plays no part in the conclusions. What would be needed is the daily depository history for 2025, which the archive does not hold.
5.8 Robustness: premium on dealer spot quotations
Table 10 repeats the event-study summary and the regressions with the premium computed on the dealer spot quotations described in Section 3.2, which are timestamped near the futures close and so carry less timing noise than the LBMA fix. The futures leg and the financing adjustment are the same as in the main results.
| Statistic | Gold | Silver |
|---|---|---|
| Baseline mean (SD), pct | minus 0.019 (0.265) | 0.093 (0.516) |
| Episode peak | 2.101 on 2024-12-18 | 3.938 on 2024-12-18 |
| Mean signed two-day change, 10 events (SE; t) | minus 0.054 (0.142; minus 0.38) | 0.074 (0.291; 0.26) |
| Non-event two-day SD, n 337 | 0.448 | 0.919 |
| Share with hypothesized sign, two-day | 0.60 (6 of 10) | 0.60 (6 of 10) |
| Windows beyond 2 non-event SD, of 11 (binomial p) | 2, E02 and E10 (0.102) | 1 |
| Mean signed ten-day change (t) | 0.114 (0.71) | 0.376 (0.99) |
| Event dummy, no return control (SE) | minus 0.035 (0.102) | 0.037 (0.153) |
| Event dummy, with return control (SE) | 0.004 (0.112) | 0.045 (0.125) |
| Same-day futures return coefficient (SE); R squared | 0.117 (0.019); 0.108 | not reported |
| Observations | 372 | 372 |
The dealer-spot series confirms that most of the variance of the LBMA-based premium is timing: the baseline standard deviation falls from 0.697 to 0.265 percent for gold and from 1.382 to 0.516 for silver, and the coefficient on the same-day futures return falls from 0.58 to 0.12. The event-study conclusions do not change. The mean signed two-day change in the gold premium is minus 0.05 percent with a standard error of 0.14, the event dummy is minus 0.03 (0.10) without the return control and 0.00 (0.11) with it, and the ten-day mean is 0.11 (t equal to 0.71). The number of windows beyond two standard deviations falls to two, E02 and E10, which is not unusual among eleven (binomial p equal to 0.102). The gold episode peak on the dealer-spot series falls on 18 December 2024 rather than 28 April 2025, which reflects the difference in timing of the two spot quotations on days of large intraday moves. The null result for tariff news therefore holds on the less noisy series, with standard errors less than half the size of those in the main tables. The fall in the return coefficient from 0.58 to 0.12 is informative in a qualitative sense. Under the LBMA fix, the futures price moves between the London afternoon and the New York close enter the measured premium mechanically, and a coefficient near 0.58 is the size that this timing gap would produce if roughly half of the daily futures return accrued after the fix. Under the dealer-spot series that gap is nearly closed, and the remaining coefficient of 0.12 (standard error 0.019) measures whatever association between same-day price changes and the location spread survives once timing is removed. That residual is consistent with a premium that widens when prices rise, as the dealer-capacity model predicts, but it is equally consistent with residual timing differences between the dealer quotation and the futures settlement, and the two cannot be separated with daily data. I therefore do not report the difference between the two coefficients as a decomposition into a timing effect and a capacity effect.
5.9 Robustness: maturity-matched financing rate
The primary financing adjustment uses the three-month bill rate regardless of the time to delivery T(t), which ranges from 3 to 123 calendar days over the panel with a mean of 50. Table 11 recomputes the premium with the rate interpolated linearly on the Treasury bill curve at T(t), with the four-week bill (DTB4WK) at 28 days, the three-month bill (DTB3) at 91 days and the six-month constant-maturity yield (DGS6MO) at 182 days as knots, flat outside the knots, and re-runs the main results.
| Statistic | Gold | Silver |
|---|---|---|
| Matched rate minus three-month bill rate, pp, mean (SD) over the panel | minus 0.009 (0.148) | minus 0.009 (0.148) |
| Four-week bill minus three-month bill, pp, mean (SD) over the regression sample | 0.078 (0.086) | same |
| Six-month yield minus three-month bill, pp, mean (SD) over the regression sample | 0.005 (0.072) | same |
| Matched-rate premium minus primary premium, pct of spot, mean (SD; largest absolute) | 0.0006 (0.0165; 0.153) | 0.0006 (0.0165; 0.153) |
| Baseline mean (SD), pct | 0.024 (0.698) | 0.101 (1.383) |
| Episode mean, pct | 0.113 | 0.762 |
| Episode peak, pct (date) | 1.707 (2025-04-28) | 4.610 (2025-01-15) |
| Late-summer 2025 peak, pct (date) | 2.270 (2025-09-02) | 3.899 (2025-08-29) |
| Mean signed two-day change, 10 events (SE; t) | minus 0.156 (0.352; minus 0.44) | 0.232 (0.651; 0.36) |
| Mean signed ten-day change (SE; t) | 0.043 (0.394; 0.11) | 0.308 (0.815; 0.38) |
| Event dummy, no return control (SE) | minus 0.085 (0.269) | 0.136 (0.262) |
| Event dummy, with return control (SE) | 0.106 (0.221) | 0.161 (0.296) |
| Observations | 372 | 372 |
Over the regression sample the bill curve was close to flat between four weeks and six months: the four-week bill exceeded the three-month bill by 0.078 percentage points on average (standard deviation 0.086) and the six-month yield exceeded it by 0.005 (0.072). A difference of 0.1 percentage points in the annual rate applied over 50 days changes the carry by 0.0014 percent of spot. The matched-rate premium differs from the primary premium by 0.0006 percent on average with a standard deviation of 0.0165 percent, and the two series have a correlation of 0.9998. The baseline mean moves from 0.021 to 0.024 percent, the episode peak from 1.709 to 1.707, and the event-study and regression statistics are unchanged to the third decimal place. The choice of financing rate does not bear on any conclusion.
6. Discussion
6.1 What the evidence supports
The evidence supports three statements and is consistent with a fourth. The dislocation was real: the gold premium reached 1.7 percent of spot in April 2025 and 2.3 percent in September 2025, against a baseline mean of 0.02 percent and a baseline standard deviation of 0.70, and the silver premium reached 4.6 and 3.9 percent against a baseline mean of 0.10. The inventory build was real: registered gold rose 80 percent in nine weeks and registered silver more than tripled over fifteen months. General trade-policy announcements had no detectable effect on the premium within a two-day or a ten-day window: the signed two-day mean is minus 0.16 percent for gold and minus 0.50 for the seven general events, the ten-day means are indistinguishable from zero, the sign of the full-sample mean depends on two counter-hypothetical windows, the event dummy is insignificant with and without the futures return control, on both spot series, under three roll rules and under a maturity-matched financing rate. This is the primary finding of the paper. The three bullion-specific events behave differently: their signed two-day means are 0.64 percent for gold and 1.53 for silver, in the direction the tariff hypothesis predicts, with 2 of 3 and 3 of 3 events carrying the hypothesized sign and a silver coefficient in the split regression about two standard errors from zero. That evidence is more consistent with the tariff hypothesis than with its absence, and it rests on three windows in one episode. The fourth statement, that the premium co-moved with swap-dealer positioning in gold in the direction the intermediary-imbalance models predict, with a correlation of minus 0.32 in levels and minus 0.47 in weekly changes, is a correlation consistent with the dealer-capacity account, not a test of it.
6.2 What the evidence does not support
The evidence does not support the statement that tariff announcements moved the premium, if “tariff announcements” means the broad trade-policy actions of late 2024 and early 2025. It does not refute the narrower statement that the bullion-specific events moved the premium, and the bullion-specific subset now points that way: the case study of Section 5.5 shows the premium higher between the customs ruling and the exemption than before or after, and a fall of about 2 percentage points over the two trading days after the exemption, alongside a fall rather than a rise on the first trading day after the ruling and a peak that coincided with a 100-dollar rally in the gold price. That sequence is the strongest single piece of evidence for a tariff effect in the paper, and it is one episode. The evidence does not support the statement that the premium was a pure tariff-risk premium, because a pure tariff-risk premium would have moved on tariff news in general, which it did not.
The evidence also does not establish the dealer-capacity hypothesis, and this version of the paper presents that hypothesis as a tentative alternative rather than as a finding. Failure to reject a null of no tariff-news effect in a test with ten events and a standard error of 0.35 percent is not evidence for an alternative. The facts that are consistent with the dealer-capacity account are a gold-only correlation with swap-dealer positions that is not significant at the five percent level in the joint regression, a strong same-day relation between the futures return and the premium that is confounded with the timing gap, and an inventory-flow regression in a later and quieter period that Section 5.7 states is uninformative. For silver the account is contradicted: the swap-dealer net position has the opposite sign from the one the model predicts, and the category that carries the predicted sign, producer, merchant, processor and user, is one for which no documentary evidence links the net position to bullion-bank location books. The silver result means that the dealer-capacity account as framed here fails for silver; the conjecture that the relevant category differs between the two metals has no institutional support and is not relied on. A description consistent with the gold evidence is that end-user demand for New York exposure rose in late 2024 and early 2025 for several reasons of which tariff uncertainty was one, that the gold price rose sharply at the same time, and that the premium widened as dealers were asked to carry more location risk; when the exemption orders removed one source of demand, the premium compressed, as it would under any account in which demand matters. That description is compatible with the gold data. It is not identified by them, it does not fit the silver data, and a tariff-news effect of the size the standard errors permit, up to 0.5 percent of spot over two days, cannot be ruled out.
6.3 The physical delivery cost channel
A third account, which the paper has not tested and cannot test with its data, is that the premium measures the cost of delivering metal into a COMEX depository: freight, insurance, refining or recasting into COMEX-deliverable bars where London good-delivery bars of 400 ounces must be converted to one-kilogram or 100-ounce bars, assay, vaulting, and the time the metal is in transit. In normal conditions these costs are small relative to the price and the premium is close to zero, as the baseline mean of 0.02 percent shows. If end-user demand for New York metal rose faster than the capacity of refiners, carriers and vaults to deliver it, the marginal cost of delivery would have risen, and the premium would have widened until enough metal arrived to meet the demand, which is what the inventory build shows. Under this account the premium is a congestion price in the physical supply chain rather than a price for dealer balance sheet or for tariff risk, and it would compress when demand fell away, as it did after both exemption orders, under any of the three accounts. The futures-minus-London spread measured here includes whatever these costs were, because any dealer who delivers London metal against a COMEX short bears them, and the financing adjustment of Section 4.1 removes only the interest cost. Freight and insurance quotations, refinery capacity and conversion fees are commercial information that is not public, and no sourced figures for them in 2025 were available to this study; the account is stated as an alternative that the data do not measure, and the press reports of refinery congestion in Switzerland in early 2025 that would bear on it are not cited because their figures could not be verified.
6.4 Why the difference matters
The difference between the two descriptions matters for three reasons. First, for policy: if the location premium is a price for dealer capacity, then the regulations that determine dealer capacity, including the leverage ratios that Hanson, Malkhozov and Venter (2024) identify as supply shifters in the swap market, determine how much a given demand shock moves the premium. A tariff that is never imposed can still move the gold market if dealers are capital-constrained; a tariff that is imposed will move it less if they are not. Second, for market participants: a dealer-capacity premium is predictable in part from dealer positioning and the gold price, which are public, whereas a tariff-risk premium is predictable only from political news. Third, for the intermediary asset pricing literature: precious metals offer a near-arbitrage in which the two legs are the same physical object, which removes the credit, collateral and legal-form differences that complicate the swap-spread and CIP cases. Whether balance-sheet capacity prices the gold location spread is a question this paper’s data can pose but not settle.
6.5 What public data cannot show
Three things that the popular account asserted, and that I have not tested, cannot be tested with public data. Who owned the metal that entered COMEX warehouses is not public; CME Group reports stocks by depository, not by owner. How the metal traveled is not public; trade statistics report monthly imports by country of origin with a lag and do not distinguish COMEX deliveries from other bullion flows. Why it moved is not public. Those questions can be addressed only through dealer surveys and journalism, which is what the popular account relied on. The contribution of this paper is to show that the parts of the account that can be tested with public data do not all survive the test, and to state the limits of that test.
7. Limitations
The EFP spread that dealers quote is the object of interest, and it is not published. The futures-minus-London spread is its public counterpart. It includes basis noise and the eight-hour timing gap between the London fix and the New York settlement. The futures leg is now built from explicit contract months under a documented roll rule, which removes the undocumented roll of the first version, and Appendix B shows that the results do not depend on which of three roll rules is used. The timing gap inflates the standard deviation of the premium and loads the same-day futures return onto it; the robustness check on dealer spot quotations in Section 5.8 reduces the gap and reaches the same conclusions, but a premium computed from a London PM price would be preferable and was not available at the daily frequency used.
The financing adjustment uses a Treasury rate rather than a gold lease or repo rate and ignores storage, insurance and delivery costs. It finances to the delivery month of the contract actually held, and Section 5.9 shows that replacing the three-month bill with a rate matched to the time to delivery changes no result, because the bill curve was close to flat over the sample. The adjustment is small relative to the premium swings studied, but it is an approximation, and the premium it leaves includes the physical delivery costs discussed in Section 6.3.
Ten signed events give very little power. The non-event standard deviation of the two-day gold premium change is 1.11 percent; with ten events the standard error of the mean signed change is 0.35 percent, so an effect would have to be of order 0.7 percent to be detected at conventional levels. The 2025 episode involved premium swings of one to two percent on the explicit-contract series, so a tariff effect of the size the popular account implies should have been detectable at the two-day horizon. Smaller effects, or effects spread over more than ten days, would not be detected, and the regressions cannot rule out an effect of up to half a percent of spot.
Two of the events are press-dated, and the market may have anticipated several of the others. Event dates from the Federal Register are signing dates, which can lag the first press report by a day or more. The E03 and E04 documents share a window and are merged. All of these push the two-day estimates toward zero. The event dates have not been checked against a calendar of other scheduled news, such as Federal Open Market Committee decisions or United States employment and inflation releases, because no such calendar is held in the data for this study; a confounding release on an event day would add noise to the two-day change and could in principle produce a counter-hypothetical move, and the exclusion exercise of Table 3c is the only check offered. The grouping of events into bullion-specific and general is a judgment about document content; the regression with separate dummies in Section 5.2 depends on it.
Warehouse data are partial. The 2025 inventory build is observed at ten gold dates and twelve silver dates rather than daily, and no date falls in the August and September 2025 case-study window. The inventory regression is run in a quiet 2026 window, has very low power, is not significant for gold at the five percent level, and says nothing about the response in 2025. A complete daily history exists commercially and has not been acquired.
No London platinum benchmark price series was available to this study, so a platinum premium, which would be the appropriate placebo for a location-spread hypothesis, could not be constructed; a platinum premium would test whether the New York-over-London spread in a metal that was not a bullion-tariff target moved on the same days as the gold and silver spreads. The futures return is a weak substitute because it tests whether the price of platinum moved, not whether its location spread did, and the tariff hypothesis is a hypothesis about location spreads. A finding that platinum returns move with gold returns on event days is consistent with common risk-off trading and says little about location. The placebo in Table 6 is therefore an inappropriate test of the hypothesis as stated, and the absence of a platinum premium is a limitation of the paper rather than evidence on either side. Copper is an imperfect placebo for tariff news in general because it was itself the subject of a Section 232 investigation in 2025; it is a usable placebo only for bullion-specific tariff news.
The CFTC swap-dealer category is a proxy for bullion-bank inventory. In gold it behaves as that proxy should, with a correlation whose joint-regression slope is not significant at the five percent level; in silver it has the opposite sign, the producer and merchant category carries the predicted sign instead, and the dealer-capacity model as framed does not fit the silver data; no institutional source supports an assumption that a different category holds the location book in silver, so the model is taken to fail for that metal.
The paper covers a single episode in a single pair of markets. The dealer-capacity hypothesis predicts that the same pattern should appear in other two-location commodity markets under stress, and that is a test for future work rather than something this paper has done.
8. Conclusion
The 2024 to 2025 gold and silver dislocation was real and large. The premium for New York metal over London metal, computed from explicit contract months and financed to delivery, reached 1.7 percent of spot in April 2025 and 2.3 percent in September 2025 against a baseline mean of 0.02 percent, and more than ten million ounces of gold moved into COMEX registered warehouses in nine weeks. The popular explanation attributes this to tariff fears and describes a rush to move metal across the Atlantic before a duty could be imposed. The part of that explanation that rests on general trade-policy news has no detectable support in public data at the two-day or ten-day horizon. The mean signed two-day change in the gold premium over ten events is minus 0.16 percent (standard error 0.35); 5 of ten events moved the gold premium in the direction the explanation requires; the seven general events have means of minus 0.50 (0.42) for gold and minus 0.32 (0.78) for silver; the event coefficient is minus 0.08 percent (standard error 0.27) without the futures return control and 0.11 (0.22) with it; and the same conclusions hold on a less noisy spot series, under three roll rules and under a maturity-matched financing rate. The three event windows in which the gold premium moved by more than two standard deviations are more than chance would produce, but two of the three moved against the hypothesis. The three bullion-specific events have means of 0.64 percent for gold (standard error 0.64) and 1.53 for silver (1.19), in the hypothesized direction and not distinguishable from zero. The finding that general tariff news had no detectable effect, subject to the low power of ten signed events, is the paper’s primary contribution; the limited bullion-specific evidence is more consistent with the tariff hypothesis and rests on one episode.
The low power of the test means that a tariff-news effect of up to half a percent of spot cannot be ruled out, and the failure to detect one is not evidence for an alternative. The paper offers the intermediary-capacity account of Hanson, Malkhozov and Venter (2024) and Greenwood, Hanson, Stein and Sunderam (2023), applied to the location spread, as a tentative alternative. The patterns that would accompany it are present in the gold data: the premium is negatively correlated with swap-dealer net positions in levels (minus 0.32) and in weekly changes (minus 0.47), and it moves with the gold price on the same day. The first relation is not estimated precisely enough to reject zero at the five percent level in the joint regression, the second is confounded with the timing of the two price fixes, and the inventory regression that would complete the account is uninformative. In silver the swap-dealer relation has the opposite sign, and the predicted sign appears instead in the producer and merchant category, which the account as framed does not predict and which no institutional source links to location books; the account fails for silver. The evidence is consistent with the dealer-capacity account for gold, contradicts it for silver, and establishes it for neither. A physical delivery cost account, in which the premium is a congestion price in the refining, freight and vaulting chain, is a third possibility that the data cannot measure. The two exemption orders of April and September 2025 were followed by compression of the premium at the ten-day horizon, which is the most parsimonious prediction of the tariff model and the one the data do not contradict; the September sequence, in which a bullion-specific customs ruling preceded the sample’s largest premium and a bullion-specific exemption preceded its collapse, is the one episode in the sample in which bullion-specific tariff news and the premium line up, and the daily record of Section 5.5 shows that the premium fell rather than rose on the first trading day after the ruling and peaked during a rally in the gold price three weeks later. It is consistent with all three accounts.
Public data cannot show who owned the metal, how it traveled, or why; they cannot distinguish a warrant transfer from a shipment; and they do not include the EFP spread that dealers quote. What they can show is that the premium did not respond to tariff announcements in general in the way a tariff-risk premium would have, that the three bullion-specific events moved it in the predicted direction by amounts that three windows cannot distinguish from zero, that the futures-return placebo cannot stand in for the platinum premium the design needs, and that the level of the premium outside the episode, once the futures leg is constructed by contract month, was close to zero.
Appendix A. Event definitions
The twelve documents, with the source of each date, are as follows. E01, 25 November 2024: social-media post announcing 25 percent tariffs on all goods from Canada and Mexico and an additional 10 percent on goods from China; press-dated, no Federal Register document. E02, 20 January 2025: Presidential memorandum “America First Trade Policy”; Federal Register; first trading day with a COMEX settlement 21 January. E03, 1 February 2025: Executive Orders 14193, 14194 and 14195 imposing tariffs on Canada, Mexico and China; Federal Register; first trading day 3 February. E04, 3 February 2025: Executive Orders 14197 and 14198 pausing the Canada and Mexico tariffs for 30 days; Federal Register; merged with E03 as one window of ambiguous sign. E05, 10 February 2025: Proclamations 10895 and 10896 on steel and aluminum; Federal Register. E06, 13 February 2025: Presidential memorandum “Reciprocal Trade and Tariffs”; Federal Register. E07, 3 March 2025: Executive Orders 14226, 14227 and 14228 allowing the Canada and Mexico tariffs to take effect and raising the China tariff to 20 percent; Federal Register. E08, 2 April 2025: Executive Order 14257 imposing reciprocal tariffs, with Annex II exempting bullion; Federal Register. E09, 9 April 2025: Executive Order 14266 pausing the country-specific reciprocal tariffs for 90 days; Federal Register. E10, 31 July 2025: Executive Order 14326 further modifying reciprocal tariff rates, with Switzerland at 39 percent; Federal Register. E11, 8 August 2025: press reports of a Customs and Border Protection ruling letter that one-kilogram and 100-ounce gold bars are subject to the reciprocal tariff; press-dated; first trading day 11 August. E12, 5 September 2025: Executive Order exempting gold bullion and certain other goods from the reciprocal tariffs; Federal Register; first trading day 8 September.
Appendix B. Roll rule and roll sensitivity
The futures leg uses CME Group daily settlement prices and open interest by contract month. Three roll rules are defined. Rule A, the primary rule, holds the nearest active-month contract and rolls to the next active month on the first day on which the prior-day open interest of the next contract exceeds that of the contract held; if no crossover has occurred by the first notice day, taken as the last business day of the month before the delivery month, the series rolls on that day. Rule B rolls five business days before the first notice day. Rule C rolls ten business days before the first notice day. In every rule the series never holds a contract into its delivery month. From January 2023 the gold series rolls 23 times and the silver series 19 times under rule A, and every gold roll is triggered by the open-interest crossover. Table B1 reports the main statistics under each rule, with the premium computed on the LBMA price.
| Statistic | Gold A | Gold B | Gold C | Silver A | Silver B | Silver C |
|---|---|---|---|---|---|---|
| Baseline mean, pct | 0.021 | 0.002 | 0.014 | 0.099 | 0.091 | 0.098 |
| Baseline SD, pct | 0.697 | 0.696 | 0.695 | 1.382 | 1.382 | 1.382 |
| Episode peak, pct (date) | 1.709 (2025-04-28) | 1.709 (2025-04-28) | 1.709 (2025-04-28) | 4.612 (2025-01-15) | 4.612 (2025-01-15) | 4.612 (2025-01-15) |
| Mean signed two-day change, 10 events (t) | minus 0.156 (minus 0.44) | minus 0.154 (minus 0.44) | minus 0.143 (minus 0.41) | 0.233 (0.36) | 0.262 (0.40) | 0.233 (0.36) |
| Event dummy, no return control (SE) | minus 0.085 (0.269) | minus 0.084 (0.265) | minus 0.078 (0.264) | 0.136 (0.262) | 0.151 (0.260) | 0.137 (0.262) |
The baseline mean, the episode peak, the event-study mean and the regression coefficient are unchanged to the second decimal place across the three rules. The roll rule therefore does not account for any result in the paper, and the difference between this version and the first version arises from the use of explicit contract months rather than from the particular rule chosen.
References
- [1]Acharya, V. V., Lochstoer, L. A., & Ramadorai, T. (2013). Limits to arbitrage and hedging: Evidence from commodity markets. Journal of Financial Economics, 109(2), 441-465.
- [2]Amiti, M., Redding, S. J., & Weinstein, D. E. (2019). The impact of the 2018 tariffs on prices and welfare. Journal of Economic Perspectives, 33(4), 187-210.
- [3]Angrist, J. D., & Pischke, J.-S. (2009). Mostly harmless econometrics: An empiricist’s companion. Princeton University Press.
- [4]Baker, S. R., Bloom, N., & Davis, S. J. (2016). Measuring economic policy uncertainty. Quarterly Journal of Economics, 131(4), 1593-1636.
- [5]Baur, D. G., & Lucey, B. M. (2010). Is gold a hedge or a safe haven? An analysis of stocks, bonds and gold. Financial Review, 45(2), 217-229.
- [6]Caldara, D., Iacoviello, M., Molligo, P., Prestipino, A., & Raffo, A. (2020). The economic effects of trade policy uncertainty. Journal of Monetary Economics, 109, 38-59.
- [7]Du, W., Tepper, A., & Verdelhan, A. (2018). Deviations from covered interest rate parity. Journal of Finance, 73(3), 915-957.
- [8]Erb, C. B., & Harvey, C. R. (2013). The golden dilemma. Financial Analysts Journal, 69(4), 10-42.
- [9]Fajgelbaum, P. D., Goldberg, P. K., Kennedy, P. J., & Khandelwal, A. K. (2020). The return to protectionism. Quarterly Journal of Economics, 135(1), 1-55.
- [10]Fama, E. F., & French, K. R. (1987). Commodity futures prices: Some evidence on forecast power, premiums, and the theory of storage. Journal of Business, 60(1), 55-73.
- [11]Greenwood, R., Hanson, S. G., Stein, J. C., & Sunderam, A. (2023). A quantity-driven theory of term premia and exchange rates. Quarterly Journal of Economics, 138(4), 2327-2389. https://doi.org/10.1093/qje/qjad024
- [12]Gromb, D., & Vayanos, D. (2002). Equilibrium and welfare in markets with financially constrained arbitrageurs. Journal of Financial Economics, 66(2-3), 361-407.
- [13]Hanson, S. G., Malkhozov, A., & Venter, G. (2024). Demand-and-supply imbalance risk and long-term swap spreads. Journal of Financial Economics, 154, Article 103814. https://doi.org/10.1016/j.jfineco.2024.103814
- [14]He, Z., & Krishnamurthy, A. (2013). Intermediary asset pricing. American Economic Review, 103(2), 732-770.
- [15]Kang, W., Rouwenhorst, K. G., & Tang, K. (2020). A tale of two premiums: The role of hedgers and speculators in commodity futures markets. Journal of Finance, 75(1), 377-417.
- [16]MacKinlay, A. C. (1997). Event studies in economics and finance. Journal of Economic Literature, 35(1), 13-39.
- [17]Newey, W. K., & West, K. D. (1987). A simple, positive semi-definite, heteroskedasticity and autocorrelation consistent covariance matrix. Econometrica, 55(3), 703-708.
- [18]Pastor, L., & Veronesi, P. (2012). Uncertainty about government policy and stock prices. Journal of Finance, 67(4), 1219-1264.
- [19]Shleifer, A., & Vishny, R. W. (1997). The limits of arbitrage. Journal of Finance, 52(1), 35-55.
- [20]Working, H. (1949). The theory of price of storage. American Economic Review, 39(6), 1254-1262.
Data sources
COMEX gold and silver daily settlements and open interest by contract month, and NYMEX platinum and COMEX copper front-month settlements: CME Group. LBMA Gold Price (AM) and LBMA Silver Price: LBMA, as benchmark administrator, through a licensed redistributor. Three-month and four-week Treasury bill rates (DTB3, DTB4WK), SOFR, and one-month, three-month and six-month constant-maturity Treasury yields (DGS1MO, DGS3MO, DGS6MO): Federal Reserve Board and Federal Reserve Bank of New York, via the Federal Reserve Bank of St. Louis FRED database. Executive orders and proclamations: Office of the Federal Register. Commitments of Traders (disaggregated futures only), 2023 to 2026: Commodity Futures Trading Commission. COMEX depository gold and silver stock reports: CME Group.
Replication
All computations were performed in Python. The replication package consists of the raw files as archived (futures by contract month, London, financing, CFTC and warehouse files), the event definition file with hypothesized signs, the single script that selects the contract held under each roll rule, aligns the series, computes the adjusted premium, constructs the event windows, estimates every regression and draws every figure, the data audit ledger with the status of every source, and the results file from which every number in this paper is read. The package will be deposited in a public persistent repository with a digital object identifier before the paper is posted, and the identifier will be given here; the same files will accompany the SSRN posting as supplementary material.
Correspondence: Felix Nikolas Prehn, The Prehn Institute, [email protected]. ORCID 0009-0003-0238-8790.