
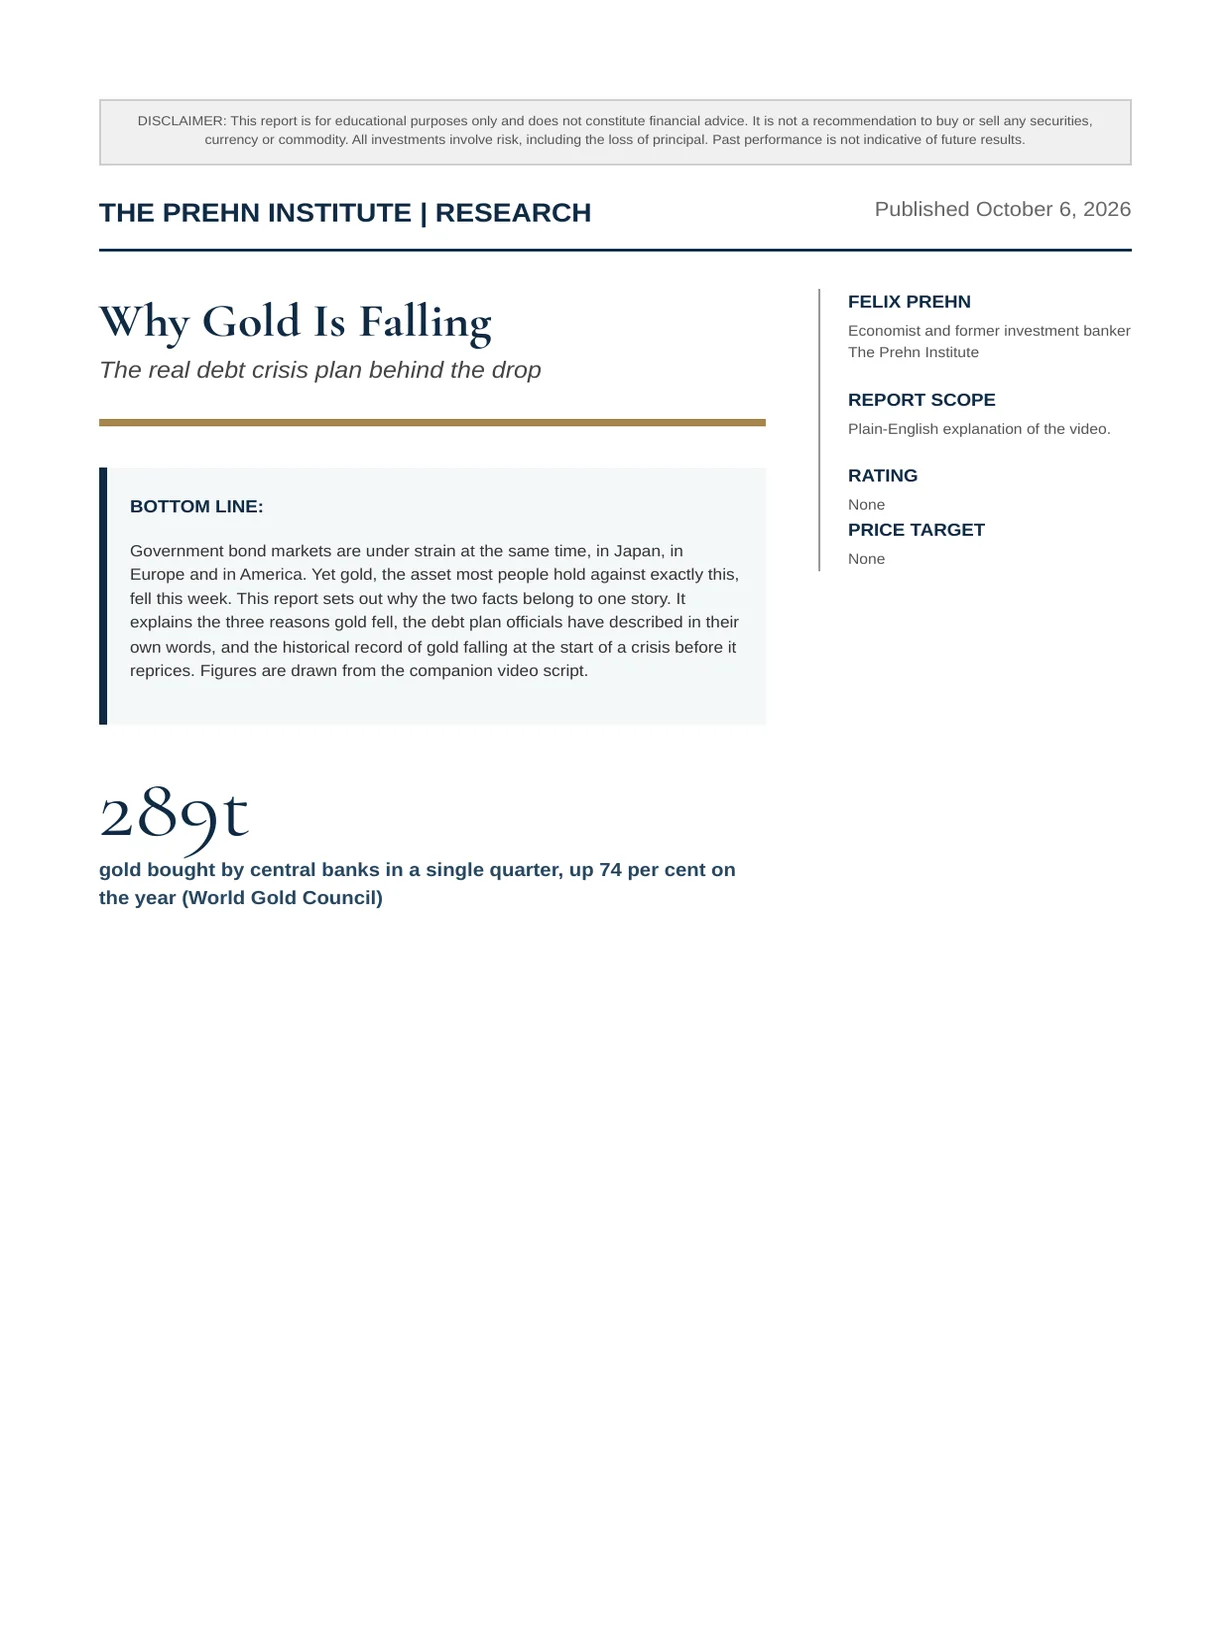
Why Gold Is Falling
The real debt crisis plan behind the drop
Felix Nikolas Prehn · 6 October 2026 · 15 pages
Bottom line
Government bond markets are under strain at the same time, in Japan, in Europe and in America. Yet gold, the asset most people hold against exactly this, fell this week. This report sets out why the two facts belong to one story. It explains the three reasons gold fell, the debt plan officials have described in their own words, and the historical record of gold falling at the start of a crisis before it reprices. Figures are drawn from the companion video script.
289tgold bought by central banks in a single quarter, up 74 per cent on the year (World Gold Council)
Summary of Findings
Five findings
- One story, not three. Japan's 30-year government bond yield is at an all-time high, France's bond selloff is spreading to Italy, Belgium and Greece, and US Treasury yields are at the highest since 2004. These are not separate events. They are one debt story, against about 40 trillion dollars of American debt.
- The interest bill is the pressure. Interest on the US federal debt has passed 1.25 trillion dollars a year, closing in on Social Security as the single largest line in the budget. That is the deadline that forces a choice.
- Gold fell for three reasons, none of them a verdict on gold. A stronger dollar, a crowded trade after a rise of more than 60 per cent in a year, and an engineered flush in the paper market, while physical demand and Shanghai premiums stayed high.
- The plan is to inflate it away. Officials have described growth and inflation, not cuts or taxes, as the route out. The mechanism economists call financial repression quietly transferred 2 to 3 per cent of the economy a year from savers to the government after the Second World War.
- Gold falling first is the pattern. It fell through 1973 and 1974 before the run to 850 dollars, and about 30 per cent in the 2008 panic before it tripled. Central banks have been buying physical gold at a record pace for three years.
The evidence has limits.
This report describes what has been said publicly and what the data show. It does not forecast the gold price, interest rates or the exchange rate. Policy intent is inferred from public statements and from the behaviour of the bond market.
Copyright The Prehn Institute
Section 1
Three markets, one fault line
Market What is happening Why it matters
Japan 30-year government bond yield at an all-time high; debt around 260 per cent of annual output The most indebted large economy is losing control of its own borrowing costs even as its central bank fights to hold them down
Europe France's bond selloff spreading to Italy, Belgium and
Greece; German yields rising too The safe haven of the last crisis is itself under strain this time
America Treasury yields at the highest since 2004; mortgage applications reported at the lowest since 1995 The strain reaches households directly, through the cost of a home and of holding one
THE COMMON CAUSE
Not strength, debt. The official story is that yields are rising because economies are strong. That cannot explain yields rising at the same time in Japan, France and Italy, where economies are weakening, not strengthening. A strong economy does not explain a global move. Too much debt, everywhere at once, does.
WHY 40 TRILLION IS THE ANCHOR
One number holds it together. The debt that frames all of this is the roughly 40 trillion dollars the American government owes. The plan to deal with it, set out later in this report, is the reason the strain in the bond market reaches savings held in cash, in houses and in gold alike.
Copyright The Prehn Institute
Section 2
Interest above 1.25 trillion dollars a year
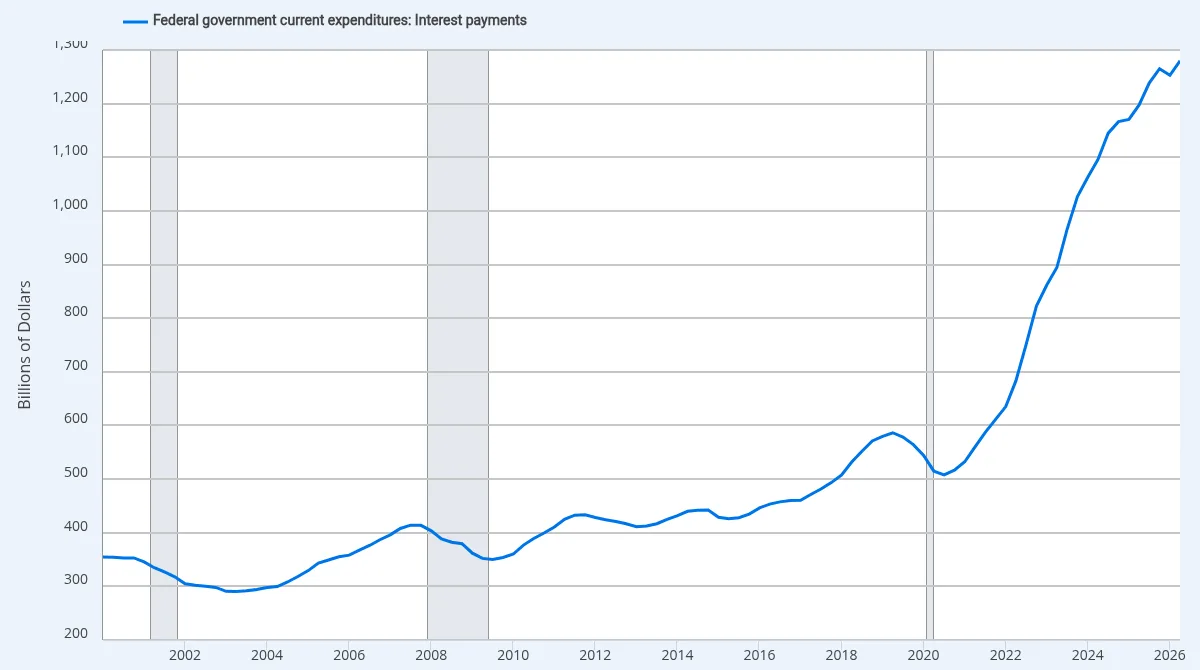
Federal government interest payments, billions of dollars at an annual rate, 2000 to 2026. The figure has passed 1.25 trillion dollars a year.
CLOSING IN ON THE BIGGEST LINE
Interest is now a top-line cost. The interest the American government pays on its debt has passed 1.25 trillion dollars a year, and is closing in on Social Security as the single largest line in the entire federal budget. In household terms, that is the interest on a credit card growing until it is about to become the biggest bill of the month, bigger than the mortgage, bigger than the food.
THE DEADLINE THIS CREATES
Waiting makes it worse. As cheaper debt matures it is refinanced at today's higher yields, so the interest bill rises on its own if nothing changes. That is the pressure behind the plan. A government with a bill like this, and no appetite to cut spending or raise taxes at the needed scale, is left with the value of the unit the debt is written in.
Copyright The Prehn Institute
Section 3
Why gold fell this week
A stronger dollar. Gold is priced in dollars; higher-for-longer rates lift the dollar and push the price down. Mechanical, not a verdict on gold.
A crowded trade. Gold up more than 60 per cent in a year, silver around 135 per cent. One shove and the leveraged players are flushed out at once.
An engineered flush in the paper market, the same pattern seen in silver.
Margin requirements raised
→
Forced selling triggers automatic stop-losses
→
Paper price cascades lower on the screen
PAPER PRICE, NOT GOLD
Two markets pulling apart. While the screen price fell, physical demand stayed strong, and premiums to get real metal in hand, especially in Shanghai, stayed high the entire time. The price flashing red is the paper price. It is not the price of gold. That distinction is the whole game.
NOT THE REASON YOU FEAR
None of the three is gold failing. A currency move, a crowded position and a mechanical flush are all features of how the market trades, not signals that gold has stopped doing its job. The next two sections explain why the drop changes nothing about the direction.
Copyright The Prehn Institute
Section 4
They said it out loud
Date Speaker Statement
2016 The man who now sits in the White House You never have to default, because you print the money
Recently Scott Bessent, Treasury Secretary There is "nothing magic" about the debt; the plan is to "grow our way out"
Reading the pattern.
Neither statement proposes the spending cuts or tax rises that would reduce the debt directly. That leaves growth and the value of the dollar the debt is written in. In plain English, the polished phrase for the second route is financial repression.
Hold interest rates below inflation
→
The gap drains savers quietly, every year
→
The debt shrinks against everything around it
THE MONEY IS ALREADY MOVING
Not coming, here. The broad money supply is growing at the fastest pace in four years, and every major central bank is quietly loosening. The bond market has told you, this week, that it does not believe the calm official story.
Copyright The Prehn Institute
Section 5
The arithmetic of repression
2-3%
of the whole economy transferred from savers to the government each year after the Second World War (Bank for
International Settlements)
Half
of purchasing power lost in a decade at a devaluation of about 5 per cent a year
(Nick Giambruno)
75 → 21
ounces of gold an average income could buy in 1990, against about 21 today
HOW THE WAR DEBT WAS PAID
A tax never called a tax. The Bank for International Settlements studied the years after the Second World War, when governments last carried debt of this size. It found that holding interest rates below inflation quietly transferred 2 to 3 per cent of the entire economy, every year, from savers to the government. That is how America paid down its war debt, not by cutting spending.
THE DOLLAR IS PART OF IT
A weaker dollar by design. Simon White, a macro strategist at Bloomberg, has pointed out that America now quietly wants a weaker dollar, because it makes exports cheaper and the debt easier to shrink. The risk is the tightrope: push it too far and the world loses confidence and moves its money out.
WHAT IT REACHES
A third of the gold. In 1990 an average income could buy around 75 ounces of gold. Today that same income buys around
- Same work, a third of the gold, around 70 per cent poorer in real money.
Copyright The Prehn Institute
Section 6
341 hours, against 100 in 2000
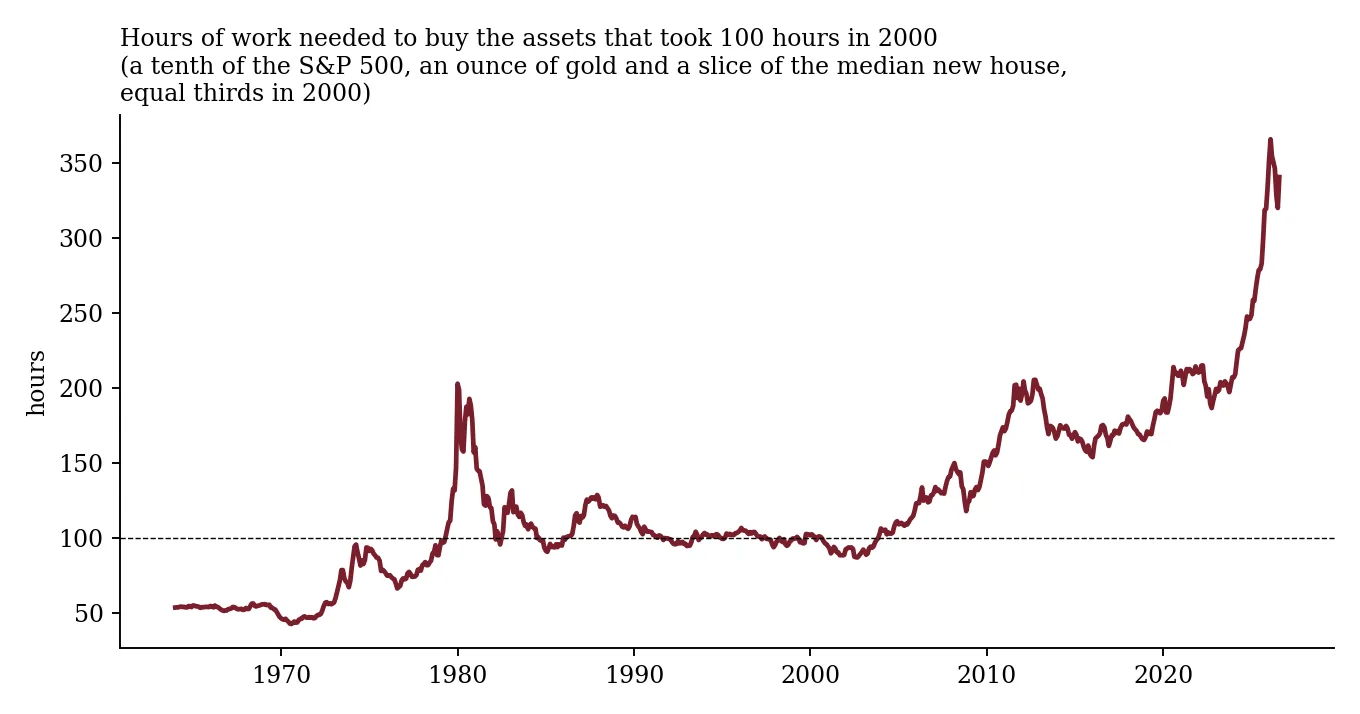
The Prehn Hours of Work Index: hours of work to buy the same basket of assets, 1964 to 2026. The year 2000 equals 100. Source: The Prehn Institute, August 2026 release. index, August 2026 (2000 = 100), up more than 20 per cent on the year hours of work to buy an ounce of gold
- 6.3
- years of full-time pay, before tax, for the median new house
MEASURE IN TIME, NOT MONEY
An hour cannot be re-weighted. The official inflation figure is adjusted, re-weighted and massaged. A dollar changes in value; an hour of work does not. So the index asks how many hours a worker must put in to buy what people actually save for. By August 2026 that basket cost 341 hours, against 100 in 2000.
WHERE IT BITES
More than tripled in a generation. A tenth of the S&P 500 now costs about 23.7 hours of work, an ounce of gold 137 hours, and the median new house 6.3 years of full-time pay before tax. The things people work and save for have more than tripled in cost, measured in their own time.
Copyright The Prehn Institute
Section 7
Why gold falls before it rips
Episode What gold did first What came next
The 1970s
From around 100 dollars, went flat and then fell through 1973 and 1974 while the stock market collapsed Ran to about 850 dollars by 1980, one of the great runs in financial history
2008 Fell around 30 per cent in the panic as funds sold what they could for cash Tripled over the next three years once the printing started
WHY IT KEEPS HAPPENING
Liquid, so sold first. When markets break, funds need cash now, to meet margin calls and cover losses. They sell what they can, not what they want to, and gold is one of the most liquid things anyone owns. So it is dumped first, for cash, precisely because it is good money. Then the printing starts and gold reprices against a currency that is suddenly worth less.
WHO ALREADY UNDERSTANDS THIS
The central banks. The same institutions running the inflation plan have been buying physical gold at a record pace for three years. They are quietly swapping paper money for metal while telling everyone else that all is well.
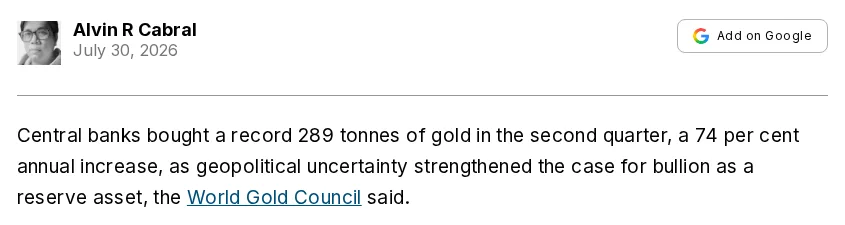
Central banks bought a record 289 tonnes of gold in the second quarter, a 74 per cent increase on the year. Source: World Gold Council.
Copyright The Prehn Institute
Conclusion
The ratio resets
CONCLUSION:
The strain across Japan, Europe and America is one debt story. Officials have described a route out through growth and inflation rather than cuts or taxes. Gold fell this week for reasons that are mechanical, not a verdict on gold, and the historical record shows gold falling at the start of a crisis before it reprices. Read together, a stock market and gold both at 50,000 is not a prediction of riches, it is the ratio between paper assets and real money resetting, the way it has at the end of every great debt cycle.
Question What the evidence shows
Is the bond strain one story or three? One. Yields are rising together where economies are weakening, which points to debt, not strength
Did gold fail this week? No. A stronger dollar, a crowded trade and a paper flush, while physical demand stayed strong
What is the plan for the debt? Inflate it away through financial repression, described in officials' own words
What does history suggest follows? Gold falling first, then repricing once the printing accelerates, as in the 1970s and after 2008
What to do with it.
Do not panic-sell into the paper drop. Size positions so a 10 per cent move does not force a sale at the worst moment. Look at the whole portfolio through the debt lens, asking what depends on cheap borrowing to survive. And understand the opportunity, because every time a government prints its way out, a small group who understood the structure came out ahead.
Copyright The Prehn Institute
Disclaimer
The Prehn Institute provides education only. Nothing in this report is financial, investment or tax advice, and no return or income is promised or implied. Investment carries risk, including the loss of capital. Results vary with each individual's circumstances and with market conditions. Past performance is not a guide to future results.