
The Unthinkable Trade
How the AI boom quietly became the trigger for gold, silver and the miners — and why the cheapest corner of the market sits on the other side of it
Felix Nikolas Prehn · 12 August 2026 · 25 pages
Bottom line
The video script argues that six events — reported as six unrelated headlines in a single week — describe one machine. The most expensive US stock market in recorded history is being financed with debt and circular deals, its long-standing support is breaking, and the system has no cushion left. When leverage like that unwinds, policymakers tend to reach for the printer — and that is historically when hard assets such as gold, silver and the miners do their work. warning lights that lit up in roughly one week, described in the script as one connected story
Overview
Contents
Bottom line: one machine, six warning lights
4–5
Warning light 1 — the most expensive market in history
6–7
Warning light 2 — gold miners: cheapest in 50 years
8–9
Warning light 3 — the cost of insuring Nvidia doubles
10–11
Warning light 4 — the $500B circular financing loop
12–13
Warning light 5 — the emergency tank runs low
14–15
Warning light 6 — the buyer that became a seller
16–17
The move: miners, quality and the UCITS how-to
18–20
Risk, sizing & the free live session
Sources & disclosures
How to use this report.
Read it beside the video. The sections follow the script's information and order. The goal is not to predict the next market move. It is to explain the plumbing that can make six apparently unrelated headlines move together — and where the script argues the asymmetric opportunity sits.
Bottom Line
One machine, six warning lights
BOTTOM LINE:
The script's central claim is that the thing sending gold and silver higher is not inflation, the Fed or war — it is the AI boom itself. The mania has drained attention and capital into the most expensive market ever recorded, financed with debt and circular deals. Gold, silver and the miners sit on the opposite side of that crowded trade, hated and cheap.
AI mania inflates the most expensive market ever
→
It is propped up by debt, circular deals and buybacks
→
Those props break; when leverage unwinds, they print
THE SETUP
The most expensive market in history. The script opens on a composite of eight valuation measures showing US equities above both the 2000 dot-com peak and 1929. A handful of AI names now dominate the index, so most investors are already on one side of this trade.
THE TRIGGER
AI is running on borrowed money. The cost of insuring Nvidia's debt has doubled, half a trillion dollars of financing runs in a circle, and the biggest tech buyers have flipped to selling their own shares.
THE MISSING CUSHION
No airbag left. The US strategic petroleum reserve is at its lowest since 1983. The script uses this as a symbol of a system with its shock absorbers already spent.
THE OTHER SIDE
Cheap, hated, and asymmetric. Gold miners are the cheapest in 50 years while remaining among the most profitable industries in the S&P 500. That is the corner the script argues most people are ignoring.
The Stakes
The most expensive US market in recorded
history
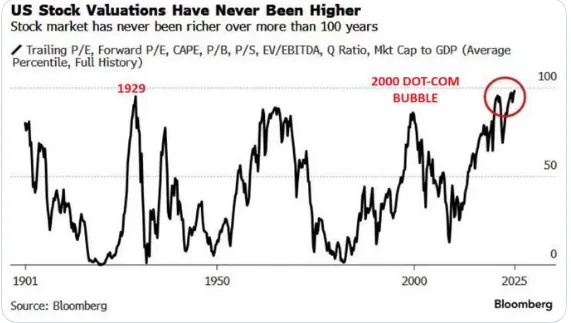
“US Stock Valuations Have Never Been Higher.” A Bloomberg composite of eight valuation measures. Source: @JTheretohelp1 on X, Aug 11, 2026.
NOT ONE METRIC — EIGHT
Price-to-earnings, price-to-book, price-to-sales, market-cap- to-GDP and more. When eight separate measures are combined, today's reading sits above the 2000 dot-com peak and above 1929.
WHY IT IS YOUR PROBLEM
If you own an index fund, you own this. A handful of AI names now dominate the index, so most investors are already all-in on the most expensive market that has ever existed.
THE FRAME FOR EVERYTHING ELSE
This sets the stakes. Gold, silver and the miners sit on the other side of that valuation — the side almost nobody is on.
Crowded on One Side
When everyone leans over one side of the boat
BOTTOM LINE:
The script's point is not that an expensive market must fall tomorrow. It is that extreme valuations reduce the margin for error and concentrate risk in the exact assets most people already own.
AI mania pulls in attention and capital
Valuations reach the highest ever recorded
The crowd is concentrated on one side of the trade
CONCENTRATION RISK
A few names are the index. When a small number of AI stocks drive most of the market's value, diversification can be more apparent than real.
THE HISTORICAL RHYME
Every prior peak felt justified at the time. The script notes that 2000 and 1929 also looked reasonable to most participants
- until they did not.
WHERE THE REPORT GOES NEXT
The other side of the boat. The next warning light looks at the cheapest, most-ignored corner of the same market.
→
→
The Opportunity Nobody Is Looking at
Gold miners: the cheapest in 50 years
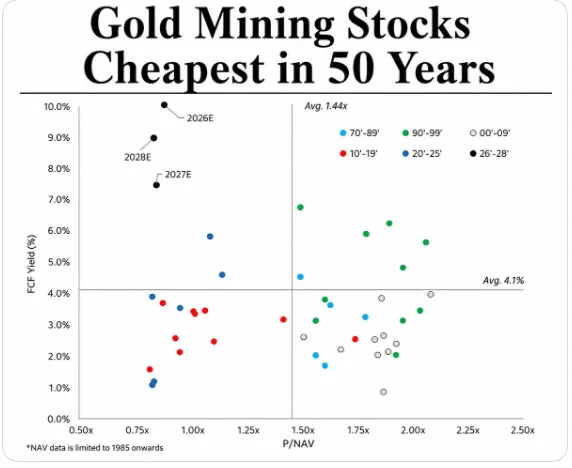
“Gold Mining Stocks Cheapest in 50 Years” — free-cash-flow yield vs price-to-NAV, with 50-year average reference lines. Source: @ekwufinance on X, Aug 10, 2026. Sector data: Winston app.
REAL NUMBERS, NOT A SLOGAN
~10% free-cash-flow yield. That is the cash left after the business pays for everything — the number that is hardest to fake. The group trades at roughly 0.8x the value of the gold it already owns in the ground: below one.
CHEAP AND PROFITABLE
Still one of the most profitable industries in the S&P 500. Even after gold's pullback, mining remains highly profitable. “Cheap” and “profitable” rarely appear together.
THE LAZY WAY IN
GDX holds the basket. The script mentions GDX as a single ticker that holds a broad group of miners — noted for reference, not as a recommendation. See page 21 for risk and sizing.
Why Something This Good Is This Cheap
Attention went somewhere else
BOTTOM LINE:
The script's answer to “why is it cheap?” is simple: every scrap of attention, money and greed was hoovered up by AI. A boring miner yielding 10% cannot compete for headlines with a chip stock promising to change the world.
Measure Gold miners today (per script) 50-year average (per chart)
Free-cash-flow yield ~10% ~4.1%
Price-to-NAV ~0.8x (below 1) ~1.44x
Relative profitability Among the most profitable industries in the S&P 500 —
The crowded-trade lesson.
When everybody leans over one side of the boat, the opposite side is where forgotten value tends to sit. The script frames the miners as the un-crowded side of a wildly crowded AI trade — not a guarantee, but an asymmetry.
The First Crack in the Trigger
The cost of insuring Nvidia has doubled
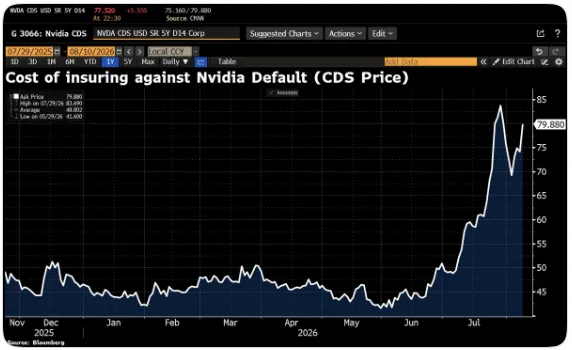
Cost of insuring against Nvidia default — 5-year CDS price. Roughly doubled since late May (about 41.6 to 77.5), just shy of the July 29 record near 83.7. Source: @Schuldensuehner on X, Aug 10, 2026.
A
CREDIT
DEFAULT
SWAP
IS
JUST
INSURANCE
It is what you pay to protect against a company not repaying its debt. Rock-solid company, cheap insurance. Shaky company, expensive insurance — fast.
THE ODD PART
The stock is at highs; the insurance has doubled. The bond desks — who insure debt for a living — are quietly paying twice as much to protect against Nvidia hitting trouble.
THE TELL
Listen to the ones buying fire insurance. The stock market tells the story Wall Street wants you to hear; the bond market tells you what it actually believes. The script's read: leverage in AI financing is rising.
Stocks vs Credit
Two markets, two different messages
Equity crowd celebrates all-time highs
Credit crowd quietly pays double for protection
The script says: trust the ones buying insurance
WHY CREDIT OFTEN LEADS
Bond investors care about being repaid, not about hype. Their incentive is to spot trouble early, because their upside is capped and their downside is default.
THE KEY NUMBERS
From ~41.6 in late May to ~77.5, near the July record of
~83.7. A doubling in the cost of protection is a meaningful move, not noise.
WHAT IT POINTS TO
Leverage. The next two warning lights show exactly how the borrowing works — and why the biggest support under the market just disappeared.
→
→
The Financial Engineering
The $500B circular financing loop
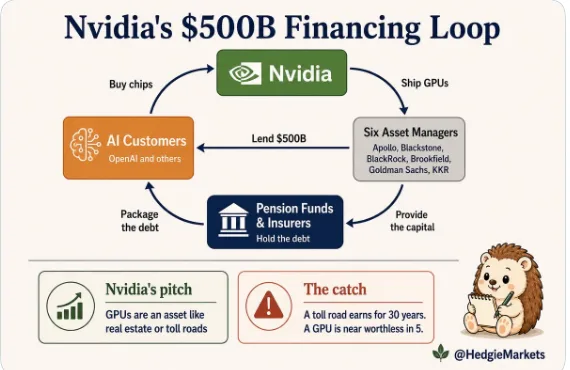
“Nvidia's $500B Financing Loop.” Six asset managers lend $500B so Nvidia's customers can buy Nvidia chips; pension funds and insurers supply the capital and hold the debt. Source: @HedgieMarkets on X, Aug 11, 2026.
WALK THE CIRCLE
Nvidia ships GPUs. Customers need money to pay for them. Six giant asset managers — Apollo, Blackstone, BlackRock, Brookfield, Goldman Sachs and KKR — lend over $500B. The money comes from pension funds and insurers, who end up holding the debt.
WHO ENDS UP HOLDING IT
Your retirement, indirectly. Nvidia books the revenue, the customers get the chips, and the debt sits on pension and insurance balance sheets.
THE CATCH
A GPU is not a toll road. Nvidia's pitch calls a GPU a long- lived asset. But a toll road still earns in 30 years; a chip is close to worthless in five, because the next chip makes it a paperweight — by design.
We Have Seen This Film Before
Lucent, Nortel and vendor financing
BOTTOM LINE:
The script points to the late-1990s precedent: Lucent and Nortel lent their own customers the money to buy their own gear. Sales looked spectacular; both ended in the largest corporate bankruptcies of their day.
Vendor lends customers money to buy its own product
→
Sales look spectacular; risk piles up on the customer side
→
When it unwinds, whoever holds the paper takes the loss
WHY IT FLATTERS THE NUMBERS
Vendor financing can turn future risk into today's revenue. The seller records the sale now; the repayment risk sits elsewhere.
WHO IS PROTECTED
The arrangers take fees up front. Win, lose or draw, the six firms that structured the deal have already been paid.
THE MEASURED CLAIM
This is an analogy, not a prediction. The script is careful to observe a pattern, not to assert that Nvidia is Lucent or that any specific outcome will follow.
No Airbag Left
The emergency tank runs low
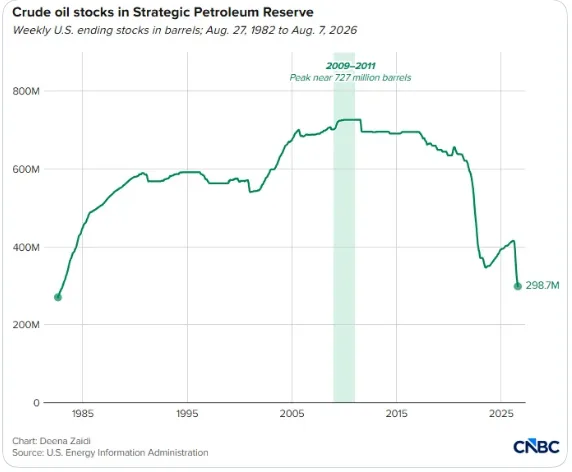
US Strategic Petroleum Reserve, weekly crude stocks, 1982–2026. From a peak near 727M barrels (2009–2011) to about 298.7M today — the lowest since 1983. Source: @Barchart on X (EIA data), Aug 10, 2026.
WHY AN OIL CHART IN A GOLD REPORT
It is a symbol of a system with no shock absorbers. The national emergency buffer has more than halved from its peak. Drain the reserves in good times and there is nothing to lean on when bad times arrive.
THE JOIN TO METALS
Accident → print. When a big financial accident hits, governments and central banks reach for the printer. 2008: print. 2020: print. It has become muscle memory.
THE ASYMMETRY
You cannot print silver. When dollars are conjured up to plug a hole, the value of each dollar falls — and hard assets that cannot be printed tend to rise. That is the thesis in one line.
The Debasement Chain
From a drained reserve to a rising metal price
A financial accident forces a policy response
Central banks and governments create money to plug the hole
Each dollar buys less
Assets that cannot be printed — gold, silver — tend to rise
NOT A TINFOIL-HAT THEORY
It is the pattern of the last twenty years. The script cites 2008 and 2020 as the template: accident, then print.
WHY THE CUSHION MATTERS
Less buffer, bigger response. With reserves already drained, any real stress lands on an economy running on fumes — which tends to make the policy response larger, not smaller.
THE MEASURED CLAIM
Direction, not timing. The script argues about what tends to happen to purchasing power, not about a precise date or price.
→
→
→
The Prop That Just Broke
The biggest buyer became a seller
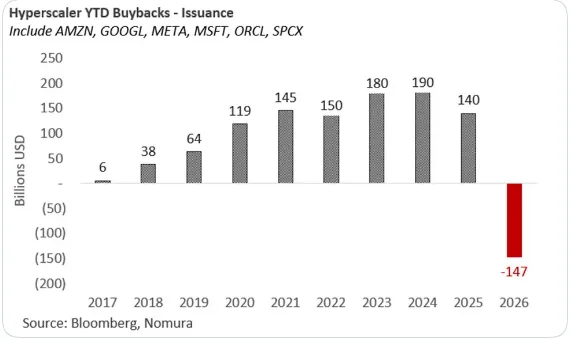
Hyperscaler net buybacks minus issuance (AMZN, GOOGL, META, MSFT, ORCL). From +$190B in 2024 to −$147B net issuance. Source: @zerohedge on X (Bloomberg, Nomura data), Aug 11, 2026.
TEN YEARS OF ONE RELIABLE BUYER
Big tech bought back its own shares. From ~$6B in 2017 to ~$190B by 2024 — a giant, price-insensitive buyer turning up every day and pushing prices higher.
THEN IT FLIPPED
To −$147B. For the first time in a decade the biggest buyer of stocks became a net seller — issuing new shares, diluting shareholders, to help fund the AI spending spree.
WHY IT MATTERS
The tide is going out. The single biggest source of buying that held the market up switched teams — specifically to pour cash into the AI build-out the rest of this report describes.
Six Lights, One Circuit
The machine in one breath
BOTTOM LINE:
The AI boom is financed with debt — the bond market already told us. That debt runs through a circular, Lucent-and-Nortel- shaped loop that ends on pension funds' books. The system has no cushion left. And the one buyer holding stocks up just became a seller. When it unwinds, the script's expectation is that they print — and hard assets win.
Warning light Key figure (per script & sources) Role in the machine
- Valuations Above 2000 and 1929 The stakes: everyone is in
- Miners ~10% FCF yield, ~0.8x P/NAV The other side of the trade
- Nvidia CDS Doubled to ~77.5 Credit is nervous
- $500B loop Six firms, $500B Debt-financed demand
- Petroleum reserve Lowest since 1983 No cushion
- Buybacks +$190B → −$147B The last buyer left
The picture.
A market standing on a chair with someone quietly sawing through the legs. The report's job is to explain the mechanism, not to time the fall.
What the Script Does About It
The miners as an asymmetric bet
BOTTOM LINE:
The script describes the miners as an asymmetric position: something the cheapest it has been in 50 years, throwing off ~10% free cash flow, priced below the value of the metal in its own ground, sitting on the opposite side of a crowded, debt-soaked AI trade.
WHAT “ASYMMETRIC” MEANS
Smaller downside if wrong, larger upside if right. The script frames the appeal as the shape of the bet, not a promise of a particular return.
THE BASKET OPTION
GDX. Mentioned as the lazy way to own a broad group of miners in a single ticker, so you do not have to pick individual companies. Noted for reference only.
THE DISCIPLINE
Sizing comes first. The script is explicit that this is not “bet the farm.” See page 21 for the risk rules.
No rating, no price target.
The Bonus for Stock Investors
IQLT: quality, outside the AI casino
BOTTOM LINE:
The script describes a large position bought in IQLT — the iShares MSCI International Quality Factor ETF. The idea: when a bubble bursts, the junk goes to zero and genuinely good businesses survive and take share.
WHAT “QUALITY” SCREENS FOR
High return on equity, stable earnings, low debt. IQLT applies those three boring, durable filters to developed-world companies outside the US.
WHAT IS INSIDE
Real companies that make real money. Roughly 300 holdings including names such as ASML, Roche, Nestlé, Novartis and AstraZeneca. The fee is around a third of one percent.
WHY NOW
Great businesses, sane prices, outside the American AI
casino. The script positions it as a way to stay invested in equities without being all-in on the most expensive part of the market.
IQLT at a glance Detail (per script)
Full name iShares MSCI International Quality Factor ETF
Holdings ~300 developed-market companies ex-US
Screen High ROE, stable earnings, low debt
Fee ~0.30%
A Skill, Not a Tip
UK & Europe: finding the UCITS version
BOTTOM LINE:
US-listed ETFs like IQLT generally cannot be sold to UK and EU retail investors, because they do not publish a specific European disclosure document. The script teaches a repeatable, ~90-second method to find the European-domiciled equivalent of any US fund.
Step What to do Why
Take the strategy, not the ticker. IQLT tracks a “World-ex-USA Quality” index — shop for that index name.
You are buying the strategy, not four letters.
Use a free fund screener (e.g. justETF) and search the index name (“MSCI World Quality”).
Finds every wrapper tracking it.
Look for the word UCITS in the fund's name. UCITS is the European wrapper you can actually buy.
Check the ISIN. “IE” = Ireland, “LU” = Luxembourg. Both are exactly what you want.
Pick the “Acc” (accumulating) version if you do not need the income. It reinvests dividends automatically.
Where it lands.
This method leads to the iShares MSCI World Quality Factor UCITS ETF — the European cousin of IQLT. The Irish-domiciled version is usually more tax-efficient for non-US investors: better treaty treatment on dividend withholding tax, and it helps avoid a US estate-tax trap that can affect holdings over $60,000.
Getting the Idea Right and the Sizing Wrong
The most important rule is not a ticker — it is
size
BOTTOM LINE:
Metals and miners are volatile and can move double digits in a single day — both ways. The script's central risk rule: if you own so much of something that you are awake at 3am checking the price, you own too much.
Free live session: when to sell
whentosell.org
Size positions so that if you are wrong, it is a lesson — not a disaster.
✓
Remember that being early and being wrong feel identical until they suddenly do not.
✓
Bubbles run higher and longer than anyone thinks possible — plan your exit as carefully as your entry.
✓
Separate the idea (what to own) from the discipline (when to sell).
✓
Disclaimer
This report is for educational and informational purposes only and does not constitute financial, investment, legal, tax or accounting advice. It is not a recommendation, solicitation or offer to buy or sell any security, currency, commodity or financial product. No buy/sell rating or price target is provided. All investments involve risk, including the possible loss of principal. Market events, relationships and historical comparisons described here may not repeat. Tickers and funds are named for educational illustration only. Illustrations simplify complex systems and may omit factors. Readers should conduct their own research and consult appropriately qualified professionals before making financial decisions. Past performance is not indicative of future results. The Prehn Institute makes no guarantee regarding outcomes.