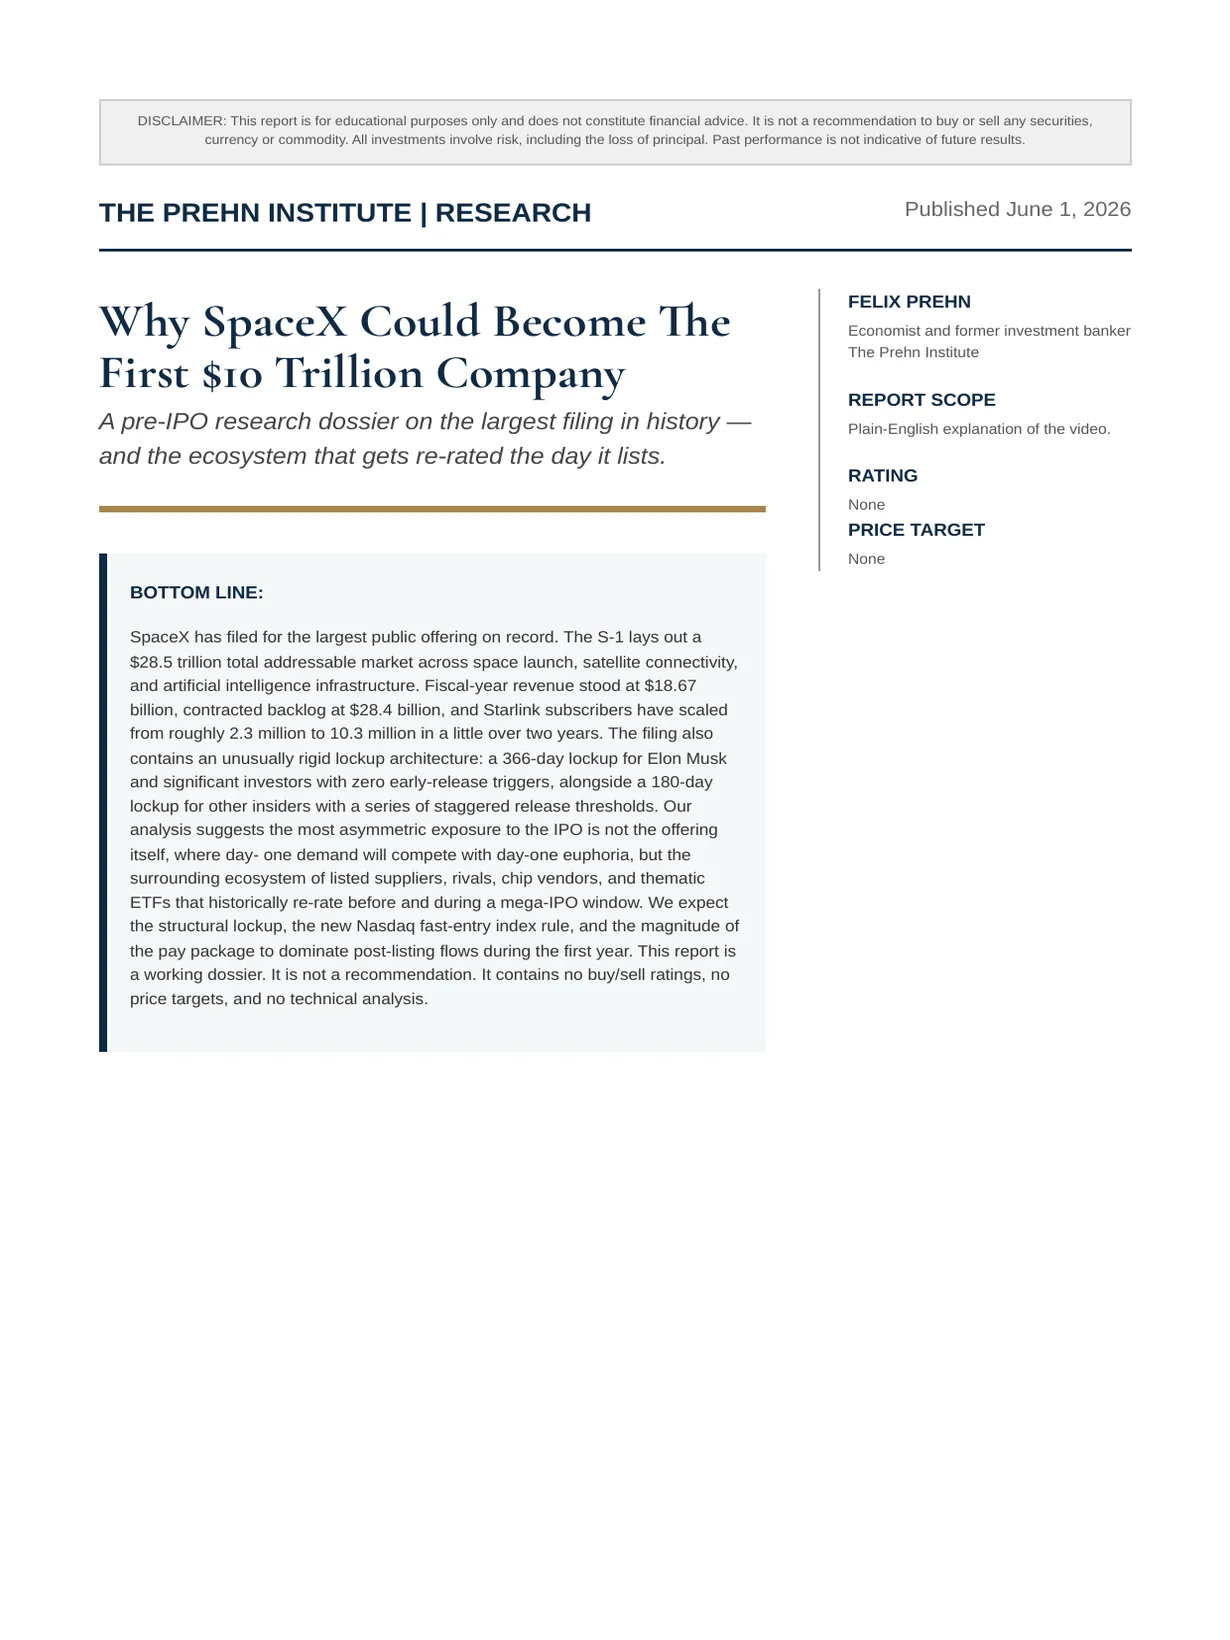
Why SpaceX Could Become The First $10 Trillion Company
A pre-IPO research dossier on the largest filing in history — and the ecosystem that gets re-rated the day it lists.
Felix Nikolas Prehn · 1 June 2026 · 16 pages
Bottom line
SpaceX has filed for the largest public offering on record. The S-1 lays out a $28.5 trillion total addressable market across space launch, satellite connectivity, and artificial intelligence infrastructure. Fiscal-year revenue stood at $18.67 billion, contracted backlog at $28.4 billion, and Starlink subscribers have scaled from roughly 2.3 million to 10.3 million in a little over two years. The filing also contains an unusually rigid lockup architecture: a 366-day lockup for Elon Musk and significant investors with zero early-release triggers, alongside a 180-day lockup for other insiders with a series of staggered release thresholds. Our analysis suggests the most asymmetric exposure to the IPO is not the offering itself, where day- one demand will compete with day-one euphoria, but the surrounding ecosystem of listed suppliers, rivals, chip vendors, and thematic ETFs that historically re-rate before and during a mega-IPO window. We expect the structural lockup, the new Nasdaq fast-entry index rule, and the magnitude of the pay package to dominate post-listing flows during the first year. This report is a working dossier. It is not a recommendation. It contains no buy/sell ratings, no price targets, and no technical analysis.
Overview
SpaceX: The Largest IPO Filing in
History — and Why the Ecosystem
Re-Rates First
A pre-listing dossier covering the $28.5 trillion addressable market, lockup
mechanics, the Musk pay package, and the listed companies positioned around
the trade.
BOTTOM LINE:
SpaceX has filed for the largest public offering on record. The S-1 lays out a $28.5 trillion total addressable market across space launch, satellite connectivity, and artificial intelligence infrastructure. Fiscal-year revenue stood at $18.67 billion, contracted backlog at $28.4 billion, and Starlink subscribers have scaled from roughly 2.3 million to 10.3 million in a little over two years. The filing also contains an unusually rigid lockup architecture: a 366-day lockup for Elon Musk and significant investors with zero early-release triggers, alongside a 180-day lockup for other insiders with a series of staggered release thresholds. Our analysis suggests the most asymmetric exposure to the IPO is not the offering itself, where day- one demand will compete with day-one euphoria, but the surrounding ecosystem of listed suppliers, rivals, chip vendors, and thematic ETFs that historically re-rate before and during a mega-IPO window. We expect the structural lockup, the new Nasdaq fast-entry index rule, and the magnitude of the pay package to dominate post-listing flows during the first year. This report is a working dossier. It is not a recommendation. It contains no buy/sell ratings, no price targets, and no technical analysis.
1. EXECUTIVE SUMMARY — THE
BOTTOM LINE
Scope. This dossier covers the public information in the SpaceX Form S-1 filed with the SEC (CIK 0001181412), cross-referenced with publicly available reporting from Reuters, Morningstar, The Motley Fool, PitchBook, and contemporary news coverage of Nasdaq listing-rule changes. It is a snapshot focused on the last three months of disclosures relevant to the offering.
What is new. The S-1 introduces several first-time public disclosures: the explicit articulation of a $28.5 trillion addressable market on page 11 of the filing; a written commitment to space-based data centers “capable of delivering 100 terawatts of compute per year”; an extended lockup of 366 days for Musk and significant investors with no early-release triggers; and two distinct CEO compensation awards whose vesting milestones extend up to $7.5 trillion market capitalization.
What this means for public investors. The most actionable analysis for U.S. retail investors today is not directly about SpaceX itself—public participation is constrained at listing—but about the publicly listed names that supply, compete with, or operate adjacent to SpaceX. These include semiconductor foundries and packagers, satellite component vendors, rocket and launch competitors, and broad space-themed exchange-traded funds.
IN PLAIN ENGLISH SpaceX is filing to sell shares to the public. The filing is huge and full of numbers. The interesting thing is not just the stock itself—it is everyone else around it. When a giant goes public, the suppliers, rivals, and ETFs that touch the same business usually move first.
2.
INDUSTRY
SNAPSHOT
—
THE
SPACE ECONOMY IN 2026
Three converging markets. SpaceX's filing positions the company at the intersection of three industries: space launch services, global broadband connectivity, and artificial-intelligence infrastructure. The first two are decades-old industries with measurable revenues. The third is, in the S-1's own framing, an attempt to redefine compute capacity by moving data centers off Earth.
Market sizing per the filing. The S-1 attributes a $370 billion opportunity to the space-launch market, a $1.6 trillion opportunity to global connectivity, and a $26.5 trillion opportunity to artificial intelligence infrastructure and applications — combining to the $28.5 trillion figure quoted on page 11. That total is intentionally described in the filing as “the largest actionable total addressable market in human history.”
Industry structure. The space economy in 2026 is bifurcated. A small number of vertically integrated operators—SpaceX being the largest—control rocket launch, satellite manufacture, and end-customer service. Around that core sit a fragmented ring of public suppliers, contractors, and emerging competitors. Many of these public companies have small market capitalizations relative to their growth pipelines, making them sensitive to news flow from SpaceX.
Sub-segment
S-1 TAM (per filing)
SpaceX position
Space launch $370B Dominant share of global commercial launches
Satellite connectivity
$1.6T Starlink: largest active
LEO constellation
AI infrastructure
$26.5T Roadmap to space- based data centers
Combined TAM
$28.5T S-1 page 11
3. SPACEX BUSINESS OVERVIEW
Three revenue engines. SpaceX runs three reporting lines: (a) Starlink, the satellite-internet service which dominates the revenue mix, (b) launch services, which sells rocket flights to commercial and government customers, and (c) an AI segment, comprising compute, data, and emerging products tied to the company's machine-learning roadmap.
Revenue concentration. Starlink contributed approximately 61% of fiscal-year revenue. Launch services contributed about 22%. The AI segment contributed roughly 17%. The mix has shifted decisively toward recurring connectivity revenue over the past three reporting periods.
Backlog. Contracted backlog stood at $28.4 billion at the time of the filing. Backlog gives forward visibility into rocket launches sold to commercial satellite operators, government agencies, and the Department of Defense.
4. FINANCIAL SNAPSHOT — WHAT
The S-1 Shows
Headline numbers. The S-1 reports fiscal-year revenue of $18.67 billion, more than doubled from the preceding two-year window driven primarily by Starlink subscriber growth. Backlog stood at $28.4 billion. The filing also discloses two distinct equity- compensation plans for the CEO with vesting milestones tied to multi-trillion-dollar market- capitalization thresholds.
Metric
Disclosed in S-1
What it tells us
FY revenue $18.67B Triple-digit two-year growth, Starlink-led
Starlink share of revenue
~61% Recurring connectivity is now the primary engine
Launch share of revenue
~22% Capacity utilization remains the long-run question
AI segment share of revenue
~17% Smallest, fastest expansion roadmap
Contracted backlog
$28.4B Forward visibility on launch services
Starlink subscribers (latest)
~10.3M Up from ~2.3M in
2023
- 4.1
GROSS
MARGIN
AND
CASH
CONVERSION — WHAT WE CAN INFER
We caution that as a pre-listing private company, SpaceX has not historically published the level of operating detail demanded of public issuers. Felix's investment framework emphasizes gross margin as a moat indicator, leveraged free cash flow margin as a cash-quality indicator, and leverage and interest
cover as stability indicators. Until the company files its first 10-Q as a public company, these inputs will remain incomplete. The S-1 provides directional disclosure rather than the multi-year quarterly history that the framework is built around.
Reusability economics. The filing leans on reusable- rocket economics as the source of unit-cost advantage in launch services. Capital intensity remains high relative to a software business, but unit cost per kilogram to orbit has declined materially since the introduction of full first-stage reusability.
5.
THE
“FOREVER
SQUEEZE”
—
Lockup Mechanics
Setup. The S-1 describes a two-track lockup architecture on pages 266 to 267 of the filing. We view this as the single most important pre-listing structural feature for investors to understand, because it dictates how much stock can actually trade in the months following the offering.
Track A — Musk and significant investors. Shares held by Elon Musk and a list of significant investors are subject to a 366-day lockup. The filing contains no early-release provisions for this track. In practice, this means a large portion of the company's pre-IPO equity is removed from the tradable float for approximately one calendar year.
Track B — other insiders. Other insiders are subject to a 180-day base lockup with a series of staggered early-release triggers. The triggers, as disclosed, include: 20% release after the second-quarter post- IPO earnings report; an additional 10% if the stock closes 30% above the IPO price for five out of ten trading days; further tranches of approximately 7% releasing on days 70, 90, 105, 120, and 135; 28% release after third-quarter post-IPO earnings; and any remaining balance at day 180.
Lockup track
Duration Early-release triggers
Musk + significant investors
366 days None
Other insiders
180 days (base)
20% after Q2 earnings; +10% on 30%-above-IPO rule; +7% staggered (D70, D90, D105, D120, D135); 28% after Q3 earnings; balance at D180
Why this matters. The combination of (i) very high index-fund demand expected at listing under the new Nasdaq fast-entry rule, (ii) a low effective public float during the first months, and (iii) a hard one-year lock on the largest insider holdings, produces a structural supply–demand mismatch we describe as the “forever squeeze.” We do not predict price direction. We do, however, observe that the mechanics differ materially from any other modern mega-IPO.
Nasdaq's listing-rule update effective May 1, 2026, reduced the index-seasoning period to 15 days, eliminated the prior minimum float requirement, and introduced a 3× weighting factor for issuers whose public float is below 20%. The change has been widely reported by Reuters and major financial-news outlets. Practically, the rule accelerates the timeline by which a newly listed mega-cap can be added to passive-index portfolios.
ANALYST NOTE The “forever squeeze” is a description of mechanics, not a forecast of returns. Many large IPOs with locked-up floats have experienced violent rallies followed by violent unwinds when lockups release. Investors should anchor on the lockup calendar
6. The $28.5T Tam — Broken Apart
Three buckets. The S-1's total addressable market is the sum of $370B in launch, $1.6T in connectivity, and $26.5T in AI. We expect investors and analysts to scrutinize the AI figure most heavily, because it depends on assumptions about both the addressable share of global compute spend and the share that any single operator can capture.
Launch market. A $370B figure reflects expected lifetime spend across commercial satellite operators, national security customers, civil space agencies, and emerging applications including human spaceflight tourism and lunar logistics. SpaceX's existing share of commercial launches puts it in a position to capture a disproportionate share of the incremental demand.
Connectivity market. A $1.6T figure aggregates terrestrial broadband replacement opportunity, enterprise connectivity, government communications, mobile-network backhaul, maritime, aviation, and direct-to-cell services. Starlink already addresses several of these verticals at commercial scale.
AI infrastructure market. A $26.5T figure—the largest of the three—reflects the company's view of long-run global spending on compute, training data, model deployment, and physical AI infrastructure. The S-1 articulates a roadmap toward orbital data centers; we treat that figure as a directional anchor rather than a near-term revenue line.
7. STARLINK DEEP DIVE
Subscriber trajectory. Per the S-1, Starlink subscribers grew from approximately 2.3 million at year-end 2023 to 4.4 million at year-end 2024, then 8.9 million at year-end 2025, and approximately 10.3 million as of the latest disclosed period. We view that trajectory as the fastest-scaling rollout in the history of consumer telecommunications by units served.
Revenue contribution. Starlink now contributes about 61% of total company revenue. Connectivity is now the dominant business line.
Underlying drivers. Three drivers underpin the growth: (i) expansion into previously underserved geographies, (ii) the launch of direct-to-cell service in partnership with terrestrial mobile carriers, and (iii) maritime, aviation, and enterprise SKUs at premium price points.
Year
Starlink subscribers
Year-over-year growth
Year-end 2023
~2.3M —
Year-end 2024
~4.4M ~+91%
Year-end 2025
~8.9M ~+102%
Latest disclosed
~10.3M ~+16% partial- period
8. SPACE-BASED DATA CENTERS —
THE 100 TW BET
First-time disclosure. The S-1 contains a written commitment to deliver “non-Earth-based data centers capable of delivering 100 terawatts of compute per year.” This is, to our knowledge, the first time the orbital-data-center concept has been written into a public-company filing of this magnitude.
Why orbit. Three physical advantages support the rationale: (i) continuous solar irradiation in suitable orbits provides effectively free power, (ii) the vacuum of space provides a thermal sink that materially reduces cooling cost relative to Earth-bound hyperscale data centers, and (iii) the absence of grid- connection constraints and land-use permits removes the bottlenecks that currently slow data-center construction on the ground.
Capex implications. Reaching the 100 TW capacity goal will require lift capacity that does not currently exist in commercial form. Our analysis suggests the unit launch economics of next-generation, fully reusable heavy-lift vehicles are the binding constraint.
REALITY CHECK The 100 terawatt figure is a roadmap target, not a near-term revenue line. Investors should treat it as the upper bound of management's ambition, scaffolded by the CEO compensation milestones described in Section 9.
9. Governance — The Musk Pay Package & Voting Control
Two distinct awards. The S-1 discloses two performance-based equity awards for Elon Musk: (a) a SpaceX CEO award covering one billion shares, with vesting milestones beginning at a $500 billion company market capitalization and culminating at a $7.5 trillion threshold paired with a one-million-person Mars-colony milestone; and (b) an AI CEO award covering approximately 302.1 million shares, with market-capitalization milestones beginning at $1.065 trillion and culminating at $6.565 trillion, tied to the orbital-data-center capacity goal of 100 terawatts per year.
Voting control. Class B shares carry 10× the voting power of Class A shares. After the offering, Mr. Musk's voting control is disclosed at approximately 85.1%. This is a structurally controlled company. Public shareholders will not, in any practical sense, be able to displace the founder.
Award Shares Vesting milestones
SpaceX CEO Award
~1.0B $500B → $7.5T market cap +
1M-person Mars colony
AI CEO Award
~302.1M $1.065T → $6.565T market cap + TW orbital compute
Why this matters. Compensation milestones that extend to multi-trillion-dollar market capitalizations communicate two things: (i) the founder is structurally aligned with very long-duration outcomes, and (ii) the founder has personal incentive to manage capital structure—possibly including share-backed borrowing —to avoid premature liquidation of his vested stake.
10. THE ECOSYSTEM — PUBLIC-
MARKET
Suppliers,
RIVALS
&
ADJACENCIES
Our framework. When a private mega-cap files to go public, the listed names that supply it, compete with it, or operate in adjacent verticals historically experience a re-rating window that begins before the IPO date and continues into the first lockup release. We do not predict the size or direction of any such move. We simply observe the pattern.
Categories we track. The ecosystem can be sorted into four buckets:
Pure-play space suppliers and contractors: small- and mid-cap U.S. listed names with revenue exposure to satellite payloads, ground systems, in-space servicing, and space-domain awareness.
Public-market launch competitors: alternative providers of small-to-medium lift, which benefit from any constraint on SpaceX manifest capacity.
Defense and aerospace primes: larger, lower- beta exposure via U.S. defense contractors with space-segment revenue.
Thematic ETFs: covered separately in Section 14.
Named ecosystem references in the script. The accompanying video references several U.S.-listed names operating in the space-economy ecosystem: Redwire Voyager Technologies (NYSE: VOYG), Firefly Aerospace (NASDAQ: FLY), and Orbit International (NASDAQ: OBT). We profile them at a high level below. None of these references constitute a recommendation.
Ticker Name Role in the ecosystem
RDW Redwire In-space manufacturing, payloads, ground systems
VOYG Voyager
Technologies
Space station, exploration, defense communications
FLY Firefly
Aerospace
Small-to-medium lift launch and orbital services
OBT Orbit
International
Electronics and communications subsystems
Felix's quality lens. Per the The Prehn Institute framework, each of these names should be screened against gross margin, operating margin, ROCE, cash conversion, leveraged free-cash-flow margin, leverage, and interest cover before any allocation decision. Most pure-play space names are not yet GAAP-profitable at the operating line; investors applying the growth-stock variant of the framework should weight TAM exposure, revenue growth, low debt, and founder/CEO alignment more heavily.
11. Chip Supply Chain — Tsm, Intc,
AMKR
Why semiconductors matter here. The orbital-data- center thesis described in Section 8 depends on a chip supply chain that can deliver power-efficient compute at scale, package it for harsh environments, and second-source any geographic concentration risk. We focus on three U.S.-listed names that anchor this supply chain.
Taiwan Semiconductor Manufacturing Company
(NYSE: TSM). (NYSE: TSM). The leading-edge foundry. Any large compute platform—orbital or terrestrial—ultimately routes through TSMC's process nodes.
Intel (NASDAQ: INTC). Intel (NASDAQ: INTC). The U.S.-based second source. Intel's foundry pivot is the most credible alternative to a Taiwan-only supply chain. Geopolitical risk gives this leg of the chain disproportionate strategic value.
Amkor Technology (NASDAQ: AMKR). Amkor Technology (NASDAQ: AMKR). Outsourced semiconductor assembly and test. Every advanced chip that ships eventually flows through a packaging house, and Amkor is the largest U.S.-listed pure play.
Ticker Name
Role in the AI & space- compute chain
Taiwan Semiconductor
Leading-edge fab
Intel second-source foundry
Amkor Technology Advanced packaging & assembly
12.
FELIX'S
QUALITY
STOCK
AMKR
Checklist — Applied
Felix Prehn's The Prehn Institute framework rejects the binary value-vs-growth taxonomy. The framework looks for quality. Below we apply each criterion to the SpaceX situation as disclosed in the S-1, and to the ecosystem layer where public investors will most directly play the theme.
12.1 IS THE BUSINESS PROFITABLE?
Criterion
What it tells us
SpaceX read
Gross margin
Size of the moat
S-1 does not provide multi-year quarterly comparability; reusability economics directionally support a widening structural gross margin in launch.
Operating margin
Cost control Capital intensity remains high; expect operating- margin scaling to be Starlink-led as subscriber economies of scale build.
ROCE Management effectiveness
Insufficient public quarterly history to compute. Re-evaluate after first public-company financials.
Criterion
What it tells us
SpaceX read
Cash conversion
Profit-to- cash quality
Mixed: Starlink revenue is subscription-like and high- quality; launch revenue is contract-driven and lumpier.
Leveraged FCF margin
Sales that end up as cash
Awaiting public-company disclosures.
12.3 IS IT FINANCIALLY STABLE?
Criterion
What it tells us
SpaceX read
Leverage Financial risk
Backlog of $28.4B provides revenue visibility; capital structure post-IPO is a key variable to monitor.
Interest cover
Comfort with debt
Awaiting public-company disclosures.
12.4 VALUATION
Criterion SpaceX read
P/E and forward P/E
Not meaningful pre-listing.
Consistent earnings growth
Trajectory in revenue is strong; the cleanest indicator of consistency is Starlink subscriber growth.
EPS growth Not yet a public-issuer metric.
12.5 MOAT
Cost advantage. Reusable-rocket economics give SpaceX a structural cost lead in commercial launch.
Size advantage. Starlink's deployed satellite count and customer base produce economies of scale in capex amortization and ground operations. Switching
costs. Direct-to-cell partnerships and integrated terminals raise carrier switching costs over time.
Patents and licenses. Spectrum rights, regulatory authorizations, and orbital slots collectively constitute a regulatory moat.
12.6 GROWTH-STOCK CRITERIA
SpaceX clearly fits the growth-stock variant of the The Prehn Institute framework: high operating margin
potentialstrong revenue growth potential, strong revenue growth, manageable post-IPO debt, an enormous target market well in excess of the framework's 25× TAM threshold, brand strength, technology leadership in launch and constellation, sustained high R&D spend, and a CEO who is heavily invested in the equity through the two compensation awards described in Section 9.
13. Risk Factors
Concentration in a single CEO. 85.1% voting control means strategic risk and governance risk are correlated with one individual. The same factor that delivers founder-aligned long-duration thinking also means there is no meaningful check on capital allocation.
Lockup overhang. The early-release triggers in Track B of the lockup are price-contingent. A run-up early in the post-IPO period can mechanically release additional supply at day 70, 90, 105, 120, and 135, creating a self-correcting pattern.
Execution risk on space data centers. The 100 TW orbital-compute commitment is an unprecedented engineering goal. The vesting structure of the AI CEO award is tied directly to this milestone.
Regulatory risk. Spectrum rights, orbital-slot allocations, export control, and direct-to-cell coordination with terrestrial carriers all involve regulatory agencies. Any one of these can become a material headwind.
Macro and rate environment. Mega-cap IPOs are sensitive to liquidity conditions and to the cost of capital. A regime change in rates during the lockup window would change the supply-demand picture materially.
Geopolitical chip supply risk. The orbital-data- center thesis is exposed to any disruption of leading- edge foundry capacity. The TSM/INTC/AMKR triangle is the principal mitigation, but it is not zero risk.
Day-one euphoria. The history of mega-IPOs argues that the initial trading session is rarely the optimal entry point for long-duration holders. Index inclusion mechanics can compress the buying window, but valuation work should run independently of crowd flow.
RISK SUMMARY IN ONE LINE The same things that make the offering historic—concentration of vision, lockup architecture, multi-trillion-dollar milestones— are the same things that make it risky.
14.
LOWER-RISK
EXPOSURE
—
SECTOR & THEMATIC ETFS
Why ETFs. Investors who want diversified exposure to the same secular theme—the space economy, satellite connectivity, and the surrounding aerospace value chain—without committing to a single name often use sector or thematic exchange-traded funds. ETFs spread idiosyncratic risk across multiple holdings and provide a single ticker.
Selection methodology. We focus on U.S.-listed ETFs that publish their full holdings daily and whose mandate explicitly covers space-economy or aerospace-and-defense exposure. Allocations and constituents change. Always verify current holdings on the issuer's website before any commitment.
Ticker Fund Mandate
Space
Exploration & Innovation ETF
Active thematic exposure to space- related innovation
Procure Space ETF Pure-play global space-economy index
ROKT SPDR S&P Kensho
Final Frontiers ETF
Space and deep-sea innovation index
ITA iShares U.S.
Aerospace & Defense ETF
U.S. aerospace and defense large-cap exposure
SOXX iShares
Semiconductor ETF
U.S.-listed semiconductor exposure (chip-chain proxy)
How to think about which ETF. A pure-play view of space (UFO, ROKT, ARKX) gives concentrated exposure to small-and-mid-cap pure plays—higher beta, higher reward potential, more volatility. A blended aerospace-and-defense view (ITA) gives lower-beta exposure with established cash-generative primes. A semiconductor view (SOXX) is the cleanest way to express the AI-compute leg of the thesis without single-name risk.
IN PLAIN ENGLISH ETFs are baskets. If you can't pick one company, you can buy a small slice of many. UFO and ARKX hold a lot of small space names. ITA holds the big aerospace giants. SOXX holds the chip makers.
15. HISTORICAL PATTERN — WHAT
MEGA-IPOS TEACH US
The cautionary list. History shows that the largest, most-hyped IPOs are not automatically good investments at the open print. Uber, Rivian, Snap, and Facebook each priced into significant retail enthusiasm and then traded substantially lower than the offering price within the first six to twelve months. Each subsequently recovered on different timelines and different fundamentals.
The lesson. Hype is not a thesis. The cleanest pattern for a long-duration holder is to let the first lockup release pass, observe how the company reports its first two quarters as a public issuer, and let valuation discipline reset before sizing a position.
IPO Pattern in first 6–12 months
Uber Priced into retail enthusiasm; traded below
IPO price for an extended period
Rivian Sharp post-IPO rally followed by a multi- quarter drawdown
Snap Traded below IPO price within the first year
Facebook Traded below IPO price for a year before re- rating sharply
16. CONCLUSION
The SpaceX S-1 is, in our view, the most structurally interesting public offering of the current cycle. The combination of an explicit $28.5 trillion total addressable market, a $28.4 billion contracted backlog, a Starlink subscriber base that has compounded from roughly two million to over ten million inside three years, a 366-day lockup on the largest holdings without early-release provisions, a Nasdaq rule change that compresses index inclusion to a fifteen-day seasoning, and a CEO compensation architecture that vests against multi-trillion-dollar market-cap thresholds together produce a setup that has no direct historical comparable.
We expect retail investors to be most productively positioned by working the ecosystem layer: public- market suppliers, launch competitors, defense primes with space-segment revenue, semiconductor names exposed to the AI-compute leg of the thesis, and thematic ETFs covering aerospace and space- economy mandates. Every name in this report should be screened against Felix's quality framework before any allocation is considered.
This dossier does not contain a buy or sell rating. It does not contain a price target. It does not contain technical analysis. Its purpose is to compress what is public, what is verifiable, and what is structural about the offering into a single working document for educational use.