
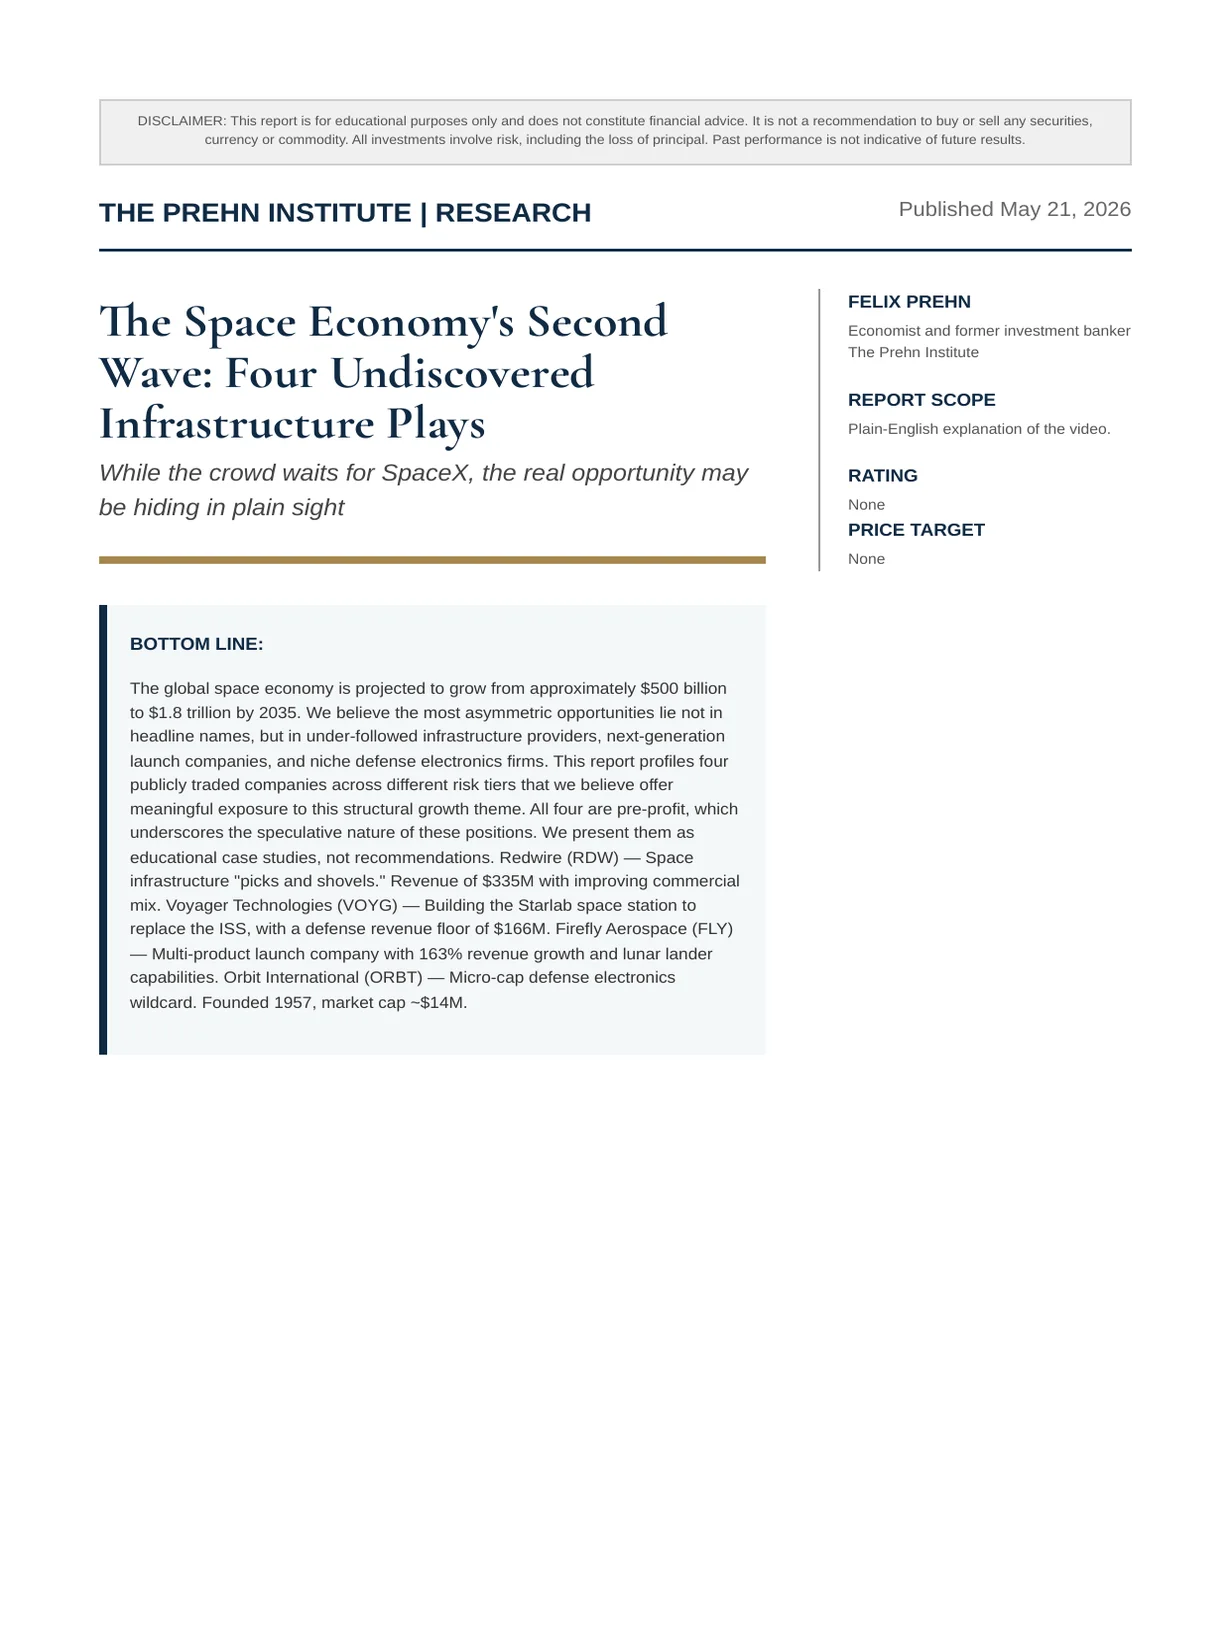
The Space Economy's Second Wave: Four Undiscovered Infrastructure Plays
While the crowd waits for SpaceX, the real opportunity may be hiding in plain sight
Felix Nikolas Prehn · 21 May 2026 · 15 pages
Bottom line
The global space economy is projected to grow from approximately $500 billion to $1.8 trillion by 2035. We believe the most asymmetric opportunities lie not in headline names, but in under-followed infrastructure providers, next-generation launch companies, and niche defense electronics firms. This report profiles four publicly traded companies across different risk tiers that we believe offer meaningful exposure to this structural growth theme. All four are pre-profit, which underscores the speculative nature of these positions. We present them as educational case studies, not recommendations. Redwire (RDW) — Space infrastructure "picks and shovels." Revenue of $335M with improving commercial mix. Voyager Technologies (VOYG) — Building the Starlab space station to replace the ISS, with a defense revenue floor of $166M. Firefly Aerospace (FLY) — Multi-product launch company with 163% revenue growth and lunar lander capabilities. Orbit International (ORBT) — Micro-cap defense electronics wildcard. Founded 1957, market cap ~$14M.
Overview
Executive Summary
About Felix Prehn and The Prehn Institute
Investment Thesis: The Space Economy Inflection
The IPO Exit Liquidity Problem
Redwire Corporation (RDW) — Deep Dive
Voyager Technologies (VOYG) — Deep Dive
Firefly Aerospace (FLY) — Deep Dive
Orbit International (ORBT) — Deep Dive
Lower-Risk Alternatives: Space & Defense ETFs
Felix's Quality Stock Framework Applied
Growth Stock Criteria Assessment
Sector Risk Factors
Conclusion
Sources & Citations
The Structural Shift. We are witnessing a fundamental transformation in the economics of space access. Launch costs have fallen by over 90% in the past two decades, driven primarily by SpaceX's reusable rocket technology. This cost reduction is catalyzing an entirely new commercial ecosystem
- from satellite broadband constellations to in-space manufacturing, lunar logistics, and commercial space stations.
The $1.8 Trillion Opportunity. According to projections from Morgan Stanley, Bank of America, and McKinsey, the global space economy is expected to grow from roughly $500 billion today to $1.8 trillion or more by 2035. This growth is driven by satellite communications (Starlink alone may generate $30B+ in annual revenue), national security spending, commercial space stations, and the emerging lunar economy.
Why Infrastructure Matters. In every major economic buildout — from railroads to the internet — the most reliable returns often go to the infrastructure providers rather than the end-users. In the space economy, this means the companies building solar arrays, power systems, launch vehicles, space stations, and mission-critical electronic components. These businesses benefit regardless of which specific application or mission succeeds.
The Timing Question. We believe the space economy is at an inflection point similar to the internet in the late 1990s — the fundamental technology works, costs are falling rapidly, and commercial applications are beginning to scale. The International Space Station is scheduled for decommissioning around 2030, NASA's Artemis program is progressing toward sustained lunar presence, and the Department of Defense is dramatically increasing its space-based capabilities budget. These are structural catalysts, not short-term news events.
Our Approach. Rather than focusing on the well-known names that have already experienced significant appreciation, we have identified four companies at different stages of maturity and different risk profiles that we believe offer asymmetric exposure to the space economy's next phase of growth.
Understanding the Mechanism. When a private company like SpaceX goes public, the Initial Public Offering is fundamentally designed to provide liquidity to early investors
- venture capitalists, institutional funds, and employees who have held illiquid positions for years, sometimes decades. The IPO is their exit event.
The Valuation Challenge. SpaceX is currently valued at approximately $1.5–2 trillion in private market transactions. At that valuation, the company would be one of the most valuable in the world upon listing. For retail investors buying at IPO, the mathematical reality is challenging: even strong execution from this base implies modest percentage returns relative to the risk assumed.
Historical Precedent. The pattern is well-documented. Uber went public at $45 per share in May 2019 and took years to recover its IPO price. Lyft debuted at $72 in March 2019 and has never returned to that level. WeWork's attempted IPO at a $47 billion valuation collapsed entirely. While SpaceX's fundamentals are substantially stronger than these examples, the underlying dynamic — insiders selling to retail at peak valuations — deserves careful consideration.
The Alternative. We believe investors seeking space economy exposure may be better served by identifying publicly traded companies that are already building critical infrastructure at valuations that still reflect meaningful upside. The four companies profiled in this report represent that thesis.
REDWIRE CORPORATION (NYSE: RDW)
Sector: Industrials — Aerospace & Defense Employees: Jacksonville, FL
Jan 2021 Market Cap: ~$2.2B
Company Overview. Redwire is a space infrastructure company that develops, manufactures, and sells mission- critical space solutions and components for national security, civil, and commercial space markets. Operations span the United States, Luxembourg, Germany, South Korea, Poland, and other international markets.
The "Picks and Shovels" Thesis. During the California Gold Rush, the most consistent profits went to merchants selling tools rather than prospectors panning for gold. Redwire occupies a similar position in the space economy. Their products — solar arrays, antennas, sensors, star trackers, composite booms, and robotic systems — are required by virtually every spacecraft regardless of mission type. As overall space activity increases, Redwire's addressable market expands proportionally.
Key Products & Capabilities. The company's Roll-Out Solar Arrays (ROSA) are currently deployed on the International Space Station, providing power to the entire facility. Redwire has demonstrated 3D printing technology in microgravity, manufactured composite booms, and produces space- qualified camera systems. Their proprietary enterprise software suite enables digital engineering and simulation of spacecraft and constellations in a cloud-based SaaS model.
In-Space Manufacturing Optionality. The long-term thesis centers on in-space manufacturing — producing high-value materials (fiber optics, semiconductors, biomedical compounds) that benefit from microgravity conditions. While still experimental, successful commercialization could open entirely new revenue streams with potentially higher margins than current hardware sales.
Customer Base. Approximately 60% of revenue derives from government contracts (NASA, DoD) with the remaining 40% from commercial customers. The commercial mix is growing, which we view as positive for long-term diversification.
Financial Summary — Redwire (RDW)
| Metric | FY 2023 | FY 2024 | FY 2025 | Q1 2026 |
|---|---|---|---|---|
| Revenue | $243.8M | $304.1M | $335.4M | $97.0M |
| Gross Profit | $58.0M | $44.5M | $17.3M | $25.8M |
| Gross Margin | 23.8% | 14.6% | 5.2% | 26.6% |
| Operating Income | -$15.5M | -$42.2M | -$229.7M | -$76.5M |
| Net Income | -$27.3M | -$114.3M | -$226.6M | -$76.5M |
| EPS | -$0.73 | -$2.35 | -$2.28 | N/A |
| Balance Sheet (Latest) | Value |
|---|---|
| Total Assets | $1.45B |
| Total Debt | $231.3M |
| Cash & Equivalents | $95.2M |
| Stockholders' Equity | $1.06B |
| Current Ratio | 1.62 |
| Debt-to-Equity | 0.22 |
| Free Cash Flow (FY2025) | -$190.8M |
Source: Financial Modeling Prep API.
Commercial space station contracts (Axiom, Blue Origin, Voyager Starlab) NASA Lunar Gateway infrastructure awards In-space manufacturing demonstration revenue Q1 2026 gross margin recovery to 26.6% (from 5.2% in FY2025)
KEY RISKS
Government customer concentration. FY2025 gross margin compression was severe (5.2%). Persistent operating losses (-$229.7M). Negative free cash flow (-$190.8M). Acquisition integration risk from growth-by-M&A strategy. In-space manufacturing remains unproven commercially.
VOYAGER TECHNOLOGIES (NYSE: VOYG)
Sector: Industrials — Aerospace & Defense Employees: Denver, CO
Jun 2025 Market Cap: ~$2.3B
Company Overview. Voyager Technologies (formerly Voyager Space Holdings) is a defense technology and space solutions company operating through three segments: Defense & National Security, Space Solutions, and Starlab Space Stations. The company was incorporated in 2019 and renamed in February 2025.
The Starlab Thesis. The International Space Station has been operational since 1998 — over 25 years. NASA has committed to decommissioning the ISS by approximately 2030 and has awarded contracts under its Commercial Low- Earth Orbit Destinations (CLD) program for commercial replacements. Voyager's Starlab, developed in partnership with Airbus, is one of the leading contenders to provide continuous human presence in low Earth orbit after ISS retirement.
Defense Revenue Floor. What differentiates Voyager from pure-play space companies is its defense business. The Defense & National Security segment produces missile defense interceptors, kill vehicles, hypersonic missiles, signal intelligence systems, radiation-hardened communications, and AI-powered edge computing products. This provides recurring revenue while the Starlab program develops — a structural advantage over competitors that are purely dependent on space station development milestones.
Space Solutions Segment. The company's Space Solutions division offers in-space propulsion systems, space infrastructure, and mission management products. This positions Voyager across the full spectrum of space operations rather than depending on a single product line.
The Airbus Partnership. The partnership with Airbus for Starlab brings European aerospace expertise, funding capability, and institutional credibility. Airbus is one of the world's largest aerospace companies, and their involvement materially de-risks the technical and financial execution of the station program.
Financial Summary — Voyager Technologies (VOYG)
| Metric | FY 2023 | FY 2024 | FY 2025 | Q1 2026 |
|---|---|---|---|---|
| Revenue | $136.1M | $144.2M | $166.4M | $35.2M |
| Gross Profit | $27.8M | $34.9M | $21.3M | -$5.8M |
| Gross Margin | 20.4% | 24.2% | 12.8% | -16.4% |
| Operating Income | -$14.2M | -$48.4M | -$103.1M | -$44.0M |
| Net Income | -$25.4M | -$62.1M | -$104.8M | -$44.0M |
| EPS | -$0.74 | -$1.44 | -$1.99 | N/A |
Source: Financial Modeling Prep API.
| Balance Sheet (Latest) | Value |
|---|---|
| Total Assets | $1.05B |
| Total Debt | $466.8M |
| Cash & Equivalents | $491.3M |
| Stockholders' Equity | $383.7M |
| Current Ratio | 4.37 |
| Debt-to-Equity | 1.22 |
| Free Cash Flow (FY2025) | -$205.6M |
Source: Financial Modeling Prep API.
Starlab development milestones and NASA CLD program reviews ISS decommissioning timeline (target ~2030) creates structural urgency Defense contract wins (missile defense, hypersonic, intelligence) Strategic Airbus partnership de-risks execution
KEY RISKS
Space station construction is among the most complex engineering projects in existence. Losses are accelerating (-$104.8M in FY2025). Debt-to-equity of 1.22 is elevated. Q1 2026 gross margin turned negative (-16.4%). Competing against well- funded Axiom Space and Blue Origin's Orbital Reef. Starlab delays could extend cash burn significantly.
FIREFLY AEROSPACE (NASDAQ: FLY)
Sector: Industrials — Aerospace & Defense Employees: Cedar Park, TX
Aug 2025 Market Cap: ~$6.9B
Company Overview. Firefly Aerospace provides integrated launch and space services technology for national security, government, and commercial customers. The company offers an unusually broad product portfolio for a firm of its size, spanning launch vehicles, lunar landers, orbital servicing vehicles, and imaging services.
The Multi-Product Thesis. What makes Firefly distinctive is the breadth of its offerings. Alpha is a responsive small launch vehicle for dedicated small satellite missions. Eclipse is a medium-lift launch vehicle targeting the larger payload market currently dominated by SpaceX's Falcon 9. Blue Ghost is a lunar lander selected by NASA for Commercial Lunar Payload Services (CLPS) missions. Elytra provides in-space maneuvering and orbital servicing. Ocula delivers lunar imaging and intelligence services.
Revenue Inflection. Firefly demonstrates the most dramatic revenue growth of any company in this report. Revenue approximately tripled from $60.8M in FY2024 to $159.9M in FY2025, representing roughly 163% year-over-year growth. Q1 2026 revenue of $80.9M suggests the acceleration is continuing. This growth profile is exceptional, though losses remain substantial.
National Security Value. The U.S. military increasingly demands responsive launch capability — the ability to rapidly deploy satellites in response to emerging threats. Firefly's Alpha rocket is designed for quick-turnaround missions, positioning the company for DoD contracts in a growing market segment. This provides a strategic revenue stream independent of commercial space activity.
Lunar Ambitions. A successful Blue Ghost lunar landing would place Firefly in an extraordinarily exclusive category of companies that have landed on the Moon. This would dramatically enhance credibility for future contracts and could serve as a valuation catalyst regardless of the mission's direct revenue impact.
Financial Summary — Firefly Aerospace (FLY)
| Metric | FY 2023 | FY 2024 | FY 2025 | Q1 2026 |
|---|---|---|---|---|
| Revenue | $55.2M | $60.8M | $159.9M | $80.9M |
| Gross Profit | $26.6M | -$11.4M | $24.9M | $10.3M |
| Gross Margin | 48.2% | -18.7% | 15.6% | 12.7% |
| Operating Income | -$131.9M | -$209.5M | -$246.6M | -$96.7M |
| Net Income | -$135.5M | -$231.1M | -$298.3M | -$96.7M |
| EPS | -$1.09 | -$1.85 | -$2.21 | N/A |
Source: Financial Modeling Prep API.
| Balance Sheet (Latest) | Value |
|---|---|
| Total Assets | $1.82B |
| Total Debt | $308.6M |
| Cash & Equivalents | $793.0M |
| Stockholders' Equity | $1.19B |
| Current Ratio | 4.51 |
| Debt-to-Equity | 0.26 |
| Free Cash Flow (FY2025) | -$237.8M |
Source: Financial Modeling Prep API.
Blue Ghost lunar mission — transformational if successful Alpha launch cadence acceleration (demonstrates operational maturity) Eclipse medium-lift vehicle development (expands TAM dramatically) National security responsive launch contracts from DoD
KEY RISKS
Deeply unprofitable: net losses of -$298.3M on $159.9M revenue. Cash burn rate of -$237.8M annually against $793M cash position (approximately 3.3 years of runway at current rate). Launch vehicles carry binary mission risk — failures destroy value. Eclipse is still in development. Limited public market track record (IPO August 2025). Gross margins volatile (ranged from -18.7% to 48.2% over three years).
ORBIT INTERNATIONAL CORP. (OTC: ORBT)
Sector: Industrials — Electrical Equipment Employees: Hauppauge, NY Founded: 1957 Market Cap: ~$13.5M
Company Overview. Orbit International designs, manufactures, and sells electronic components, subsystems, and power units for prime defense contractors, government procurement agencies, and R&D laboratories worldwide. The company operates through two segments: Electronics Group and Power Group. This is a micro-cap company trading on the OTC market.
The Indirect Space Play. Orbit International is not a space company per se. Rather, it is a supplier of mission-critical components to the prime defense contractors who build space and aerospace platforms. Their rugged human- machine interfaces, sunlight-readable displays, and military- grade power supplies are the building blocks that go into satellite ground control systems, spacecraft electronics, and space-based military platforms.
Electronics Group. This segment manufactures ultra-rugged keyboards, displays, control panels, and command display units designed for extreme environments — military aircraft, naval vessels, ground-based defense systems, and military simulation platforms. The Q-Vio subsidiary produces sunlight- readable LCD displays. Simulator Product Solutions provides bezels for military simulation and training.
Power Group. Through its Behlman Electronics subsidiary, Orbit produces high-reliability power supplies, frequency converters, and uninterruptible power supplies for military and industrial applications. Their VPX power supply technology targets the next-generation standard for military electronics — a potential growth driver as defense systems modernize.
The Micro-Cap Asymmetry. At a market capitalization of approximately $13.5 million against annual revenue of $22– 30 million, Orbit trades at a fraction of revenue. The company has been in business since 1957, maintains ISO 9001:2015 certification, pays a dividend ($0.04/share), and operates a stock buyback program. This is not a speculative startup — it is an established, if tiny, defense electronics supplier.
The Bull Case. If defense and aerospace electronics spending increases — which U.S. defense budget projections universally suggest — even modest order growth on Orbit's small revenue base translates into large percentage gains. A move from $22M to $44M in revenue would represent a 100% increase that is achievable for a company with established products and customer relationships.
Financial Summary — Orbit International (ORBT)
| Metric | FY 2023 | FY 2024 | FY 2025 | Q1 2026 |
|---|---|---|---|---|
| Revenue | $27.6M | $29.9M | $22.5M | $5.2M |
| Gross Profit | $8.7M | $10.0M | $5.8M | $1.2M |
| Gross Margin | 31.7% | 33.3% | 25.6% | 23.3% |
| Operating Income | -$1.0M | -$0.5M | -$4.6M | -$1.5M |
| Net Income | -$1.1M | -$0.6M | -$5.0M | -$1.5M |
| EPS | -$0.34 | -$0.19 | -$1.51 | N/A |
Source: Financial Modeling Prep API.
| Balance Sheet (Latest) | Value |
|---|---|
| Total Assets | $22.2M |
| Total Debt | $4.5M |
| Cash & Equivalents | $0.7M |
| Stockholders' Equity | $12.8M |
| Current Ratio | 1.66 |
| Debt-to-Equity | 0.35 |
| Free Cash Flow (FY2025) | -$2.2M |
Source: Financial Modeling Prep API.
⚠ CRITICAL RISK WARNING — MICRO-CAP
This is an OTC-traded micro-cap with extremely low liquidity (average daily volume ~350 shares). Getting in and out of positions can be very difficult. Revenue declined 25% in FY2025 ($22.5M vs. $29.9M). Net loss widened to -$5.0M. Cash position is minimal ($0.7M). Revenue is lumpy due to large individual defense contracts. Customer concentration is high. We would consider this a 1–2% maximum portfolio allocation for investors with appropriate risk tolerance.
For investors seeking space economy exposure without the concentration risk of individual stocks — particularly early- stage, pre-profit companies — we highlight the following exchange-traded funds as potentially more suitable vehicles.
| ETF | Name | Focus | Why Consider |
|---|---|---|---|
| UFO | Procure Space ETF | Pure-play space economy | Broadest space exposure: satellite operators, launch services, ground equipment. Diversifies away from single-stock risk. |
| ARKX | |||
| ARK Space & Defense | |||
| Innovation ETF | |||
| Space + defense | |||
| innovation | |||
| Actively managed. Includes both pure-play space and enabling | |||
| technology companies. Higher conviction positioning. | |||
| ITA | |||
| iShares U.S. Aerospace & | |||
| Defense ETF | |||
| Large-cap | |||
| aerospace/defense | |||
| More conservative. Includes Lockheed Martin, Boeing, Raytheon. Lower | |||
| volatility but less space-specific exposure. | |||
| XAR | |||
| SPDR S&P Aerospace & | |||
| Defense ETF | |||
| Equal-weight A&D | |||
| Equal-weighted methodology gives more exposure to mid-cap | |||
| defense/space companies vs. ITA's cap-weighted approach. | |||
| ROKT | |||
| SPDR Kensho Final | |||
| Frontiers ETF | |||
| Space + deep sea | |||
| exploration | |||
| Unique exposure to "final frontier" technologies. Includes companies in | |||
| satellite imagery, space infrastructure, and exploration. |
ETF VS. INDIVIDUAL STOCKS
Lower risk, lower reward: ETFs diversify across dozens of holdings, reducing single-stock catastrophe risk but also capping upside.
Liquidity advantage: All five ETFs trade on major exchanges with adequate daily volume, unlike ORBT's OTC listing.
Consideration: UFO and ROKT offer the most space-specific exposure; ITA and XAR provide broader aerospace/defense coverage with lower volatility.
FELIX'S QUALITY STOCK FRAMEWORK — APPLIED TO OUR FOUR STOCKS
| Criteria | RDW | VOYG | FLY | ORBT |
|---|---|---|---|---|
| Gross Margin | 26.6% (Q1'26, recovering) | -16.4% (Q1'26, concerning) | 12.7% (Q1'26) | 23.3% (Q1'26) |
| Operating Margin | Negative | Negative | Negative | Negative |
| Cash Conversion | Negative FCF | Negative FCF | Negative FCF | Negative FCF |
| Leverage (D/E) | 0.22 ✓ | 1.22 ⚠ | 0.26 ✓ | 0.35 ✓ |
| Current Ratio | 1.62 ✓ | 4.37 ✓ | 4.51 ✓ | 1.66 ✓ |
| Cash Position | $95.2M | $491.3M | $793.0M | $0.7M ⚠ |
| P/E Ratio | N/A (losses) | N/A (losses) | N/A (losses) | N/A (losses) |
| Consistent Earnings? | No — losses widening | No — losses widening | ||
| No — losses | ||||
| widening | ||||
| No — losses | ||||
| widening |
Source: Financial Modeling Prep API. ✓ = Meets threshold. ⚠ = Caution. All four companies are pre-profit.
FRAMEWORK REALITY CHECK
Candid assessment: None of these four companies currently pass Felix's quality stock framework for established businesses. All are unprofitable with negative free cash flow. This is typical for early-stage space companies in heavy investment mode. Investors considering these names must apply growth stock criteria (see next page) and accept substantially higher risk than quality-screened investments.
| Growth Criteria | RDW | VOYG | FLY | ORBT |
|---|---|---|---|---|
| Strong Revenue Growth | 10% YoY ⚠ | 15% YoY ⚠ | 163% YoY ✓✓ | -25% YoY ✗ |
| Low Debt | D/E 0.22 ✓ | D/E 1.22 ✗ | D/E 0.26 ✓ | D/E 0.35 ✓ |
| Cash to Survive a Crash | $95M (~6 months) ⚠ | $491M (~2.4 years) ✓ | $793M (~3.3 years) ✓ | $0.7M ✗ |
| Large TAM (25x+) | $1.8T space economy | |||
| ✓ | ||||
| $1.8T space + | ||||
| defense ✓ | ||||
| $1.8T space + defense | ||||
| ✓ | ||||
| Niche defense ⚠ | ||||
| Tech Leadership | ROSA, in-space mfg | |||
| ✓ | ||||
| Starlab (in dev) ⚠ | Multi-product portfolio | |||
| ✓ | ||||
| Specialized HMI ⚠ | ||||
| High R&D Spend | Yes (via acquisitions) | |||
| ✓ | ||||
| Yes (Starlab) ✓ | Yes (Eclipse, Blue | |||
| Ghost) ✓ | ||||
| Limited ✗ | ||||
| CEO/Founder Invested | Peter Cannito (CEO) | |||
| ⚠ | ||||
| Recent SPAC | ||||
| structure ⚠ | ||||
| Recent IPO ⚠ | Small insider | |||
| ownership ⚠ | ||||
| 3 Reasons Better Than | ||||
| Competitors | ||||
| See analysis above | See analysis above | See analysis above | See analysis above |
- = Passes. ✓✓ = Exceptional. ⚠ = Mixed/Uncertain. ✗ = Does not pass. Source: FMP API, company filings.
COMPETITIVE MOAT ASSESSMENT
RDW: Switching costs (space-qualified hardware is difficult to replace mid-program), established NASA/DoD relationships, in-space manufacturing IP.
VOYG: NASA CLD program selection (limited winners), Airbus partnership, defense contract incumbency.
FLY: Breadth of product line (only company offering launch + lunar delivery + orbital servicing), NASA CLPS selection.
ORBT: Incumbency with prime contractors (67 years in business), specialized rugged electronics expertise, ISO certification.
Government Budget Dependency. A significant portion of space economy revenue depends on government spending
- NASA, DoD, and allied government agencies. Budget cuts, continuing resolutions, or policy shifts could delay or cancel programs that these companies depend on.
Execution Risk. Space is unforgiving. Rocket failures, mission losses, and technical setbacks can destroy years of investment in a single event. Every company in this report faces meaningful execution risk.
Cash Burn & Dilution. All four companies are currently burning cash. Continued losses will likely require additional capital raises, which could dilute existing shareholders. Investors should monitor share count trends closely.
Valuation Uncertainty. Pre-profit companies are inherently difficult to value. Current market capitalizations reflect expectations about future performance that may or may not materialize.
Competition. SpaceX, Blue Origin, Northrop Grumman, Lockheed Martin, and other well-funded incumbents compete across many of the same markets. Smaller companies face the risk of being outspent or outmaneuvered by larger rivals.
Regulatory & Geopolitical. Space operations are heavily regulated. Export controls (ITAR), spectrum allocation, launch licensing, and international treaties can all impact business operations. Geopolitical tensions could also affect satellite and launch operations.
Liquidity Risk. ORBT trades on the OTC market with very low volume. Even RDW, VOYG, and FLY may experience periods of thin trading that could impact the ability to enter or exit positions at desired prices.

The Investment Case. The space economy is transitioning from a government-dominated sector to a commercial growth market. We believe the most asymmetric opportunities in this transition lie in under-followed infrastructure providers and emerging launch companies rather than in headline IPO events that may serve primarily as exit liquidity for early institutional investors.
The Four Opportunities. Redwire provides essential hardware that benefits from overall space activity growth. Voyager Technologies is building what could be humanity's next space station while generating defense revenue today. Firefly Aerospace offers the broadest product portfolio with explosive revenue growth. And Orbit International represents a micro-cap asymmetric bet on defense electronics demand growth.
The Honest Assessment. None of these companies currently meet traditional quality stock criteria. All are unprofitable. All carry meaningful risk of permanent capital loss. These are speculative growth investments that require a long time horizon, appropriate position sizing, and the emotional discipline to weather significant volatility.
Position Sizing Guidance. We suggest allocating 5–15% of total portfolio value to high-risk, high-reward themes like the space economy. Within that allocation, investors should diversify across multiple names and risk profiles. ORBT, given its micro-cap nature and illiquidity, warrants no more than 1– 2% of total portfolio value.
"How to Find the Next 10X Bagger"
Live & Free Workshop — Learn the complete framework for identifying asymmetric investment opportunities before the crowd.
Get Your Free Ticket Now at 10xreturns.org →
Disclaimer
DISCLAIMER: This report is for educational purposes only and does not constitute financial advice. It is not a recommendation to buy or sell any securities. All investments involve risk, including the loss of principal. This report is FTC compliant. Past performance is not indicative of future results. The analyst ("Winston") is not a registered investment advisor. All data has been sourced from publicly available information and third-party financial data providers.