
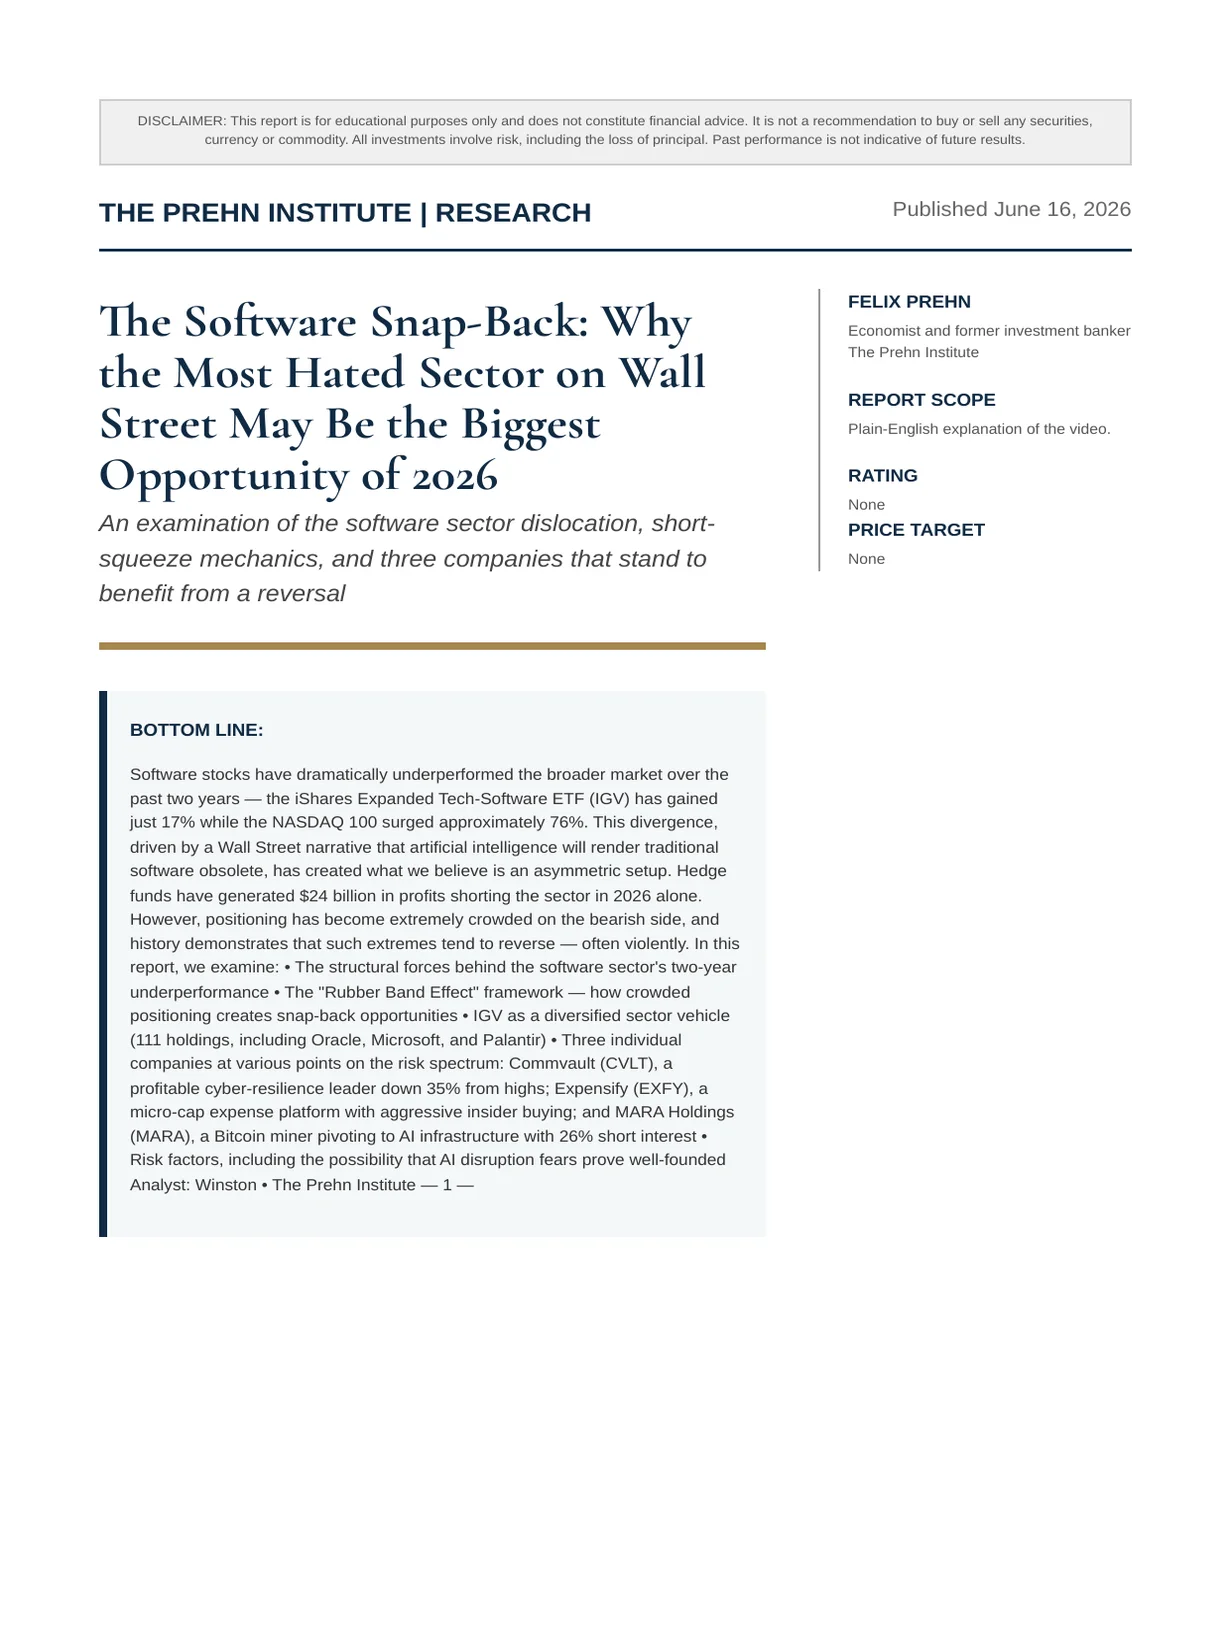
The Software Snap-Back: Why the Most Hated Sector on Wall Street May Be the Biggest Opportunity of 2026
An examination of the software sector dislocation, short-squeeze mechanics, and three companies that stand to benefit from a reversal
Felix Nikolas Prehn · 16 June 2026 · 34 pages
Bottom line
Software stocks have dramatically underperformed the broader market over the past two years — the iShares Expanded Tech-Software ETF (IGV) has gained just 17% while the NASDAQ 100 surged approximately 76%. This divergence, driven by a Wall Street narrative that artificial intelligence will render traditional software obsolete, has created what we believe is an asymmetric setup. Hedge funds have generated $24 billion in profits shorting the sector in 2026 alone. However, positioning has become extremely crowded on the bearish side, and history demonstrates that such extremes tend to reverse — often violently. In this report, we examine: • The structural forces behind the software sector's two-year underperformance • The "Rubber Band Effect" framework — how crowded positioning creates snap-back opportunities • IGV as a diversified sector vehicle (111 holdings, including Oracle, Microsoft, and Palantir) • Three individual companies at various points on the risk spectrum: Commvault (CVLT), a profitable cyber-resilience leader down 35% from highs; Expensify (EXFY), a micro-cap expense platform with aggressive insider buying; and MARA Holdings (MARA), a Bitcoin miner pivoting to AI infrastructure with 26% short interest • Risk factors, including the possibility that AI disruption fears prove well-founded Analyst: Winston • The Prehn Institute — 1 —
The Software Snap-Back
The $10,000 Mismatch: Software vs. The NASDAQ
A Tale of Two Markets. Over the past two years, a remarkable divergence has opened up within the technology sector — one that most investors have either missed entirely or chosen to ignore. The NASDAQ 100, tracked by the QQQ exchange- traded fund, has surged approximately 76% from May 2024 to June 2026. By any measure, that is an extraordinary run.
The Software Lag. But software stocks — the companies that build the applications, platforms, and services running on virtually every computer and phone on the planet — have barely participated. The iShares Expanded Tech-Software ETF (IGV) has gained just 17% over the same period. The SPDR S&P Software & Services ETF (XSW), a broader measure, managed only 15%.
In Plain Numbers. Imagine two friends. Both invest $10,000 in May 2024. Friend A puts the money into a NASDAQ 100 index fund. Friend B puts the money into a software sector fund. By June 2026, Friend A has roughly $17,600. Friend B has roughly $11,700. That is a gap of nearly $6,000 — on the same $10,000 starting amount, in the same broad "tech" sector. The gap is even more dramatic when measured from software's September 2025 peak: IGV is down approximately 21% from its all-time high of $117.79.
Where Did the Trillion Go? According to CNBC, the software sector lost roughly $1 trillion in combined market capitalisation during the downturn. That is not a rounding error. That represents real companies, real revenue, and real products — marked down by Wall Street at a pace rarely seen outside of a recession.
Context Matters. To put this in perspective, the S&P 500 is up 7.7% year-to-date in 2026 (Forbes). The broader market has been healthy. This is not a situation where everything fell together. Software fell alone — making it one of the most notable sector-specific dislocations in recent memory.
EXHIBIT 1: TWO-YEAR PERFORMANCE COMPARISON (MAY 2024 – JUNE 2026)
| Index / ETF | Ticker | 2-Year Return | From Peak | Current Price |
|---|---|---|---|---|
| NASDAQ 100 | QQQ | +76.5% | Near ATH | $744 |
| S&P 500 | SPY | +7.7% YTD | Near ATH | — |
| Software (iShares) | IGV | +17.2% | −21.3% | $92.68 |
| Software & Services | XSW | +15.2% | Below peak | $167.70 |
The question, naturally, is: why? Why would software — an industry essential to every business on Earth — underperform this dramatically while the rest of technology soared?
The answer lies on Wall Street's trading desks.
- 4 —
The Software Snap-Back
The Hedge Fund Narrative: "AI Will Kill Software"
The $24 Billion Bet. The software sector's decline was not an accident. It was, in large part, a deliberate trade. According to CNBC (February 4, 2026), confirmed by Business Insider and HedgeWeek, hedge funds generated approximately $24 billion in profits by betting against software stocks — just in the first months of 2026. The trade had been building for nearly two years.
The Thesis Was Simple. Artificial intelligence, the hedge funds argued, would make traditional software obsolete. Why pay for expensive enterprise software subscriptions when AI could automate the same tasks more cheaply? The logic sounded compelling — compelling enough to convince some of the most sophisticated investors in the world to bet billions on it.
Short-Selling, Explained Simply. For readers unfamiliar with the mechanics: short-selling is when an investor borrows shares of a company, sells them immediately, and hopes to buy them back later at a lower price. The difference is the profit. When lots of investors do this at the same time in the same sector, it creates enormous downward pressure on stock prices
- regardless of what the underlying businesses are actually doing.
Crowding Creates Fragility. Think of it like a boat. If half the passengers are standing on the port side and the other half on starboard, the boat is stable. But when everyone rushes to one side — in this case, the short side — the boat becomes dangerously unbalanced. The more people pile on, the more unstable it becomes.
The Counter-Argument Nobody Discussed. While the "AI kills software" narrative makes for dramatic headlines, the reality is considerably more nuanced. Consider Microsoft. It generates over $200 billion in annual revenue from software subscriptions. Did anyone cancel their Microsoft Office licence because ChatGPT exists? Google Docs has been free for years — it did not destroy Office. The switching costs in enterprise software are enormous. Training employees on new systems costs time, money, and productivity. Most companies simply do not do it.
The SaaSpocalypse. Bloomberg coined the term "SaaSpocalypse" in February 2026 to describe what was happening. At its worst point in April 2026, IGV was down approximately 40% from its September 2025 peak. Software companies large and small were punished indiscriminately — good businesses alongside bad ones.
But then something began to shift.
Signs of Recovery. In May 2026, IGV posted its best monthly performance since 2001. On June 9, 2026, private equity giant Thoma Bravo publicly declared the SaaSpocalypse "over." Thoma Bravo manages over $130 billion and is one of the largest buyers of software companies in the world. When they speak, the market listens.
The question now is not whether software has been beaten down — that much is obvious. The question is whether the conditions exist for a rapid reversal. Our analysis suggests they do.
- 5 —

The Software Snap-Back
The Saaspocalypse — A Timeline of What Actually Happened
Exhibit 2: Key Dates in the Software Sell-off
| Date | Event | Impact |
|---|---|---|
| Sep 2025 | IGV reaches all-time high of $117.79 | Peak optimism in software sector |
| Oct–Dec | ||
| 2025 | ||
| AI disruption narrative gains traction; hedge funds increase | ||
| short positions | ||
| Gradual decline begins | ||
| Jan 27, | ||
| 2026 | ||
| Commvault (CVLT) crashes 31% on ARR miss | ||
| Signals sentiment shift — even strong companies | ||
| punished | ||
| Feb 4, 2026 | CNBC reports $24B in hedge fund short profits from software | "SaaSpocalypse" coined by Bloomberg |
| Feb–Mar | ||
| 2026 | ||
| Broad software sell-off intensifies; EXFY hits $0.75, MARA | ||
| hits $6.73 | ||
| Indiscriminate selling across the sector | ||
| Apr 2026 | IGV bottoms, down ~40% from Sep 2025 peak | Maximum pessimism |
| May 2026 | IGV posts best month since 2001 | First signs of reversal |
| Jun 9, 2026 | Thoma Bravo declares SaaSpocalypse "over" | $130B+ PE firm signals institutional confidence |
| Jun 2026 | IGV at $92.68 — still 21% below Sep 2025 peak | |
| Significant upside to prior levels if recovery | ||
| continues |
What This Timeline Tells Us. The pattern we observe is not unusual in market history. A sector gets hit by a compelling narrative. Short-sellers pile in. Prices overshoot to the downside. Then reality reasserts itself. The critical observation is that at the point of maximum pessimism — April 2026 — nothing fundamentally changed about the software business model. Companies were still generating revenue. Customers were still paying subscriptions. The sell-off was driven by positioning, not by deteriorating fundamentals.
The Trillion-Dollar Question. If software companies are still making money, still growing, and still essential to every business — then who is right? The hedge funds who bet $24 billion against the sector? Or the companies themselves, which continue to grow revenue and expand their product lines? Our view is that the truth lies somewhere in between — but the price action has moved far past what the fundamentals justify.
First & Only LIVE Training on "How to Turn the IPO Summer into a 5-Year Wealth Machine"
Get your free seat at wealthmachine.org
- 6 —
The Software Snap-Back
The Rubber Band Effect Framework
A Framework for Understanding Reversals. Wall Street has a simple maxim: follow the money. When we apply this principle to the current software dislocation, a framework emerges that we call the "Rubber Band Effect." It is not a proprietary trading system — it is a description of how markets have behaved, repeatedly, across decades.
The Metaphor. Imagine stretching a rubber band. The further you pull it, the more tension builds. At some point, the tension becomes too great and the band snaps back — often with more force than the original stretch. Markets work the same way. When positioning becomes extremely one-sided — when virtually everyone is betting in the same direction — the conditions for a sharp reversal are in place.
Three Steps to a Snap-Back. Based on historical precedent, the Rubber Band Effect unfolds in three stages:
Step 1: Extreme Positioning. This is when virtually all the "smart money" is on one side of the trade. In the case of software, short interest across the sector has risen to multi-year highs. The $24 billion in hedge fund short profits is a clear measure of how crowded this trade has become. When everyone who wants to bet against software has already done so, there is nobody left to sell — and the supply of new short-sellers dries up.
Step 2: The Crack. This is the first sign that the rubber band is starting to slip. It typically manifests as a price breaking through a level that the market previously could not sustain. For IGV, the key level to observe is the $92–95 range, where the ETF has encountered resistance multiple times in 2026. A sustained move above $95–100 would signal that the selling pressure is exhausting itself.
Step 3: Forced Buying (The Short Squeeze). This is where the snap-back becomes violent. When prices begin rising, short-sellers face a dilemma. Every tick upward costs them money. At some point, the losses become too large and they are forced to buy shares to close their positions — the only way to exit a short position is to purchase the shares you previously sold. This buying pushes prices higher, which forces more short-sellers to cover, which pushes prices higher still. It becomes a self-reinforcing cycle.
EXHIBIT 3: THE RUBBER BAND EFFECT — VISUAL FRAMEWORK
| Stage | What Happens | What to Watch | Software Status (Jun 2026) |
|---|---|---|---|
| 1. Extreme Positioning | Everyone bets in one direction | Short interest levels, hedge fund positioning reports | ✓ Confirmed — $24B short profits, multi- year high short interest |
| 2. The Crack | |||
| Price breaks through | |||
| resistance | |||
| Key price levels; IGV above $95– | ⟳ In progress — IGV at $92.68, testing | ||
| resistance | |||
| 3. Forced Buying | |||
| Short-sellers rush to | |||
| cover | |||
| Volume spikes, rapid price | |||
| appreciation | |||
| Pending — conditions are set but not yet | |||
| triggered |
CASE STUDY: AVIS BUDGET GROUP (2021)
A Real-World Example. Avis Budget Group (CAR) provides a textbook case of how this process works. Avis was a mundane car rental company that hedge funds had heavily shorted, convinced it was a declining business. The stock fell approximately 50% as shorts piled in. Then, when results came in better than expected, the reversal was explosive — the stock surged hundreds of percent in days as short-sellers scrambled to cover. The buying was not driven by Avis becoming a dramatically better business overnight. It was mechanical — forced buying by investors who needed to exit their positions.
The Parallel. We are not suggesting that software will replicate the Avis move precisely. However, the structural setup is analogous: a widely shorted sector, extreme positioning, and the potential for a catalytic event (strong earnings, positive AI integration news, or simply exhaustion of selling pressure) to trigger forced buying at scale.
The Software Snap-Back
Igv — Performance Context
Exhibit 5: Igv Key Performance Metrics
| Metric | Value | Context |
|---|---|---|
| 2-Year Total Return | +17.2% | vs. QQQ +76.5% — massive underperformance |
| 1-Year Return | ~−11% | Negative over 12 months while S&P 500 is positive |
| 52-Week Range | $73.93 – $117.99 | Currently in the lower third of the range |
| Best Month (May 2026) | Best since 2001 | First major recovery signal in 8 months |
| Expense Ratio | 0.40% | Moderate for a sector ETF |
| Primary Exposure | US Software | 111 holdings, mostly large-cap |
Our Assessment of IGV. We view IGV as the most straightforward way to express a view on the software recovery thesis. The ETF provides diversified exposure to the sector, reducing single-stock risk, while still capturing the potential upside from a broad reversal. The 21% drawdown from its all-time high, combined with the extreme short positioning across the sector, creates what we believe is a favourable asymmetry — the potential reward for being right appears to significantly exceed the risk of further decline.
Who Is This For? Investors who believe the software sector has been oversold but are not comfortable picking individual stocks. IGV allows participation in the theme without the need to analyse individual balance sheets, earnings calls, or management teams. It is the "index fund" approach to this opportunity.
We now turn to three individual companies that offer different risk/reward profiles within the broader software snap-back thesis. Each has been selected for a specific reason: Commvault for quality, Expensify for deep value, and MARA Holdings for squeeze mechanics.
- 9 —
The Software Snap-Back
Commvault Systems (Cvlt) — The Cyber Resilience Leader
Company Overview. Commvault Systems is a cyber resilience and data protection company headquartered in Tinton Falls, New Jersey. The company provides software and SaaS solutions that help organisations protect, manage, and recover their data across on-premise and cloud environments. With approximately 3,300 employees and a client base that spans enterprise organisations globally, Commvault operates in one of the most critical — and fastest-growing — segments of the software market.
Why Commvault Matters in the AI Era. While the hedge fund narrative claims AI will kill software, Commvault sits in the exact opposite position. AI does not reduce the need for data protection — it increases it. Every AI model requires vast amounts of data. Every company deploying AI needs that data backed up, secured, and recoverable in the event of a cyber attack. Commvault builds the tools that protect the data AI runs on. In an AI-driven world, its product becomes more essential, not less.
The January Crash. On January 27, 2026, Commvault's stock crashed 31% in a single day. The cause was an Annual Recurring Revenue (ARR) miss — the company reported approximately $39 million in new ARR versus a consensus target of $45 million. This $6 million shortfall — on a company doing over $1 billion in annual revenue — triggered a sell-off that wiped out more than a third of the company's market value.
What Actually Happened. Our analysis suggests the ARR miss was primarily a mix-shift issue, not a fundamental deterioration. Commvault is in the process of transitioning from traditional licence sales to a SaaS (subscription) model. During such transitions, average selling prices (ASPs) temporarily decline because subscription revenue is recognised over time rather than upfront. The total revenue story remained strong — FY2026 revenue was $1.18 billion, up 18.9% year- over-year. The market, however, was in no mood for nuance.
CURRENT PRICE
- $127.34
- ALL-TIME HIGH (SEP 2025)
- $195.41
- DRAWDOWN FROM PEAK
- −34.8%
- FY2026 REVENUE
$1.18B
- 10 —
The Software Snap-Back
Cvlt — Financial Analysis
EXHIBIT 6: COMMVAULT — KEY FINANCIAL METRICS (FY2026)
| Metric | FY2026 | FY2025 (Prior Year) | Change |
|---|---|---|---|
| Total Revenue | $1.18 billion | $993 million | +18.9% |
| Net Income | $70.66 million | $76.1 million | −7.2% |
| Revenue Growth (YoY) | +18.9% | — | Strong |
| Short Interest (% of Float) | ~6.6% | — | Elevated |
| Short Shares | ~2.67 million | — | — |
| Sector | Technology / Software — Application | ||
| Employees | ~3,300 | ||
| CEO | Sanjay Mirchandani |
Revenue Growth Is Real. The top-line story at Commvault is straightforward and strong. Revenue of $1.18 billion represents nearly 19% growth year-over-year. For a company of this maturity, that is an impressive growth rate. It suggests that customers are not cutting Commvault from their budgets — they are spending more.
Net Income Compression. Net income declined 7.2% to $70.66 million. This is worth monitoring but is largely explained by the SaaS transition — subscription models require upfront investment in infrastructure and sales before the recurring revenue stream reaches its full potential. This pattern is common across the software industry and is not, in our view, a sign of fundamental weakness.
The Lawsuit. A securities class-action lawsuit has been filed related to the January ARR miss. While lawsuits of this nature are common following large stock drops and rarely result in material outcomes, they do create an overhang on the stock. Investors should be aware of this risk.
Strategic Moves. Commvault has not been sitting idle. The company acquired Satori Cyber, an AI-focused data security firm, to strengthen its position in the rapidly growing intersection of cybersecurity and AI. It has also announced significant partnerships with CrowdStrike (endpoint security), HPE (infrastructure), and Deloitte (consulting and implementation). These partnerships extend Commvault's reach into new customer segments and reinforce its position as a platform rather than a single-product company.
Forward Guidance. Management has guided for FY2027 revenue of $1.30–$1.31 billion, representing 18–19% subscription ARR growth. If the company meets this guidance, it would mark a second consecutive year of near-20% growth — a trajectory that, in our view, is inconsistent with a stock trading at a 35% discount to its prior peak.
CVLT — COMPETITIVE POSITION
The Cyber Resilience Moat. Data protection is not a "nice to have" — it is a regulatory and operational necessity. Companies that suffer data breaches or ransomware attacks without adequate backup solutions face regulatory fines, reputational damage, and operational paralysis. Commvault's position as a leading provider of enterprise-grade data protection gives it significant switching costs — once an organisation has integrated Commvault's platform into its IT infrastructure, replacing it is expensive, time-consuming, and risky.
AI Tailwinds, Not Headwinds. Every AI deployment generates more data that needs to be protected. Every company investing in AI is simultaneously investing in data infrastructure, security, and resilience. Commvault is positioned to benefit from AI adoption, not be disrupted by it. The Satori Cyber acquisition specifically targets AI data security — suggesting that management sees AI as an opportunity, not a threat.
- 11 —
The Software Snap-Back
Cvlt — Applying Felix's Quality Stock Framework
Is the Business Profitable? Yes. Commvault generated $1.18 billion in revenue and $70.66 million in net income in FY2026. The company is profitable at both the gross and operating level. The 18.9% revenue growth rate suggests the core business is healthy and expanding.
Is It Generating Cash? Commvault has historically been a strong cash generator. The SaaS transition creates a temporary headwind to cash conversion as the company invests in subscription infrastructure, but the long-term trajectory of recurring subscription revenue should improve cash flow predictability over time.
Is It Financially Stable? The company has a manageable balance sheet. With $1.18 billion in revenue and approximately 3,300 employees, the revenue-per-employee metric is healthy. The key risk here is the class-action lawsuit, which introduces some financial uncertainty.
Valuation. At $127.34, with a 35% drawdown from the $195.41 peak, Commvault trades at a significant discount to its prior valuation. The forward guidance of $1.30–$1.31 billion in FY2027 revenue suggests continued growth. We note, however, that valuation is the "least important" metric in Felix's framework — quality and cash generation come first.
Moat. Commvault's competitive moat is built on high switching costs, a broad enterprise customer base, and a deepening integration with cybersecurity platforms (CrowdStrike, HPE). The acquisition of Satori Cyber adds AI-specific capabilities. In Felix's framework, this qualifies as a combination of switching cost moat and technology leadership moat.
EXHIBIT 7: CVLT — FELIX'S QUALITY FRAMEWORK SCORECARD
| Criterion | Assessment | Notes |
|---|---|---|
| Gross Margin | Strong | Software business model with high gross margins typical of the sector |
| Operating Margin | Moderate | Compressed due to SaaS transition investment; expected to improve |
| Revenue Growth | +18.9% YoY | Strong; FY2027 guidance: 18–19% ARR growth |
| Net Income | $70.66M | Profitable; net income declined 7.2% due to transition costs |
| Cash Generation | Solid | Historically strong FCF; monitoring through SaaS transition |
| Financial Stability | Good | $1.18B revenue base; manageable cost structure |
| Moat | Strong | High switching costs, CrowdStrike/HPE/Deloitte partnerships, Satori Cyber acquisition |
| Key Risk | Class-action lawsuit | Securities lawsuit over Jan 2026 ARR miss; common post-drop; monitoring |
Summary on Commvault. Of the three individual stocks examined in this report, Commvault is the highest-quality name. It is profitable, growing at nearly 19% per year, operating in a sector (cyber resilience) that is structurally growing, and trading at a significant discount to its prior peak due to what we believe was an overreaction to a temporary ARR miss. The risks are real — the lawsuit and SaaS transition introduce uncertainty — but the underlying business appears sound.
- 12 —
The Software Snap-Back
Expensify (Exfy) — The Micro-cap Contrarian Play
Company Overview. Expensify is an expense management platform used by millions of individuals and businesses to track expenses, manage corporate cards, and pay bills. Founded in 2008 and headquartered in Portland, Oregon, the company went public in 2021 during the SaaS boom. With approximately 117 employees and a market capitalisation of roughly $126 million, Expensify is a micro-cap company — meaning it is small, thinly traded, and inherently more volatile than larger software companies.
Why Include a Micro-Cap? We include Expensify in this report for a specific reason: in a short-squeeze scenario, the smallest companies with the highest short interest relative to their float tend to move the fastest and the furthest. The mechanics are simple — when there are fewer shares available to trade, forced buying has a disproportionately large impact on the price. Think of it as the difference between throwing a stone into the ocean versus throwing a stone into a puddle. The puddle makes a much bigger splash.
The Damage. Expensify has been devastated. The stock traded as high as $4.02 in December 2024 and hit a low of $0.75 in March 2026 — a decline of more than 81% from peak to trough. It currently trades around $1.31, still down approximately 67% from its December 2024 high. By any measure, this stock has been punished severely.
CURRENT PRICE
- $1.31
- ALL-TIME HIGH (DEC 2024)
- $4.02
- DRAWDOWN FROM PEAK
- −67.4%
- MARKET CAP
~$126M
Exhibit 8: Expensify — Key Financial Metrics
| Metric | Latest Data | Context |
|---|---|---|
| Market Capitalisation | ~$126 million | Micro-cap — inherently higher risk and volatility |
| Revenue Trend | Declining ~6% YoY (Q1 2026) | Top-line pressure; requires monitoring |
| Free Cash Flow (Q1 2026) | $2.5 million | Positive — company is generating cash despite revenue decline |
| Share Buyback | $25M Dutch auction tender offer | Accepted 6.05M shares at $1.20; total cost ~$7.26M |
| Short Interest (% of Float) | ~5.4–6.7% | Elevated relative to micro-cap peers |
| Short Shares | ~3.99 million | Days to cover: ~7.6 — relatively high |
| Employees | ~117 | Lean operation |
| CEO | David Barrett | Founder-led |
The Software Snap-Back
Exfy — What the Numbers Tell US
Revenue Is Declining — But Context Matters. Expensify's revenue declined approximately 6% year-over-year in Q1 2026. For a growth-oriented software company, that is concerning. However, it is important to distinguish between a company in terminal decline and a company navigating a temporary contraction while investing in new capabilities. The decline must be monitored closely, but it has not (yet) turned into a crisis.
Free Cash Flow Is Positive. Despite the revenue decline, Expensify generated $2.5 million in free cash flow in Q1 2026. This is significant. A company generating positive cash flow — even during a downturn — has the financial flexibility to survive difficult periods and invest in future growth. Many companies at this stage burn cash; Expensify does not.
Management Is Buying. Perhaps the most telling signal is the $25 million Dutch auction tender offer that Expensify announced. The company ultimately accepted 6.05 million shares at $1.20 per share, spending approximately $7.26 million. When management spends corporate cash to buy back shares, it is a signal — they believe the stock is undervalued. One must be cautious about reading too much into buybacks, but combined with positive cash flow and a stock down 67%, it is a noteworthy data point.
Embracing AI Rather Than Fearing It. Expensify launched "Expensify MCP" — a technology that allows AI assistants such as ChatGPT and Claude to plug directly into a user's expense data. Rather than being disrupted by AI, Expensify is integrating it into its core product. This is a critical distinction. Companies that adapt to AI — by using it to make their products better — are in a fundamentally different position than companies that ignore it.
The Risks Are Obvious. We must be direct: Expensify is a speculative play. The company has a $126 million market cap, 117 employees, and declining revenue. The stock trades under $2. If the software recovery fails to materialise, or if the revenue decline accelerates, this stock could go to zero. Investors must size any position accordingly — this is not a stock to concentrate a portfolio in.
EXFY — GROWTH STOCK FRAMEWORK APPLICATION
Because Expensify is a smaller, earlier-stage company, we apply Felix's Growth Stock criteria rather than the Quality Stock criteria:
| Growth Criterion | Assessment | Notes |
|---|---|---|
| Operating Margin | Thin | Micro-cap with 117 employees; lean but constrained |
| Revenue Growth | −6% YoY | Declining — does not meet the "strong growth" criterion |
| Debt | Low | Positive FCF; buyback funded from cash reserves |
| Cash Position | Adequate | $2.5M FCF per quarter; enough to sustain operations |
| Target Market (TAM) | Large | Expense management is a multi-billion dollar market |
| Brand | Recognised | Millions of users; well-known in small/mid business segment |
| Tech Leadership | MCP Integration | First-mover in AI-native expense management |
| CEO Invested | Yes — Founder-led | David Barrett is founder and CEO; significant skin in the game |
| 3 Reasons Better Than | ||
| Competitors | ||
| 1) AI integration via MCP (competitors have not matched this); 2) Lean cost structure (117 | ||
| employees); 3) Management buying stock at $1.20 |
The Honest Assessment. Expensify fails the revenue growth criterion in Felix's growth framework — revenue is declining, not growing. However, it scores well on debt, founder involvement, and AI integration. The $25 million buyback programme is a meaningful signal from a founder-led team. In the context of a software sector squeeze, Expensify's micro-cap status, 7.6-day days-to-cover ratio, and beaten-down price create the conditions for outsized moves. This is a high-risk, potentially high-reward play — and investors should treat it as such.
- 14 —

Important Note on Expensify: This is a micro-cap stock trading under $2 with declining revenue and a market capitalisation of ~$126 million. Micro-cap stocks carry significantly higher risk than large-cap stocks, including lower liquidity, wider bid-ask spreads, and the possibility of total loss. Any position in a stock of this size should be sized appropriately relative to your overall portfolio. This report is educational — it is not a recommendation to buy.
First & Only LIVE Training on "How to Turn the IPO Summer into a 5-Year Wealth Machine"
Get your free seat at wealthmachine.org
MARA HOLDINGS (MARA) — THE SQUEEZE CANDIDATE
Company Overview. MARA Holdings — formerly Marathon Digital Holdings, rebranded in August 2024 — began life as one of the largest Bitcoin mining companies in North America. But the company is in the middle of a significant strategic pivot. MARA is transforming itself from a pure-play Bitcoin miner into an integrated energy and AI infrastructure company. This pivot, if successful, would fundamentally change the investment thesis — and it is precisely the kind of narrative shift that can unwind heavily-shorted positions.
The Short Interest Story. MARA has one of the highest short interest ratios of any mid-cap stock in the US market. Approximately 26% of the company's tradeable shares — roughly 98.6 million shares — are being sold short. To put that in context: in a normal market, short interest above 10% is considered elevated. Above 20% is extremely crowded. At 26%, MARA is one of the most heavily shorted stocks in America.
CURRENT PRICE
- $14.64
- ALL-TIME HIGH (FEB 2024)
- $31.03
- SHORT INTEREST (% OF FLOAT)
26.1–26.5%
MARKET CAP
$3.6–5.6B
- 15 —
The Software Snap-Back
Mara — The Strategic Pivot
Exhibit 9: Mara Holdings — Key Data Points
| Metric | Value | Context |
|---|---|---|
| Current Price | $14.64 | Down ~53% from Feb 2024 ATH of $31.03 |
| 52-Week Low | $6.73 (Feb 2026) | Stock has more than doubled off its lows |
| Revenue (TTM) | $867M–$907M | Primarily Bitcoin mining revenue |
| Net Income (Q1 2026) | Loss of $1.3 billion | Driven by Bitcoin mark-to-market revaluations, not operational losses |
| Short Interest | 26.08–26.49% of float | ~98.64 million shares short |
| Days to Cover | ~2.15–2.5 days | Moderate — not extremely high, but combined with % of float, significant |
| Key Acquisition | Long Ridge Energy & Power | ~$1.52 billion; 505 MW gas-fired power plant in Ohio |
| AI Infrastructure | 200 MW HPC buildout | Planned for 2027; pivoting to AI data centre capacity |
| Bondholder Consent | Secured (Jun 2026) | Key hurdle for Long Ridge acquisition cleared |
From Bitcoin Miner to AI Infrastructure. The acquisition of Long Ridge Energy & Power is the centrepiece of MARA's transformation. Long Ridge operates a 505-megawatt gas-fired power plant in Ohio — one of the largest single-site power assets available in the US. The acquisition, valued at approximately $1.52 billion, gives MARA direct ownership of energy generation capacity. This is a strategic move that repositions the company from being a consumer of energy (mining Bitcoin) to being a producer of energy — with the ability to sell that power to the rapidly growing AI data centre market.
Why This Matters. AI data centres are among the fastest-growing consumers of electricity in the world. Companies like Microsoft, Google, and Amazon are spending tens of billions of dollars building AI infrastructure — and all of it requires enormous amounts of power. MARA is positioning itself as a supplier of that power. The 200-megawatt high-performance computing (HPC) buildout planned for 2027 would add AI data centre capacity on top of the energy infrastructure.
The Net Loss in Context. MARA reported a net loss of $1.3 billion in Q1 2026. That number looks alarming — but it requires context. The loss was driven by Bitcoin mark-to-market revaluations under accounting rules that require companies to record unrealised gains and losses on their cryptocurrency holdings. When Bitcoin's price falls during a quarter, companies like MARA must record a paper loss — even though they have not sold any Bitcoin. The operational business continued to generate revenue in the $867–907 million range on a trailing twelve-month basis.
Why the Short Interest Is So High. MARA is heavily shorted for three reasons: (1) it has historically been a pure-play Bitcoin company, and many institutional investors are bearish on cryptocurrency; (2) the net loss headline frightens less sophisticated investors; and (3) the pivot to AI infrastructure is unproven — the market is pricing in a high probability that the strategy will fail.
The Squeeze Mechanics. And this is precisely why MARA is in this report. With 26% of the float sold short and the stock already more than doubling off its February lows (from $6.73 to $14.64), the conditions for forced buying are in place. If any positive catalyst emerges — a Bitcoin rally, a major AI partnership, or simply the successful completion of the Long Ridge acquisition — the short-sellers would face enormous pressure to cover. And when 26% of the float needs to be bought simultaneously, the price impact can be dramatic.
- 16 —
The Software Snap-Back
Mara — Risk Assessment
This Is a High-Risk Stock. We must be explicit: MARA is the most speculative of the three stocks covered in this report. The company is loss-making on a GAAP basis. The strategic pivot is unproven. Bitcoin exposure adds a layer of volatility that is difficult to hedge. The acquisition of Long Ridge Energy carries execution risk. And micro-to-mid-cap stocks with high short interest can move violently in both directions.
Why Include It? MARA is included specifically because the short-squeeze mechanics are most pronounced here. The 26% short interest, combined with the stock's recovery off the February lows, creates the highest-tension rubber band of the three names. If the snap-back thesis plays out, MARA is likely to move the furthest and the fastest — in either direction.
Exhibit 10: Mara — Applying Felix's Framework
| Criterion | Assessment | Notes |
|---|---|---|
| Revenue | $867M–$907M (TTM) | Substantial revenue base from Bitcoin mining operations |
| Profitability | Net Loss ($1.3B Q1) | Driven by BTC mark-to-market; operational cash flow exists |
| Debt / Leverage | Elevated | $1.52B acquisition adds leverage; bondholder consent secured |
| Target Market (TAM) | Very Large | AI data centres + energy infrastructure = massive addressable market |
| Tech Leadership | In transition | Largest US Bitcoin miner; AI infrastructure unproven |
| CEO/Founder Invested | Significant insider ownership | Management executing bold strategic pivot |
| Competitive Moat | Energy asset (505 MW) | Physical power plant creates tangible competitive advantage |
| Short Squeeze Potential | Extreme (26% short) | Highest of the three stocks; most volatile risk/reward profile |
The Bull Case in One Sentence. If Bitcoin rallies, the Long Ridge acquisition closes successfully, and MARA's AI infrastructure pivot gains traction, 26% of the float will need to be bought back by short-sellers — creating the conditions for a potentially explosive move to the upside.
The Bear Case in One Sentence. If Bitcoin declines, the Long Ridge acquisition encounters problems, or the AI pivot fails to gain commercial traction, the stock could revisit its $6.73 lows — or worse.
Position Sizing Is Everything. With a stock this volatile, position sizing matters more than entry price. Professional investors typically allocate only a small fraction of their portfolio to high-conviction, high-risk positions. We are not advising anyone to buy MARA — but for those who understand the risks and want maximum exposure to the short-squeeze thesis, this is where the mechanics are most extreme.
- 17 —
The Software Snap-Back
Applying Felix's "How to Pick Great Stocks" Framework
The Philosophy. Felix Prehn's approach to stock selection can be summarised in one sentence: "We look neither for value stocks, nor for growth stocks. We look for quality stocks." The framework prioritises businesses that are profitable, generating cash, and financially stable — before even considering valuation. This is a deliberately conservative approach that filters out speculation and focuses on fundamental business quality.
Two Tracks. The framework operates on two tracks. For established, profitable companies, Felix applies the "Quality Stock" criteria — profitability, cash generation, financial stability, valuation, and moat. For earlier-stage companies where historical data is limited, he applies the "Growth Stock" criteria — which emphasise operating margin, revenue growth, low debt, large target markets, and founder involvement.
The Software Snap-Back
Quality Stock Criteria — Summary Table
Exhibit 11: Felix's Quality Stock Framework
| Category | Criterion | What It Tells You |
|---|---|---|
| Is the Business Profitable? | Gross Margin | Indicates the size of the moat. Reveals core efficiency and its ability to absorb shocks. |
| ROCE | Reveals the return to all financial stakeholders (equity and debt). Good measure of management effectiveness. | |
| Is It Generating Cash? | ||
| Cash Conversion | Ability to convert profits into cash. Good measure of efficiency and flexibility. | |
| Leveraged FCF Margin | Reveals what portion of sales ends up as cash. |
Is It Financially Stable?
Leverage Measure of financial risk. Tells a story about volatility of returns.
Interest Cover
Degree of financial comfort re: debt. A high ratio suggests financial stability and flexibility.
Valuation
P/E Ratio + Fwd P/E
Short-term valuation snapshot + forward-looking prediction. Least important metric.
Earnings Growth Consistency
Shows whether management and business are reliable or cyclical.
EPS Trend Reveals whether shareholder value is increasing or being diluted.
Moat (Competitive Advantage)
Cost Advantage Can the company produce more cheaply than competitors?
Size Advantage Does the company benefit from economies of scale?
High Switching Cost Is it difficult for customers to leave?
Patents / Brand / Licences
Does the company have unique intellectual property or brand recognition?
- 18 —
The Software Snap-Back
Growth Stock Criteria — Summary Table
Exhibit 12: Felix's Growth Stock Framework
| Criterion | What It Means | Why It Matters |
|---|---|---|
| High Operating Margin | Profitability per unit sold is strong | Ensures the company can survive downturns |
| Strong Revenue Growth | Must beat others in the sector | After all — it is a growth company |
| Low Debt | Minimal financial obligations | |
| Growth companies need flexibility, not debt | ||
| payments | ||
| Good Cash Position | Enough cash to survive a crash | |
| Markets can stay irrational longer than you can stay | ||
| solvent | ||
| Large Target Market (25x+ | ||
| TAM) | ||
| Addressable market at least 25x current | ||
| revenue | ||
| If the market is too small, growth will hit a ceiling | ||
| Strong Clean Brand | Recognisable, trusted brand | Brands create pricing power and customer loyalty |
| Tech Leadership | Leading edge in its category | |
| Technology leaders capture disproportionate market | ||
| share | ||
| High R&D Spend | Investing to build a moat | |
| Today's R&D spend is tomorrow's competitive | ||
| advantage | ||
| CEO/Founder Heavily | ||
| Invested | ||
| Skin in the game | Alignment between management and shareholders | |
| Can You Explain Why It Is | ||
| Better? | ||
| Write down 3 reasons | If you cannot explain it, you do not understand it |
COMPARATIVE SCORECARD — ALL THREE STOCKS
Exhibit 13: Side-by-side Comparison
| Factor | CVLT (Commvault) | EXFY (Expensify) | MARA (MARA Holdings) |
|---|---|---|---|
| Framework Type | Quality Stock | Growth Stock | Growth Stock (Pivot) |
| Revenue | $1.18B (+18.9%) | Declining (~−6%) | $867M–$907M (TTM) |
| Profitability | Profitable ($70.66M NI) | FCF positive ($2.5M/Q) | Net loss (BTC revaluations) |
| Drawdown from Peak | −34.8% | −67.4% | −52.8% |
| Short Interest | ~6.6% | ~5.4–6.7% | 26.1–26.5% |
| Moat | Strong (switching costs) | Moderate (brand, AI) | Emerging (energy asset) |
| Squeeze Potential | Moderate | Moderate–High (micro-cap) | Extreme |
| Risk Level | Moderate | High | Very High |
| Best For | Quality-first investors | Contrarian micro-cap exposure | Squeeze thesis maximalists |
The Spectrum of Risk. These three stocks represent a deliberate spectrum. Commvault is the highest-quality business — profitable, growing, and operating in a structurally essential market. Expensify is the deep-value contrarian play — beaten down but cash-flow positive with an activist management team. MARA is the high-octane squeeze candidate — the most volatile, the most heavily shorted, and the most dependent on external catalysts (Bitcoin, AI pivot, acquisition execution).
No Single "Right" Choice. The appropriate choice depends entirely on an individual investor's risk tolerance, portfolio size, and time horizon. A conservative investor might choose only IGV. A moderate investor might combine IGV with a position in Commvault. An aggressive investor might add small positions in Expensify or MARA. We emphasise: this is educational commentary, not investment advice.
- 19 —
The Software Snap-Back
Risk Factors
Investors considering any of the positions discussed in this report should be aware of the following risks. This is not an exhaustive list.
- The AI Disruption Thesis May Be Correct. The most fundamental risk is that the hedge funds are right. If AI genuinely replaces significant portions of traditional software functionality, the sector could decline further — and the companies covered in this report could lose revenue permanently. While we believe the narrative is overblown, we cannot rule out this possibility.
- The Squeeze May Not Happen. Short interest can remain elevated for extended periods without triggering forced buying. Short-sellers may gradually reduce their positions over months or years rather than being forced to cover all at once. The "snap-back" is not guaranteed — it is a probability, not a certainty.
- Macro Risk. A broader market downturn — triggered by recession, geopolitical events, or monetary policy changes — would likely drag software stocks down further regardless of sector-specific dynamics. Beaten-down sectors often fall further in bear markets before they recover.
- Individual Stock Risk. Each of the three companies faces idiosyncratic risks: CVLT has a securities class-action lawsuit; EXFY has declining revenue and micro-cap liquidity risk; MARA has Bitcoin exposure and acquisition execution risk. Any of these could result in significant losses independent of the broader sector thesis.
- Timing Risk. Even if the thesis is correct, the timing is uncertain. Recovery could take weeks, months, or quarters. Investors who are overleveraged or need liquidity in the short term may be forced to sell at a loss before the recovery materialises.
- Liquidity Risk. Expensify in particular is a micro-cap with thin trading volume. Wide bid-ask spreads can result in poor execution prices, and it may be difficult to exit a position quickly during periods of stress.
| Risk Factor | Severity | Mitigation |
|---|---|---|
| AI disruption thesis proves correct | HIGH | Diversify via IGV; monitor earnings for revenue declines |
| Short squeeze does not materialise | MEDIUM | Focus on companies with strong fundamentals (CVLT) |
| Broader market downturn | HIGH | Position sizing; maintain diversified portfolio |
| CVLT class-action lawsuit | MEDIUM | Monitor legal proceedings; size position accordingly |
| EXFY revenue decline accelerates | HIGH | Monitor quarterly earnings closely; small position only |
| MARA acquisition execution risk | MEDIUM | Bondholder consent secured (Jun 2026); monitor closing |
| MARA Bitcoin price exposure | HIGH | Understand that BTC volatility = MARA volatility |
| Timing — recovery takes longer than expected | MEDIUM | Do not use leverage; invest only what you can afford to hold |
- 20 —

The Software Snap-Back
Opportunities & Catalysts
- Earnings Season Surprises. If major software companies report better-than-expected earnings — particularly on subscription growth and AI integration — it could trigger a rapid re-rating of the entire sector. One strong quarter from a bellwether like Microsoft or Oracle could change the narrative overnight.
- AI Integration, Not AI Replacement. The emerging evidence suggests that successful software companies are integrating AI into their products rather than being replaced by it. Microsoft's Copilot, Expensify's MCP, and Commvault's AI- powered data security are all examples. If this trend continues, the "AI kills software" narrative weakens — and short-sellers lose their thesis.
- The Thoma Bravo Signal. When a $130+ billion private equity firm declares the SaaSpocalypse "over" (June 9, 2026), it carries weight. Thoma Bravo is one of the largest acquirers of software companies globally. Their statement signals that institutional capital may be preparing to flow back into the sector.
- Short-Covering Dynamics. With $24 billion in short profits already banked, some hedge funds may begin to take profits and close their positions. This buying pressure, even if gradual, provides a floor under software stock prices and reduces the supply of sellers.
- Enterprise Spending Resilience. Companies have not cancelled their software subscriptions. Nobody has stopped using Microsoft Office because ChatGPT exists. The fundamental demand for enterprise software remains intact — suggesting that the sell-off was driven by fear rather than by actual revenue losses at scale.
- The IPO Pipeline. A recovery in the software sector would likely coincide with a reopening of the IPO market, bringing new investment opportunities and renewed enthusiasm for technology stocks. Historically, these cycles have lasted multiple years and created significant wealth for early participants.
THE QUICK BULL CASE — SUMMARY
| Stock / ETF | One-Sentence Bull Case |
|---|---|
| IGV | Diversified software exposure at a 21% discount to peak; safest way to play the recovery |
| CVLT | Profitable cyber-resilience leader with 19% revenue growth, punished by a one-time ARR miss |
| EXFY | Founder-led micro-cap with positive FCF, aggressive buyback, and AI integration — beaten to almost nothing |
| MARA | 26% short interest, pivoting from Bitcoin to AI infrastructure — the highest-tension rubber band in the market |
First & Only LIVE Training on "How to Turn the IPO Summer into a 5-Year Wealth Machine"
Get your free seat at wealthmachine.org
- 21 —