
The Reset Playbook
How to position a portfolio through a geopolitical shock — a calm, three-phase framework and the five “tilts” that follow the money instead of chasing the headline.
Felix Nikolas Prehn · 17 July 2026 · 25 pages
Bottom line
Geopolitical shocks feel chaotic, but historically they follow a repeatable rhythm — SHOCK, REPRICING, ROTATION. The winning move is not to predict the next headline; it is to understand where money tends to travel and to TILT a portfolio toward probability rather than gamble on an outcome. In this report we lay out the three-phase framework, explain why the current backdrop is tangled up with a slow-motion government-debt “reset,” and detail five practical tilts — energy infrastructure, defense, gold & silver, quality/pricing-power companies, and an honest look at the likely losers. For each tilt we highlight sector and industry ETFs as a lower-risk way to gain exposure, with quality scores and cost data drawn from the Winston app. We do not issue buy or sell ratings, price targets, or technical analysis. This is an educational map, not a set of instructions. investments involve risk, including the loss of principal. This report is FTC compliant. Past performance is not indicative of future results. Nothing in this document should be interpreted as a personalized recommendation. Figures are snapshots as of the publication date and will change. Always do your own research and, where appropriate, consult a qualified financial professional before making any investment decision. The Reset Playbook • Report published: July 20, 2026
Overview
14. Sources & Citations
Where the numbers come from
The Reset Playbook • Report published: July 20, 2026
1. HOW TO READ THIS REPORT
Written to be understood. Our goal is that a curious ten-year-old could follow the logic here, while a seasoned investor still finds it useful. Where we use a piece of jargon, we explain it in plain words the first time, and we collect every term in a glossary near the back. If you ever feel lost, skip to Section 12 and come back.
What this report is. It is an educational map of how markets tend to behave when a geopolitical shock hits — a war scare, an attack on a shipping lane, a sudden spike in the oil price — and a calm, repeatable way to think about positioning through it. It is the written companion to the The Prehn Institute video briefing, covering everything discussed there, plus additional context and data.
What this report is not. It contains no buy or sell ratings, no price targets, and no technical analysis (the study of price charts and patterns). We will not tell you what to do with your money. We describe probabilities and trade-offs so that you can make your own informed decisions.
Where the numbers come from. Every stock, ETF and market figure is sourced from the Winston research app at
2. THE BIG PICTURE: WHY SHOCKS FEEL LIKE
CHAOS
The problem with headlines. When conflict erupts, the news moves faster than anyone can think. Prices lurch. Commentators shout. It feels like the only choices are to panic-sell everything or to gamble on a dramatic prediction. Both are usually mistakes.
The pattern underneath. Step back far enough and the chaos resolves into a rhythm. Markets have processed shocks many times before — wars, oil embargoes, terror events, banking scares — and the sequence rhymes. Understanding that sequence is the difference between reacting emotionally and responding calmly.
A useful base rate. History offers a rough anchor: across a wide range of geopolitical events, broad stock markets have often dipped in the region of a few to several percent and then recovered within roughly a month — not always, and never on a fixed schedule, but often enough that panic-selling into the first drop has tended to be the wrong instinct. We treat this as context, not a promise. The point is simple: a shock is a process, not a single moment.
“Follow the river. Don't try to predict the weather.”
You cannot reliably forecast the next headline. You can understand where money tends to flow once a shock is underway — and position toward that probability. That single shift in mindset is what the rest of this report is built on.
The Reset Playbook • Report published: July 20, 2026
3. THE THREE-PHASE FRAMEWORK
Every shock we have studied tends to move through the same three phases. Naming them in advance keeps you calm when they arrive, because you know roughly what comes next.
PHASE ONE
The Shock
This phase is fast and emotional. Selling is a mix of frightened humans and automated computer programs that dump risk the instant volatility spikes. Anything perceived as risky gets hit first
- high-growth technology, speculative themes, quantum and AI names, unprofitable stories. Oil often jumps on fears about supply. Even the things you expect to rise can wobble first: gold has, at times, dipped roughly a percent and a half in the opening hours as panicked investors sell whatever they can to raise cash
- a head-fake, not a verdict.
The rule: don't chase the spike, and don't panic-sell the dip. The first move is often the fake-out.
PHASE TWO
The Repricing
Within days, the initial panic fades and the market starts asking a colder question: does this actually change anything? Does the shock push inflation higher? Does it change what central banks will do with interest rates? Does it disrupt the physical supply of goods and energy? This is where the emotional price of Phase One gets corrected up or down to reflect reality. Institutions do not panic here — they calmly reposition.
PHASE THREE
The Rotation
Now money travels. It leaves the sectors that are newly disadvantaged and flows into the ones that benefit — from, say, rate-sensitive sectors toward energy, defense and real assets. This is the phase that lasts longest and offers the most opportunity to the patient. You do not need to catch the exact bottom; you need to recognise the direction of the river and let it carry you.
Why the order matters. Most retail investors act hardest during Phase One, when emotion is highest and information is worst. Professionals do their most important work in Phases Two and Three, when the picture is clearer. Simply knowing which phase you are in is a genuine edge.
The Reset Playbook • Report published: July 20, 2026
The three phases at a glance
| Phase | What is happening | What most people do | The calmer approach |
|---|---|---|---|
| 1. Shock | Fast, emotional selling by humans and algorithms. Risky assets fall first; oil spikes; even gold can dip briefly. | Panic-sell into the drop or chase the oil spike at the top. | Do nothing rash. Recognise the first move is often a head-fake. |
| 2. | |||
| Repricing | |||
| Panic fades. Market asks whether the shock truly changes | |||
| inflation, rates or supply. | |||
| Freeze, or flip-flop with each | |||
| headline. | |||
| Reassess calmly. Decide what has | |||
| genuinely changed and what has not. | |||
| 3. Rotation | Money flows out of disadvantaged sectors into beneficiaries | ||
| over weeks and months. | |||
| Arrive late, after the move is well | |||
| underway. | |||
| Follow the direction of the flow; tilt toward | |||
| probability, not prediction. | |||
| Framework as described in the The Prehn Institute video briefing. Illustrative; not a forecast of any specific event. |
A word on volatility. A common shorthand for market fear is the VIX index, sometimes called the market's “fear gauge.” When it climbs above 20, it signals that traders expect bigger swings ahead. A rising VIX is precisely the environment in which automated selling accelerates — and precisely when a written plan, made in advance, is most valuable.
The takeaway. The framework does not tell you the future. It tells you which questions to ask, in which order, so that you are never simply reacting. With that scaffolding in place, we can turn to why the current backdrop is unusual.
The Reset Playbook • Report published: July 20, 2026
4. WHY THIS SHOCK IS DIFFERENT: THE RESET
LINK
A chain of dominoes. A geopolitical shock rarely stays in its lane. Follow the chain: conflict raises fears about oil supply → the oil price rises → higher energy costs push inflation up → higher inflation makes it hard for central banks to cut interest rates → rates stay “higher for longer.” That last link is the one that quietly matters most, because higher-for-longer rates do something specific to government debt.
The uncomfortable backdrop. Major governments, the United States chief among them, carry enormous debts. There are really only a few ways to deal with a mountain of debt: pay it back (politically painful), default (unthinkable for a reserve currency), or
- the historically favoured route — let inflation and growth quietly shrink the debt's real weight over time. That last route is the “reset,” and today's conflict-driven inflation feeds directly into it.
The three-move machine
Move one: keep inflation warm. Conflict and firm oil prices help keep inflation from falling all the way back to target. A little persistent inflation is inconvenient for households but useful for a heavily indebted government, because it erodes the real value of fixed debts.
Move two: manufacture a new buyer for the debt. Someone has to buy all the government bonds a government issues. New regulation around dollar-backed digital tokens (“stablecoins”) effectively requires those tokens to be backed by safe assets — in practice, US government debt. That turns a fast-growing part of the crypto economy into a captive, structural buyer of Treasuries. One large stablecoin issuer is already reported to rank among the top- twenty holders of US government debt.
Move three: let the currency drift. With inflation warm and a reliable buyer in place, a government can allow its currency to slowly lose purchasing power while the economy grows around the debt. The debt does not get “paid off” so much as outgrown and inflated away.
Why the accelerant matters. An active conflict — and the risk premium it puts on energy — is the accelerant that keeps move one running. That is why a war scare on the other side of the world can ripple into your bond, cash and dividend holdings at home.
The Reset Playbook • Report published: July 20, 2026
The reset chain, link by link
| Link | What happens | Why it matters to you |
|---|---|---|
| 1. Conflict | Fears over energy supply routes rise. | Oil risk premium appears almost immediately. |
| 2. Oil up | Energy prices climb. | Feeds directly into the cost of almost everything. |
| 3. Inflation warm | Higher energy costs keep inflation elevated. | Erodes the real value of cash and fixed income. |
| 4. Rates higher-for-longer | Central banks struggle to cut. | Squeezes rate-sensitive sectors (see Tilt 5). |
| 5. Debt inflated away | Real debt burden shrinks vs a growing economy. | Favours real assets over paper money over time. |
| Mechanism as described in the The Prehn Institute video briefing. Educational illustration, not a prediction of magnitude or timing. |
The investor's conclusion. If the long-run policy tilt favours warm inflation and a gently weakening currency, then real assets — energy, hard commodities, gold and silver, and companies with genuine pricing power — become more attractive relative to cash and long-dated bonds. That single insight organises the five tilts later in this report.
A caution against certainty. None of this is guaranteed, and timing is genuinely unknowable. Policy can change; conflicts can de-escalate; inflation can surprise to the downside. We are describing a probability tilt, not a prophecy. The right response is to lean gently in a direction, sized so that being wrong is survivable — the exact opposite of an all-in bet.
The Reset Playbook • Report published: July 20, 2026
5. A LESSON FROM HISTORY: HOW DEBT
SHRANK AFTER WWII
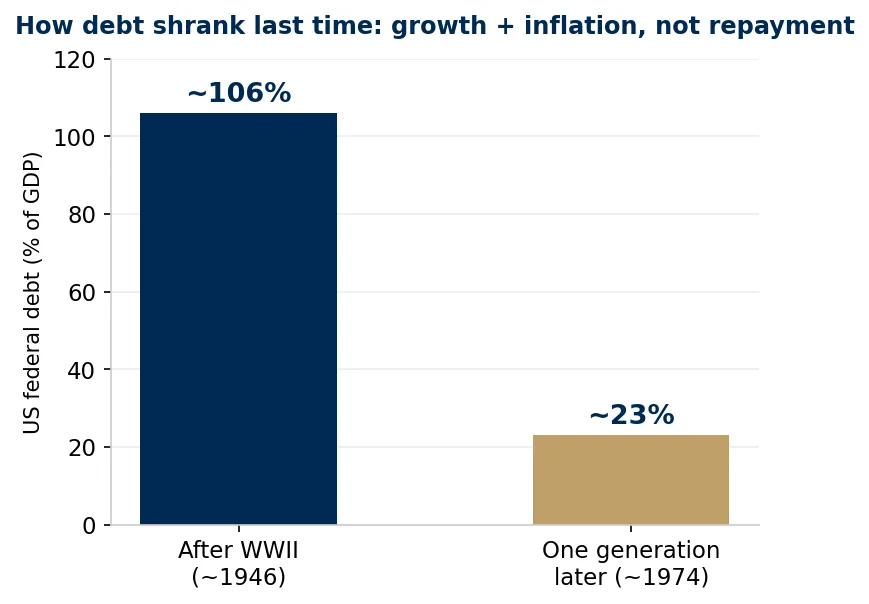
We have seen this movie. After the Second World War, US government debt stood at roughly 106% of the size of the entire economy — a genuinely alarming level. Yet within about one generation, that ratio fell to roughly 23%. The remarkable part is how.
Not by paying it back. The debt was not dramatically repaid. Instead, policymakers kept interest rates low while allowing inflation to run warm, and the economy grew steadily. Economists call this combination “financial repression.” In plain English: the debt stayed roughly the same in dollar terms while the economy and prices grew around it, so the debt's relative weight melted away.
Why it rhymes today. The same toolkit — warm inflation, growth, and rates held below the rate of inflation for long stretches — is exactly what a heavily indebted government would reach for again. That is why the WWII episode is not a history lesson so much as a preview of the mechanism.
What it means for savers. Financial repression is quietly costly for anyone holding lots of cash or long-dated bonds, because their money loses purchasing power faster than it earns interest. It tends to reward owners of productive assets and real things. Again: this argues for a tilt toward real assets and quality businesses, not a panic out of everything else.
The Reset Playbook • Report published: July 20, 2026
6. TILT, DON'T GAMBLE: THE FIVE TILTS
The core idea. A gamble is a large, concentrated bet on a single outcome — “there will be a war,” “oil will hit some number.” A tilt is a modest lean toward the outcomes that history and logic say are more probable, sized so that no single call can wreck you. Tilting keeps you invested and calm; gambling makes you a hostage to the next headline.
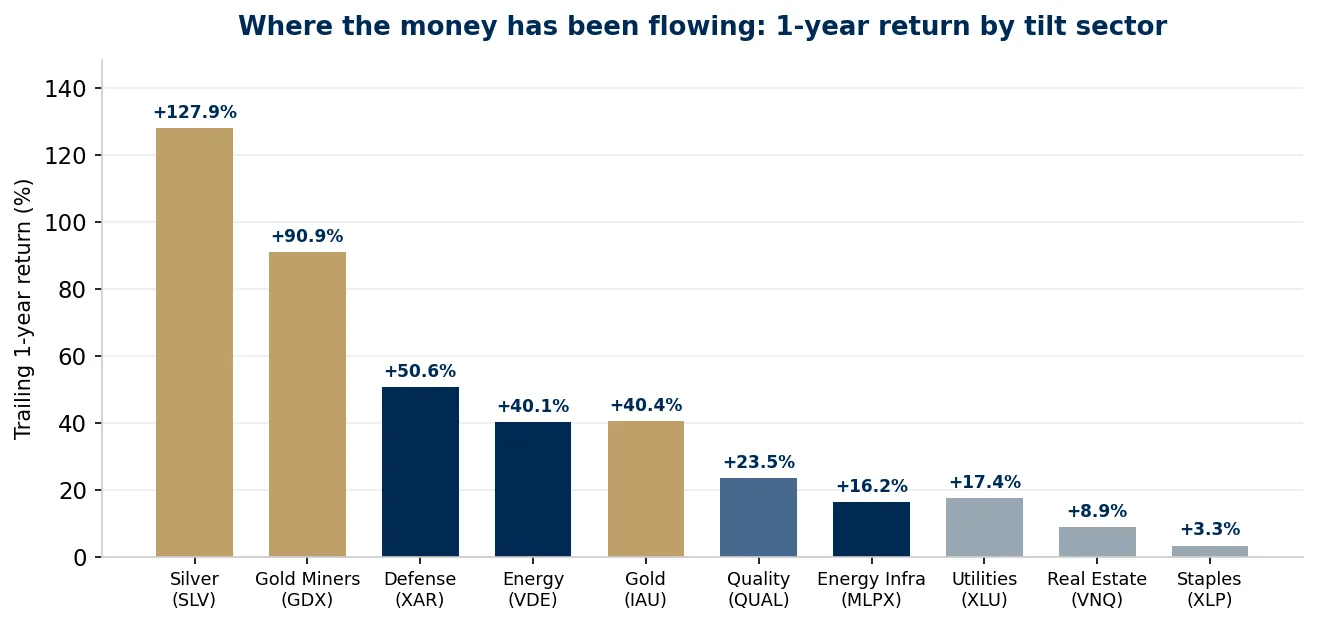
Lower-risk exposure through ETFs. For most people, the calmer way to express a tilt is not to hand-pick one stock but to own a basket — a sector or industry ETF (exchange-traded fund). A single company can stumble on its own; a well-constructed basket spreads that risk. For each tilt below we highlight representative ETFs, with quality scores, costs and trailing returns drawn from the Winston app, purely as lower-risk ways to study the exposure. These are illustrations for education, not recommendations.
How to read the ETF tables. “Expense ratio” is the annual fee, as a percentage — lower is cheaper. “Winston Score” is the app's 0– 100 quality gauge — higher suggests stronger fundamentals. “1Y / 3Y / 5Y return” are trailing total returns as recorded by the Winston app; past performance is not indicative of future results.
The one-sentence version. Don't bet on the war — tilt toward the probabilities, keep a calm core, and size every position so that being wrong is merely annoying, never catastrophic.
The Reset Playbook • Report published: July 20, 2026
ENERGY: BUY THE SHOVELS, NOT THE BARREL
The historical case. Analysis of roughly ninety years of geopolitical shocks has found that oil has often been the single best-performing asset in the months immediately following an event — rising by a median of around 18% in the first three months. But the same history carries a warning: that outperformance has tended to fade by around the six-month mark. In other words, the energy tilt has usually been a window, not a permanent state — which is why an exit plan matters.
The calmer way to play it. Chasing the barrel — buying oil itself at the top of a panic spike — is stressful and easy to get wrong. A steadier approach is to own the “toll collectors”: the pipelines, storage and energy-infrastructure businesses that earn fees as energy moves through the system, somewhat regardless of the exact daily price. They are the shovels in a gold rush — less thrilling than the barrel, but often more durable.
Lower-risk exposure to study
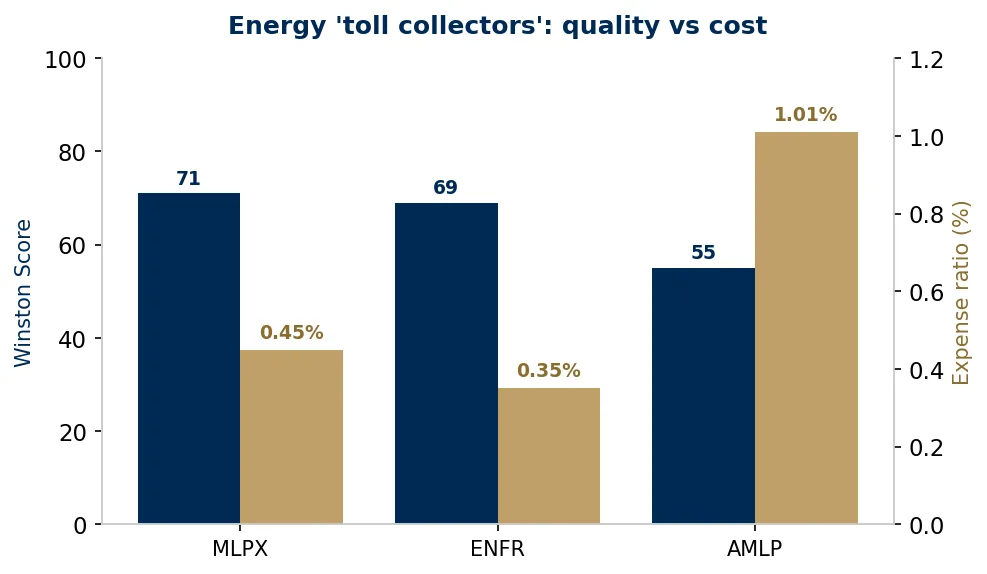
Below are representative energy-infrastructure and broad-energy ETFs from the Winston app. The infrastructure names (MLPX, ENFR) are the “toll collector” expression; the broad names (XLE, VDE) capture the wider sector.
Energy — representative ETFs for lower-risk exposure
| Ticker | Fund | Type | Expense ratio | Winston Score | 1Y | 3Y | 5Y |
|---|---|---|---|---|---|---|---|
| MLPX | Global X MLP & Energy Infrastructure | Toll collector | 0.45% | 71 | +16.2% | +77.8% | +118.6% |
| ENFR | Alerian Energy Infrastructure | Toll collector | 0.35% | +16.8% | +75.0% | +106.7% | |
| AMLP | Alerian MLP | Toll collector | 1.01% | +4.9% | +32.8% | +60.4% | |
| XLE | Energy Select Sector SPDR | Broad energy | 0.08% | +37.1% | +35.7% | +134.8% | |
| VDE | Vanguard Energy | Broad energy | 0.09% | +40.1% | +40.5% | +140.9% | |
| Source: Winston by The Prehn Institute (app.goatacademy.org). Snapshot as of publication. Past performance is not indicative of future results. |
The Reset Playbook • Report published: July 20, 2026
OPPORTUNITIES Energy has historically led in the months after a shock. Infrastructure “toll collectors” earn fees across the cycle, cushioning price swings. Broad ETFs like VDE and XLE combine low fees with high Winston Scores. Fits the reset thesis: real assets over paper money.
RISKS The post-shock oil window has historically faded by ~6 months — have an exit plan. Energy is cyclical and can fall hard if conflict de-escalates. Some MLP-based funds (e.g. AMLP) carry higher fees and structural quirks. Concentrated sector exposure; not a substitute for a diversified core.
Winston's read. Within this group, the broad Vanguard and SPDR energy funds pair very low fees with strong Winston Scores, while the infrastructure names offer the steadier “toll collector” profile at a modest cost. The higher fee on AMLP is the kind of detail the Winston app surfaces automatically. As always, the tilt is a window to be managed, not a position to marry.
The Reset Playbook • Report published: July 20, 2026
DEFENSE: THE STRUCTURAL WAVE, NOT THE SPIKE
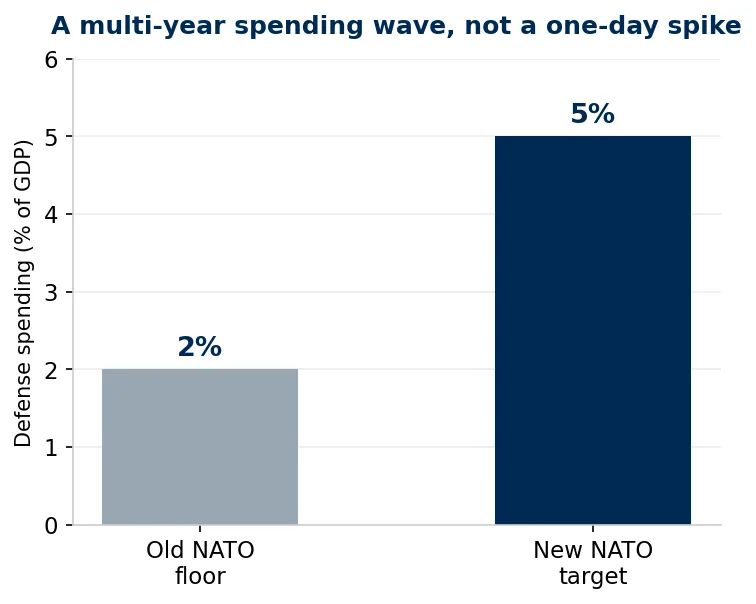
Why this one is different. Defense is not primarily a short-term shock trade; it is a multi-year, structural change in government spending. Members of the NATO alliance have signalled a move to lift defense budgets from a long-standing floor of around 2% of GDP toward roughly 5% over the coming years. That is a slow, powerful wave of committed spending — the kind that rewards patience rather than quick reflexes.
Where the money flows. Increasingly, defense budgets are pointed at modern systems: drones, unmanned platforms and AI- enabled equipment, alongside traditional aerospace and hardware. Because it is hard to know in advance which individual contractor wins which contract, spreading exposure across many names — via an ETF — is the lower-risk way to participate in the theme.
A note on the leveraged option. One fund below, DFEN, uses leverage to aim for three times the daily move of a defense index. Leverage cuts both ways and is designed for short holding periods; we flag it as high-risk and specifically not a lower-risk way to gain exposure. It is included only for completeness and contrast.
Defense — representative ETFs for exposure
| Ticker | Fund | Type | Expense ratio | Winston Score | 1Y return |
|---|---|---|---|---|---|
| ITA | iShares U.S. Aerospace & Defense | Diversified | 0.38% | 73 | +38.6% |
| PPA | Invesco Aerospace & Defense | Diversified | 0.58% | +37.8% | |
| XAR | SPDR S&P Aerospace & Defense | Equal-weight | 0.35% | +50.6% | |
| DFEN | Direxion Daily Aero & Defense Bull 3x | Leveraged — high risk | 0.96% | +96.7% | |
| Source: Winston by The Prehn Institute (app.goatacademy.org). DFEN is a leveraged product flagged as high-risk and unsuitable as lower-risk exposure. Past performance is not indicative of | |||||
| future results. |
OPPORTUNITIES Multi-year, government-committed spending wave — structural, not a one-day spike. Diversified ETFs (ITA, XAR, PPA) spread single-contractor risk. Exposure to fast-growing drone and unmanned-systems demand.
RISKS Budgets depend on politics and can be delayed or trimmed. Valuations can run ahead of actual contract awards. Leveraged products like DFEN can lose value rapidly — avoid for core exposure.
The Reset Playbook • Report published: July 20, 2026
GOLD & SILVER: THE LONGER GAME
Why now, structurally. Central banks have been accumulating gold at the fastest pace in decades. When the institutions that manage national reserves are steady buyers, it reflects a long-run desire to hold something that no single government can print. That is a multi-year backdrop, not a one-week trade.
The head-fake, revisited. Recall from Phase One that gold can actually dip in the opening hours of a shock, as panicked investors sell whatever they can to raise cash. History suggests that initial dip has often been a head-fake, with gold then tending to run higher in the following months. The lesson is to think in years and accumulate into weakness, rather than chase strength.
Gold, silver and the miners. There are three broad ways to gain exposure: physical-backed gold funds (the steadiest), physical- backed silver (more volatile, with an industrial demand angle), and the mining companies (which can move more than the metal itself, in both directions). The Winston app scores all three families so you can compare quality and cost side by side.
Gold & silver — representative ETFs for exposure
| Ticker | Fund | Type | Expense ratio | Winston Score | 1Y | 3Y |
|---|---|---|---|---|---|---|
| IAU | iShares Gold Trust | Physical gold | 0.25% | 68 | +40.4% | +135.5% |
| SGOL | abrdn Physical Gold Shares | Physical gold | 0.17% | +40.5% | +136.2% | |
| GLD | SPDR Gold Shares | Physical gold | 0.40% | +40.2% | +134.5% | |
| SLV | iShares Silver Trust | Physical silver | 0.50% | +127.9% | +200.5% | |
| GDX | VanEck Gold Miners | Gold miners | 0.51% | +90.9% | +178.7% | |
| GDXJ | VanEck Junior Gold Miners | Junior miners | 0.52% | +101.0% | — | |
| SIL | Global X Silver Miners | Silver miners | 0.65% | +133.3% | — | |
| SLVP | iShares MSCI Global Silver Miners | Silver miners | 0.39% | +144.3% | — | |
| Source: Winston by The Prehn Institute (app.goatacademy.org). Snapshot as of publication. Miners are more volatile than the underlying metal. Past performance is not indicative of future | ||||||
| results. |
The Reset Playbook • Report published: July 20, 2026
Central-bank buying provides a multi-year structural bid. Fits the reset thesis: a store of value no government can print. Physical-gold funds (SGOL, IAU) offer low-cost, steady exposure. Silver adds an industrial-demand angle for those who accept more volatility.
Gold can dip first in a shock — the Phase One head-fake. Miners can fall much harder than the metal in a downturn. No income: gold and silver pay no dividend or interest. Silver is notably more volatile than gold.
Winston's read. For steady, lower-cost exposure to the metal itself, the physical-gold funds screen well — SGOL in particular pairs the lowest fee in the group with the highest Winston Score. The miners and silver names have posted far larger trailing returns, but that same sensitivity works in reverse during selloffs, which is why they belong in the “accept more volatility” bucket. The disciplined approach here is patience: accumulate into weakness and measure this tilt in years.
A tool worth knowing. The Winston app's Metals Intel view tracks signals such as the gold-to-silver ratio (how many ounces of silver equal one ounce of gold) and COMEX inventory levels — the sort of context that helps you decide which metal, and when to add, rather than reacting to a single day's headline.
The Reset Playbook • Report published: July 20, 2026
QUALITY & PRICING POWER AS YOUR CORE
The anchor of the portfolio. The first three tilts are satellites around a calm core. That core should be built from quality companies — businesses with a real competitive advantage, or “moat.” In an inflationary, higher-for-longer world, the single most valuable trait is pricing power: the ability to raise prices without losing customers. A company that can pass rising costs on to buyers protects its profit margins; one that cannot gets squeezed.
Pricing power has a ceiling. Even famous brands have limits. A well-known snacks-and-drinks company, for example, raised prices sharply after the pandemic and its margins held up impressively for a time — strong evidence of a moat. But by 2026 it had to cut some prices, reportedly by as much as 15% on certain popular snack lines, as shoppers finally pushed back. The lesson is not that the moat vanished; it is that every moat has a ceiling, and part of the analyst's job is to judge how close a company is to it. We use this only as an illustration of the principle, not as a view on any single stock.
How to find real pricing power. This is exactly what Felix's quality checklist (Section 7) is designed to reveal — strong and stable gross margins, healthy cash conversion, sensible debt, and a durable competitive edge. For lower-risk exposure to the style of quality and pricing power, the ETFs below screen for these traits at the index level.
Quality & pricing power — representative ETFs
| Ticker | Fund | Focus | Expense ratio | Winston Score | 1Y | 3Y |
|---|---|---|---|---|---|---|
| QUAL | iShares MSCI USA Quality Factor | High-quality large caps | 0.15% | 82 | +23.5% | +66.1% |
| MOAT | VanEck Morningstar Wide Moat | Durable competitive advantage | 0.46% | +18.4% | +36.6% | |
| VDC | Vanguard Consumer Staples | Defensive pricing power | 0.09% | +5.3% | +14.9% | |
| XLP | Consumer Staples Select SPDR | Defensive pricing power | 0.08% | +3.3% | +8.0% | |
| Source: Winston by The Prehn Institute (app.goatacademy.org). Snapshot as of publication. Past performance is not indicative of future results. |
The Reset Playbook • Report published: July 20, 2026
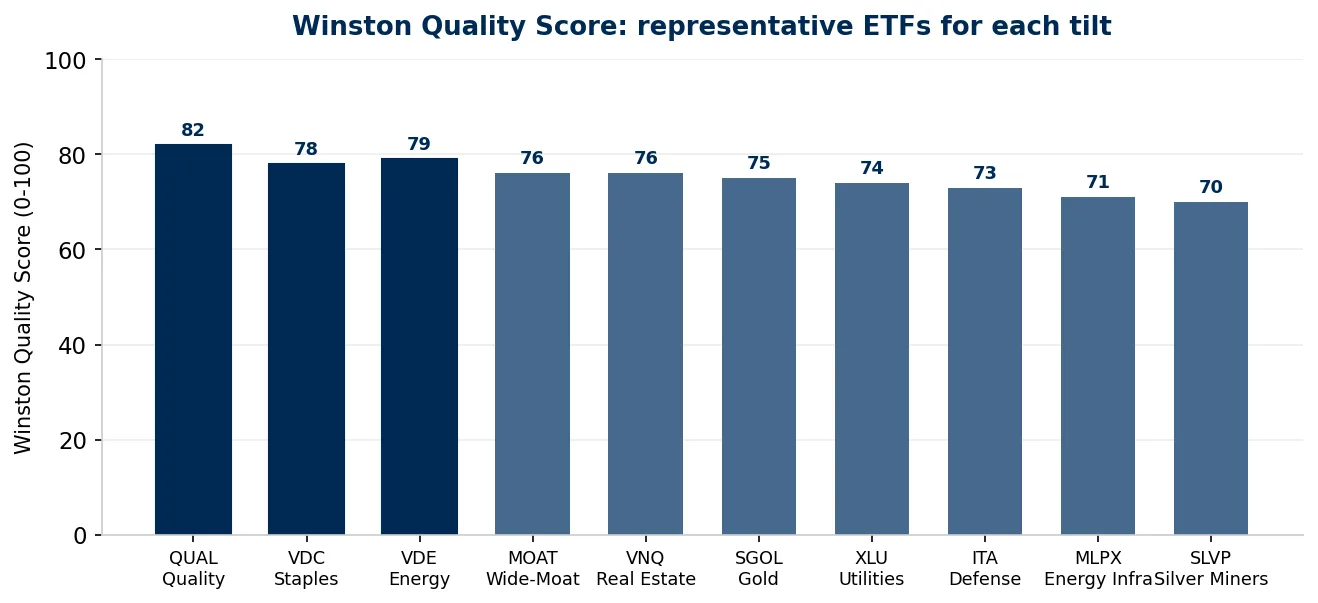
OPPORTUNITIES Quality and wide-moat baskets earn the highest Winston Scores in this report. Pricing power protects margins when inflation stays warm. QUAL pairs a very low fee with a top-of-group score of 82. A calm core lets you hold the satellite tilts with less stress.
RISKS Even strong moats have a ceiling — pricing power can be exhausted. Quality can lag in a fast, speculative rally. Staples grow slowly; they trade steadiness for excitement. “Quality” labels vary by index — read what each fund actually holds.
Winston's read. The quality and wide-moat factor funds are, unsurprisingly, where the highest Winston Scores cluster — QUAL leads the entire report at 82. This is the tilt we would treat as the foundation rather than the flourish: it is the part of the portfolio designed to compound quietly while the satellite tilts do their more cyclical work. The right way to use the snacks-company example is as a reminder to keep checking that the moat is intact, using the checklist that follows.
The Reset Playbook • Report published: July 20, 2026
KNOW THE LOSERS
Winning by avoiding. A good map shows the swamps as well as the roads. If the reset thesis is right and rates stay “higher for longer,” the sectors most likely to struggle are the rate-sensitive ones — chiefly utilities and real estate. Recognising them is not about shorting; it is about not being overweight the areas that face the strongest headwind.
Why these two get squeezed from both sides. Utilities and real estate typically borrow heavily to build and operate, so higher interest rates raise their costs. At the same time, investors often own them for their dividends — and when safe bonds and cash pay more, those dividends look less attractive by comparison, which can pressure their prices. Squeezed on costs and on relative appeal at once, they are the classic “higher for longer” casualties.
An honest caveat on the numbers. Trailing returns for these sectors are not uniformly negative — the Winston app shows positive one-year figures for some. We are not claiming they have already fallen; we are identifying them as the most vulnerable if rates stay high, and as the areas to size carefully. Past performance is not indicative of future results.
Rate-sensitive sectors — handle with care
| Ticker | Fund | Sector | Expense ratio | Winston Score | 1Y | Dividend yield |
|---|---|---|---|---|---|---|
| XLU | Utilities Select Sector SPDR | Utilities | 0.08% | 74 | +17.4% | 2.65% |
| VNQ | Vanguard Real Estate | Real estate | 0.13% | +8.9% | 3.59% | |
| XLRE | Real Estate Select Sector SPDR | Real estate | 0.08% | +7.5% | — | |
| Source: Winston by The Prehn Institute (app.goatacademy.org). Identified as the sectors most vulnerable to a “higher for longer” rate environment, not as a directional call. Past performance | ||||||
| is not indicative of future results. |
The balanced view. These are real businesses that provide essential services, and a well-run utility or property company can still be a fine long-term holding. The point of Tilt 5 is simply relative: in the specific world the reset thesis describes, they face a headwind that energy, defense and real assets do not. Weight accordingly.
The Reset Playbook • Report published: July 20, 2026
Felix's Framework
7. How Felix Picks Great Stocks
IS THE BUSINESS PROFITABLE?
Gross Margin Indicates the size of the moat. Reveals core efficiency and its ability to absorb shocks.
Operating Margin Reveals profitability after all operational costs. A good measure of cost control.
ROCE Reveals the return to all financial stakeholders (equity and debt). A good measure of management effectiveness.
IS IT GENERATING CASH?
Cash conversion Ability to convert profits into cash. A good measure of efficiency and flexibility.
| Leveraged Free Cash Flow Margin | Reveals what portion of sales ends up as cash. |
|---|---|
| IS IT FINANCIALLY STABLE? | |
| Leverage | A measure of financial risk. Tells a story about the volatility of returns. |
| Interest cover | Degree of financial comfort regarding debt. A high ratio suggests financial stability and flexibility. |
| VALUATION | |
| P/E Ratio + Fwd P/E Ratio | Short-term valuation snapshot plus a forward-looking prediction. This is the least important of our metrics. |
| Is earnings growth consistent? | Shows whether management and the business are reliable or cyclical. |
| Are EPS increasing consistently? | Reveals whether shareholder value is increasing or being diluted. |
| MOAT — AKA COMPETITIVE ADVANTAGE. A UNIQUE EDGE OVER COMPETITORS, IN THE FOLLOWING FORMS: | |
| Cost advantage | The ability to produce more cheaply than rivals. |
| Size advantage | Economies of scale that smaller competitors cannot match. |
| High switching cost | Customers find it painful or expensive to leave. |
| Patents, brand, licenses | Legal or brand protections that keep competitors out. |
The Reset Playbook • Report published: July 20, 2026
Felix's Framework
8. Rules for Growth Stocks
| ADDITIONAL CRITERIA FOR GROWTH STOCKS | |
|---|---|
| Same valuation method applies | The quality lens still holds — growth is not an excuse to ignore the fundamentals. |
| Longer time horizon | You need more time to judge whether the growth story is real. |
|---|---|
| FOCUS ON THE METRICS THAT ARE AVAILABLE | |
| High operating margin | Evidence the business model works as it scales. |
| Strong revenue growth | After all, it is a growth company — it must beat others in the sector. |
| Low debt | Keeps the company alive through a downturn. |
| Good cash position | Enough cash to survive a crash without desperate fundraising. |
| Large target market (25x TAM+) | A total addressable market many times larger than today's sales. |
| Strong, clean brand | A reputation that pulls in customers and talent. |
| Tech leadership | A genuine edge in technology or product. |
| High R&D spend | Investment today that builds the moat of tomorrow. |
| CEO / FOUNDER HEAVILY INVESTED | |
| Skin in the game | Founders with their own wealth on the line — e.g. Tesla, Square, Spotify, MercadoLibre, AMD. |
| FULLY UNDERSTAND THE BUSINESS MODEL | |
| The three-reasons test | Can you write down three reasons this company is better than its competitors? If not, you do not understand it well enough. |
How this connects to the tilts. During a shock, speculative growth stocks are usually hit first and hardest (Phase One). That does not make them bad — it makes them the part of the portfolio to size most carefully, and to judge against these stricter rules. A calm quality core (Tilt 4) is what lets you hold growth through the turbulence.
The Reset Playbook • Report published: July 20, 2026
9. RISK MANAGEMENT: THE PART MOST
PEOPLE SKIP
The real edge. Most investors obsess over what to buy. Professionals obsess over how much, and what happens if they are wrong. The framework in this report only works if it sits on top of sound risk management. Here are the principles that matter most.
Don't bet on the war — tilt toward probability. You will never have certainty about a geopolitical outcome. So never size a position as if you do. A tilt is a lean, not a leap.
Size so no single call can wreck you. Ask, before you buy: “If this position fell by half, would it change my life?” If the answer is yes, it is too big. Correct position sizing is what lets you stay calm in Phase One while others panic.
Keep a calm core. The quality and pricing-power holdings from Tilt 4 are the ballast. When the satellites (energy, defense, metals) get volatile, the core is what keeps the whole portfolio — and your nerves — steady.
Know your downside and your exit before you enter. Decide in advance what would tell you the thesis is broken, and what you will do about it. Recall that even the strongest historical tilt — energy after a shock — has tended to fade by around six months. An exit plan is not pessimism; it is professionalism.
Five risk-management habits
| Habit | The question to ask yourself |
|---|---|
| Tilt, don't gamble | Am I leaning toward a probability, or betting on one outcome? |
| Right-size every position | If this halved, would it genuinely hurt my finances? |
| Hold a calm core | Do I own enough quality to stay steady when satellites swing? |
| Define the exit first | What specific fact would tell me I am wrong? |
| Respect the window | Is this a durable trend or a fading post-shock spike? |
The Reset Playbook • Report published: July 20, 2026
10. HOW THE WINSTON APP HELPS
Filter for quality. You can screen for the strongest businesses — for example, filtering for a top moat score — so you start from a shortlist of genuine quality rather than a universe of thousands.
Read the fundamentals in plain English. Instead of digging through dense filings, the app surfaces gross margin, cash flow and balance-sheet health with clear explanations of what each number means and why it matters.
Compare like for like. You can put two tickers side by side — two energy-infrastructure funds, or two defense names — and see instantly which has the stronger fundamentals and the lower cost, exactly as we did throughout this report.
Watch the metals. The Metals Intel view tracks signals such as the gold-to-silver ratio and COMEX inventory — useful context for Tilt 3.
Build a portfolio that can survive a shock
Learn the simple, repeatable rules Felix teaches for positioning through volatility — free.
bulletproofportfolio.org
The Reset Playbook • Report published: July 20, 2026
11. WHAT WE'RE WATCHING NEXT
Signposts, not predictions. Rather than forecast headlines, we watch a short list of signals that tell us which phase we are in and whether the reset thesis is playing out.
The oil risk premium. Is energy still pricing in conflict, or has the post-shock window begun to fade toward the historical six- month mark?
Inflation and rate expectations. Is inflation staying warm enough to keep rates “higher for longer,” as the reset thesis requires?
Central-bank gold buying. Are official institutions still accumulating, supporting the structural case for Tilt 3?
Defense budgets. Are the NATO spending pledges turning into actual, signed contracts?
Volatility (the VIX). Is the “fear gauge” elevated (above 20) or calming down?
Pricing-power cracks. Are quality companies still holding margins, or beginning to discount like the snacks example in Tilt 4?
CONCLUSION
Shocks are frightening precisely because they are designed to feel unprecedented. They rarely are. By recognising the three phases, understanding the reset mechanism, and expressing a handful of well-sized tilts through low-cost ETFs, an ordinary investor can respond with the calm of a professional. The goal is never to predict the next headline. It is to build a portfolio robust enough that you do not need to.
The Reset Playbook • Report published: July 20, 2026
Reference
12. Plain-English Glossary
| Term | What it means, in plain words |
|---|---|
| ETF | Exchange-traded fund — a single investment that holds a whole basket of stocks or assets, so you spread your risk instead of betting on one company. |
| Moat | A company's durable advantage that keeps competitors away — like a castle's water-filled ditch. Examples: a trusted brand, huge scale, or patents. |
| Pricing power | The ability to raise prices without losing customers. A sign of a strong moat. |
| Gross margin | Of every dollar of sales, how much is left after the direct cost of making the product. Higher is generally healthier. |
| Free cash flow | |
| (FCF) | |
| The real cash a business has left over after paying its bills and investing to keep running. Cash is harder to fake than profit. | |
| Leverage / debt | |
| ratio | |
| How much a company relies on borrowed money. More debt means more risk if things go wrong. | |
| Interest cover | How comfortably a company can pay the interest on its debts out of its profits. Higher is safer. |
| Inflation | The general rise in prices over time, which slowly reduces what your money can buy. |
| Interest rates | The “price” of borrowing money, set largely by central banks. Higher rates make borrowing costlier and cash savings pay more. |
| Higher for longer | The idea that interest rates stay elevated for an extended period rather than being cut quickly. |
| Financial | |
| repression | |
| Keeping interest rates below inflation for a long time so that government debt slowly shrinks in real terms — how debt fell after WWII. | |
| Stablecoin | A digital token designed to hold a steady value (e.g. one dollar), typically backed by safe assets such as government debt. |
| VIX | A widely watched “fear gauge” that measures how much price swinging traders expect. Above 20 signals nervousness. |
| Toll collector | Our nickname for energy-infrastructure firms (pipelines, storage) that earn fees as energy flows through, fairly regardless of the daily price. |
| Expense ratio | The yearly fee an ETF charges, as a percentage of your money. Lower is cheaper. |
| Winston Score | The Winston app's 0–100 quality gauge for a stock or ETF. Higher suggests stronger fundamentals. |
| Gold-to-silver ratio | How many ounces of silver it takes to equal the price of one ounce of gold — a clue to which metal looks relatively cheap. |
The Reset Playbook • Report published: July 20, 2026
Reference
13. Common Questions, Answered Simply
| Question | Short answer |
|---|---|
| Should I sell everything when a war breaks out? | History suggests panic-selling into the first drop is usually a mistake. The initial move is often a head-fake (Phase One). A calm, pre-made plan beats a rushed reaction. |
| Is this report telling me what to | |
| buy? | |
| No. It contains no buy/sell ratings, price targets, or technical analysis. It is an educational map of probabilities so you | |
| can make your own decisions. | |
| Why ETFs instead of single | |
| stocks? | |
| An ETF spreads your risk across many companies, so one company's stumble does not sink the whole tilt. It is the | |
| lower-risk way to express a theme. | |
| Why is oil described as a | |
| “window”? | |
| Historically oil has led in the first three months after a shock but faded by around six months. Treat it as a temporary | |
| tilt with an exit plan, not a forever holding. | |
| Why does gold sometimes fall | |
| first? | |
| In the panic of Phase One, some investors sell gold to raise cash. That dip has often been a head-fake, with gold | |
| tending to recover in the months after. | |
| What is the “reset” in one | |
| sentence? | |
| A heavily indebted government lets warm inflation and economic growth quietly shrink the real weight of its debt over | |
| years — as happened after WWII. | |
| Why are utilities and real estate | |
| the “losers”? | |
| They borrow heavily and are bought for dividends, so “higher for longer” rates squeeze them on both costs and | |
| relative appeal. | |
| How much of my portfolio should | |
| each tilt be? | |
| That depends on your personal circumstances and risk tolerance, which is beyond this report. The universal rule: | |
| size any position so that being wrong is survivable. | |
| Where does the data come from? | All stock and ETF figures are from the Winston app (app.goatacademy.org). Historical and macro claims are cited in Section 14. |
The Reset Playbook • Report published: July 20, 2026