
The UNTHINKABLE is About to Happen to Your Portfolio
What really broke in this week's tech sell-off, why the skilled money was ready for it, and what you can check in your own portfolio today
Felix Nikolas Prehn · 23 October 2026 · 17 pages
Bottom line
The news called it a crash. It was an AI-trade sell-off, and the money moved into the boring corners of the market. But hedge funds are betting on a fall at near record levels. And the AI boom now leans on expensive, lower-rated debt. So this report shows you the facts in plain English and gives you a simple checklist.
$1.2Twiped off the Nasdaq 100 in a single day, its biggest daily drop since 5 June
Bottom Line
What happened, and why it matters to you
Bottom line. The AI trade cracked this week. The rest of the market mostly held up. But the people with the best information were already betting on a fall, and the debt under the AI boom is starting to wobble.
- AI stocks fall hard
- Money moves into boring, steady companies
- Debt under the AI boom gets dearer
- Your index fund now moves with AI
The fall
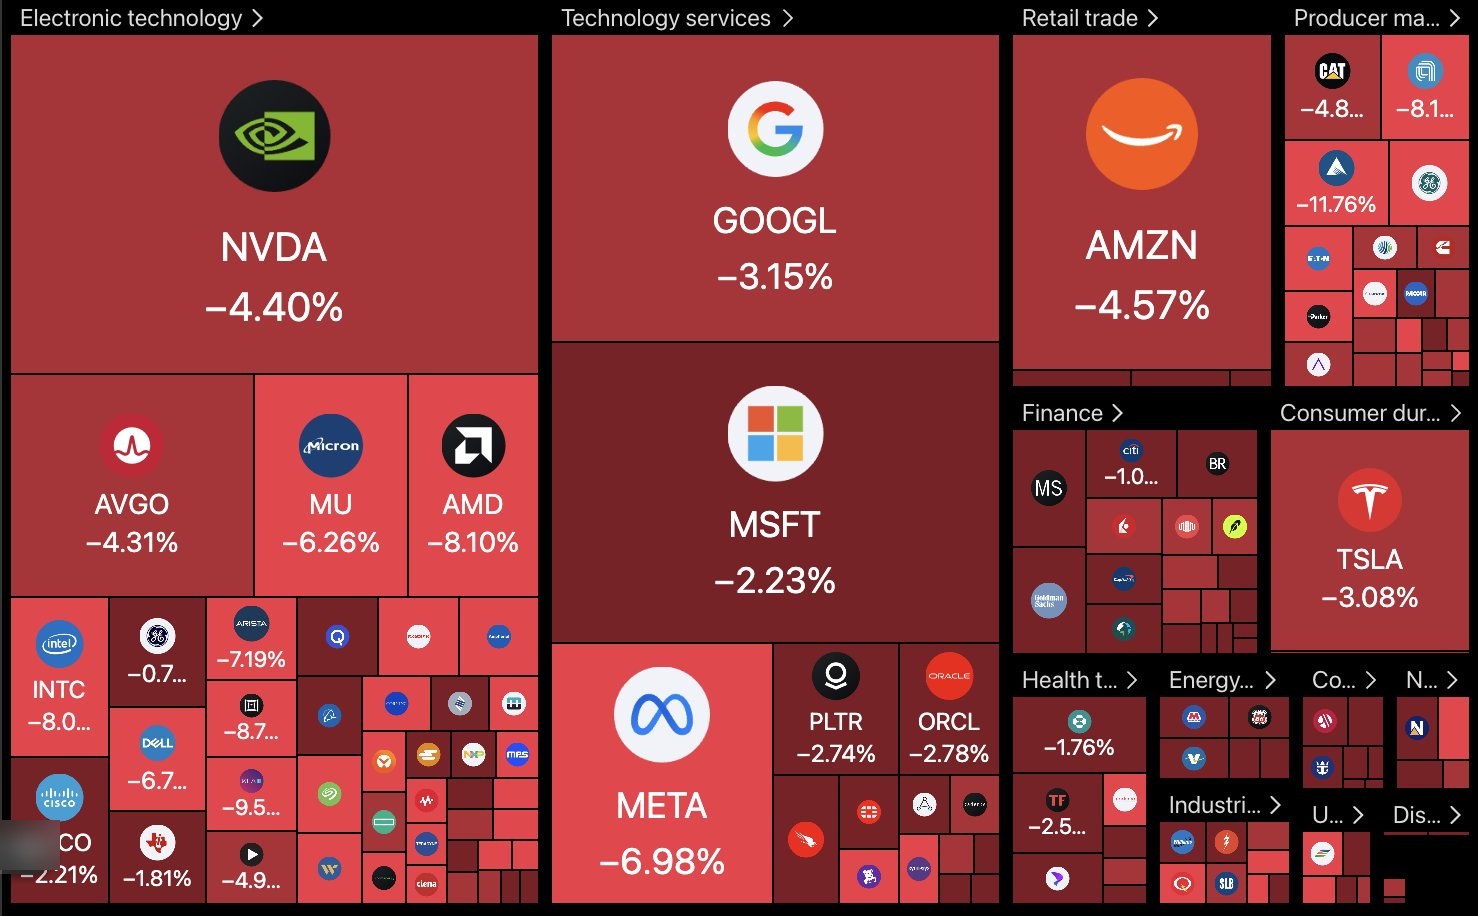
The Nasdaq 100 fell 2.9% in a day. About $1.2 trillion of market value vanished.
So what broke? Tesla cut its spending plans. And the cost of insuring Meta's debt hit a record, while Lam Research, which makes the machines that make computer chips, told investors it expects less than they had hoped.
The bets
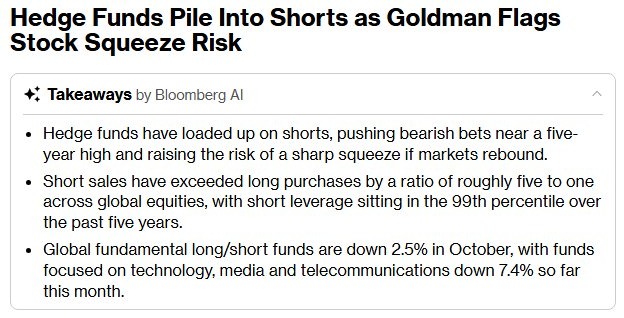
Goldman Sachs says hedge funds are shorting US stocks at close to 5-year highs. That means they are betting on falls.
And its data showed the biggest 2-week sell-off in tech by hedge funds in more than 10 years of records.
The rotation
But the whole market did not crash. The equal-weight S&P 500 closed higher. So the money that left tech didn't leave the market at all, because it simply moved into staples, utilities, healthcare and the banks.
The warning
Now look under the bonnet. The AI building boom runs on borrowed money, and lenders are getting nervous.
And your S&P 500 fund now moves almost in step with AI stocks. Why does that matter to you? Because AI down now means everything down.
Section 1
What actually broke
- -2.9%
- Nasdaq 100 in a single day
- $1.2T
- about this much market value erased
- 5 June
- the last time it had a bigger daily drop
The loud bit
The Nasdaq 100 is the 100 biggest companies on the Nasdaq exchange. Most of them are tech firms.
This week it fell 2.9% in a single day. That was its biggest daily drop since 5 June.
And about $1.2 trillion of market value was gone by the close, which is more money than most people can picture, and some of it came out of ordinary pensions and index funds.
Was some of it yours?
If you own an index fund or a pension, probably yes. Most of them hold these same giant names.
So the fall showed up as a line on your statement too.
What "de-rating" means
Bankers say the AI trade is de-rating. It means investors won't pay such a high price for these companies any more.
Picture a street where everyone suddenly wanted to live. Prices went silly. Then a few buyers started asking if the new train station was ever going to open, and so the whole street got repriced in a matter of weeks. Same houses, lower price.
Section 1, continued
Why the AI trade lost its shine
| Company | What happened | Why it matters to you |
|---|---|---|
| Tesla | Cutting capex | Less spending means less money for the firms selling the chips and kit |
| Meta | The cost of insuring its debt (its CDS) hit a record | Lenders are more worried about the giant AI spenders |
| Lam Research | Guidance underwhelmed | A chip-equipment maker expects less than investors hoped |
Tesla and capex
Capex is short for capital expenditure. It is the money a company spends on big, long-lasting things like factories and chips.
Think of your weekly food shop next to building an extension on your house. The extension is capex.
The whole AI boom rests on companies building enormous extensions. So when a big name says it will spend less, everyone selling the bricks feels it, from the chip makers to the firms that build and cool the data centres.
Meta and the insurance on its debt
Meta's AI spending sent the cost of insuring its debt to a record. That insurance is called a credit default swap, or CDS.
It works like insurance on money you lent to a friend. If your friend can't pay you back, the insurance pays you. The more worried people are, the more it costs.
And Meta is a hyperscaler. That's the name for the giant tech firms building huge data centres for AI.
Lam Research
Lam Research makes the machines that make chips. Its guidance underwhelmed. Guidance is a company telling you what it expects to earn next.
Goldman says the weak big-tech results "reignited concerns as to the durability of the trend". So can this spending spree last? That is the question now.
A tool you can use
In the Winston app, the danger zone filter picks out companies that burn cash and can't easily cover the interest on their debt.
Why look there first? Because if AI spending slows, the companies living on borrowed money get hurt first. So keep that phrase in mind. It comes back in section 4.
Section 2
The skilled money is positioned for a crash
- 5 to 1
- short sales for every purchase across global stocks
- 99th
- percentile for short leverage on a 5-year view
- -3.3
- standard deviations: record 2-week hedge fund selling of global tech
Who was ready?
While everyone was shouting crash, hedge funds were already set up for it. And Goldman Sachs says they are shorting US stocks at close to 5-year highs.
What shorting means
Shorting is betting that a price will fall. You borrow a share you don't own and sell it today. Later you hope to buy it back cheaper and hand it back.
Say your neighbour lends you his lawnmower. Mowers sell for $300, so you sell his. A month later they cost $200. You buy 1 and give it back. You keep $100.
That's a short. It's lovely when prices fall and painful when they rise.
5 to 1
Market data using Goldman's figures says something striking. For every trade buying global stocks, there were about 5 short sales betting on a fall, which tells you just how lopsided the bets had become before the fall even started.
The record selling
Goldman's prime brokerage is the part of the bank that lends money and shares to hedge funds and holds their trades for them. So it can see what they really do.
As of 19 October, its data showed the largest 2-week net selling of global tech stocks in more than 10 years of records. Net selling means they sold far more than they bought.
And short leverage sits at the 99th percentile on a 5-year view. That's how much borrowed money backs their bets against stocks.
Section 2, continued
How extreme is this?
The 99th percentile
Percentile is a way of ranking. Line up every day of the last 5 years, from the least shorting to the most.
The 99th percentile means today beats 99 out of every 100 of those days. So it sits right at the top of the pile.
3.3 standard deviations
Standard deviation measures how far something sits from normal. Think about the weather.
Most summer days are warm. 1 standard deviation is a properly hot day. But 3.3 standard deviations is the kind of heatwave that makes the evening news, and that people are still talking about at the bus stop years later.
That's how unusual this selling was.
Japan is flashing a warning light
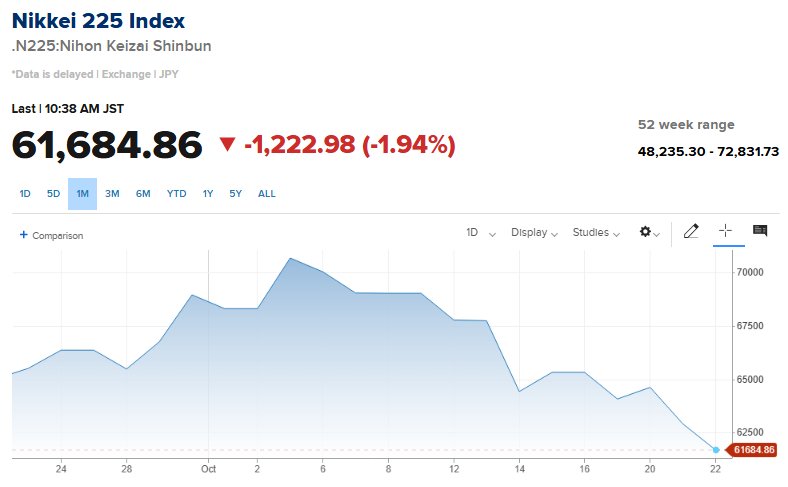
This goes beyond America. Japan's stock market has entered a technical correction after falling more than 10% in 2 weeks.
A technical correction is a fall of 10% or more from a recent high. It is like a warning light on your dashboard. The car still runs. But you'd pull over and look.
And Japan matters to you even if you never buy a Japanese share, because Japanese savers own a huge amount of American stocks and bonds.
The short squeeze
Goldman says all this shorting raises the chance of a short squeeze. Back to the lawnmower.
Say mower prices jump to $500. You still owe your neighbour a mower, so you must buy 1 at any price. So does everyone else who borrowed 1, and they all rush to the same shop on the same morning, so the rush itself pushes the price higher still.
It's a packed theatre when the fire alarm goes off. Everyone heads for the same narrow door.
What it means for you
First, think twice before you sell everything at the bottom. When this many people bet on a fall, the snap back can be violent.
Second, the skilled money rarely bets this hard without a reason. They have Goldman's research. You have a phone alert. And that gap is why this report exists.
Section 3
The truth is rotation
- -2.9%
- Nasdaq 100
- Green
- equal-weight S&P 500 (RSP) closed higher
- Flat
- Dow Jones Industrial Average
Not the whole market
Watch the news and you'd think the whole market fell off a cliff. It didn't. This was an AI-trade sell-off, not a market sell-off.
The pizza test
The normal S&P 500, the version inside most pensions and index funds, is weighted by size. Think of a pizza where Nvidia and Microsoft get huge slices and hundreds of other firms get a crumb each.
The equal-weight version holds the same 500 companies. But every company gets the same slice. The fund most people use to track it is called RSP.
On the day the Nasdaq 100 lost 2.9%, RSP closed green. And the Dow, 30 big American companies, finished flat.
Where did the money go?
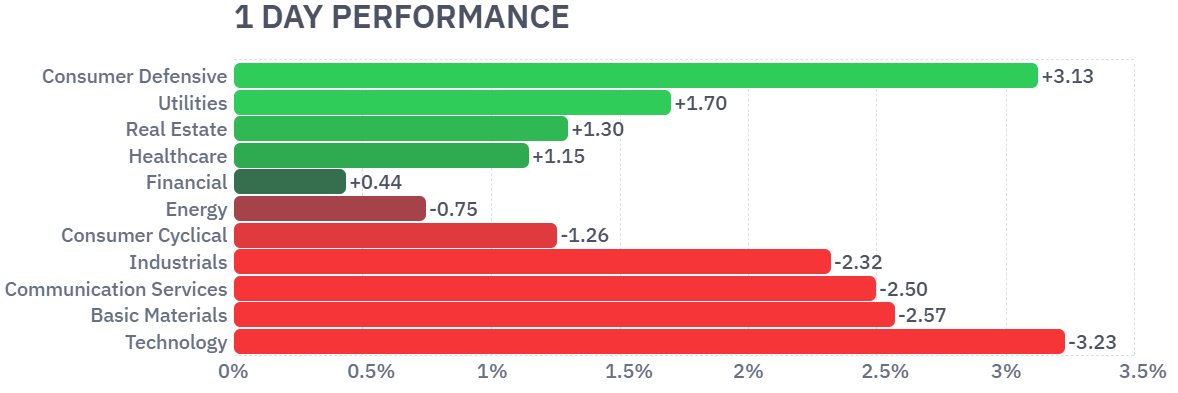
Into the boring stuff. Staples are things you buy in any economy, like toothpaste. Utilities are your power and water firms. Healthcare and financials rallied too.
Consumer defensive stocks rose about 3.1%. Technology fell about 3.2%. So it was almost a perfect mirror.
That has a name
It's called sector rotation. Money moves from 1 group of stocks to another.
Think of a pub garden on a sunny afternoon. A cloud rolls over, and everyone carries their drinks inside. Same pub, different room.
Section 3, continued
How to read a sector rotation map
- Start on the day view, absolute. You see how much each sector moved today. On the day of the fall, tech glowed red while the defensive squares lit up green.
- Switch to the week view. Is the pattern the same? If so, the move has some staying power.
- Then the month view. This tells you if you are looking at a 1-day wobble or something that has been building for weeks.
- Toggle from absolute to relative. Relative compares each sector with the S&P 500 as a whole, so it shows who is winning the tug of war on any day.
- Look for the mirror. When tech is deep red and staples, utilities and healthcare are green, money is moving rooms, not leaving the pub.
Why relative matters
On a day when everything rises, every square can be green. So the absolute view can fool you into thinking every sector is doing just as well, when some of them are badly trailing the rest.
The relative view strips that out. It shows you which sectors beat the market and which lagged. And that's the view Felix uses most.
Defensive or growth?
Staples, utilities and healthcare are called defensive. People buy them in good times and bad. Tech is called growth.
So when defensive squares beat growth for weeks, investors are getting nervous. Do you see that pattern now? Check the month view and decide for yourself.
Stay calm
A rotation is calmer than a crash. Because the money is still in the market.
But a calm rotation stays calm only while the thing it leaves doesn't break. And under the AI stocks sits a pile of debt.
Section 4
Why it could get much worse
Junk, in plain English
Credits just means loans and bonds. Lower-rated borrowers are the riskier companies.
When a company sells bonds, rating agencies give it a grade, like a school report. The safest firms borrow cheaply. But the riskiest get called junk, and they have to pay a much higher rate of interest to persuade anyone at all to lend to them.
It's like a mortgage. A spotless record gets the best rate. Miss a few payments and the bank charges you more.
Why junk is the eye of the storm
Goldman says the market is rethinking whether the AI building boom really pays. Interest rates may stay high for longer. And energy costs could rise.
So why does that hurt?
To see it, you need to know about project finance.
Project finance
Project finance is borrowing for a single project. The loan gets paid back only from that project's own income.
Say you lend a friend money to open a café. You get paid back only if the café makes money. There's no house to take. Just the café.
From power stations to data centres
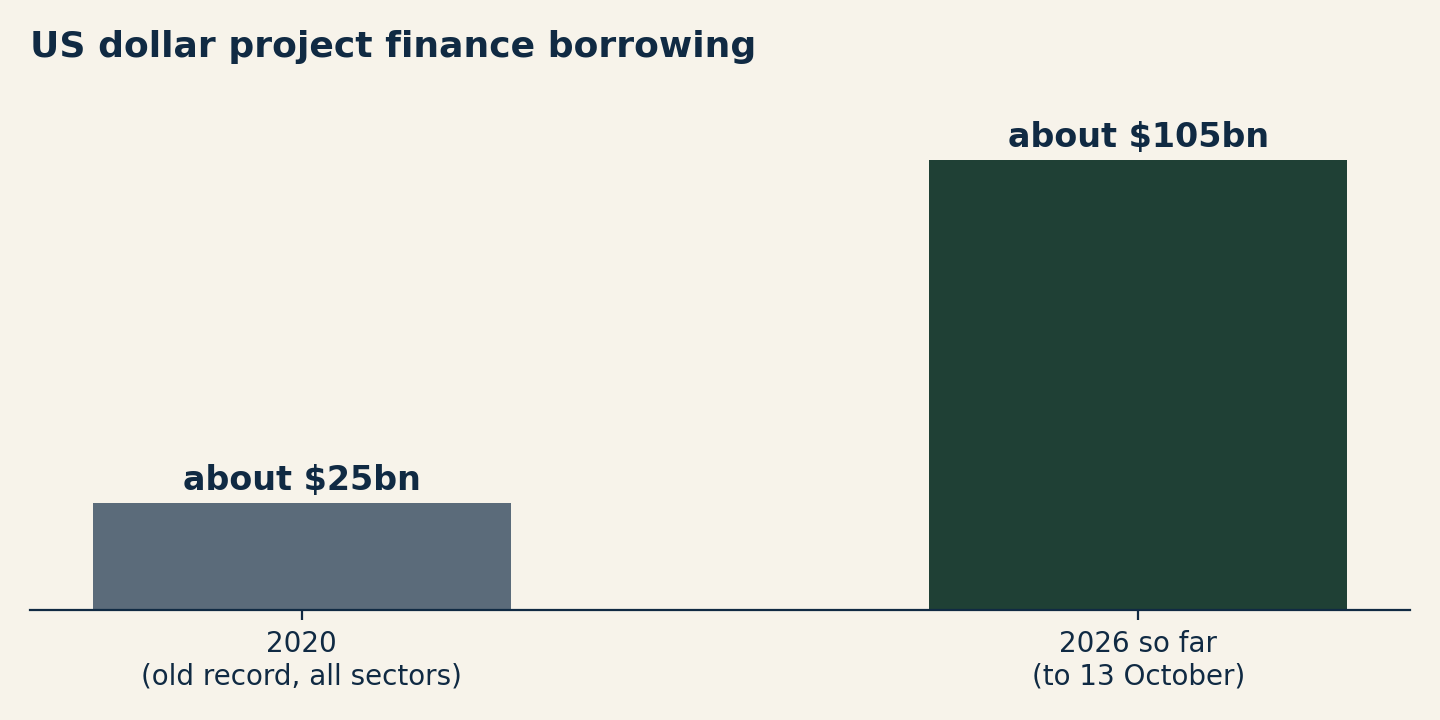
For decades, project finance paid for things like power stations and pipelines. The old record year was 2020, at about $25bn across every sector.
This year it is about $105bn so far. That's about 4 times the old record. It is also nearly 3 times 2025, which was itself a record. And almost all of it is for data centres and chips.
So a type of loan built for toll roads and power stations now mostly pays for AI.
Section 4, continued
Danger money and a $76bn hole
Danger money
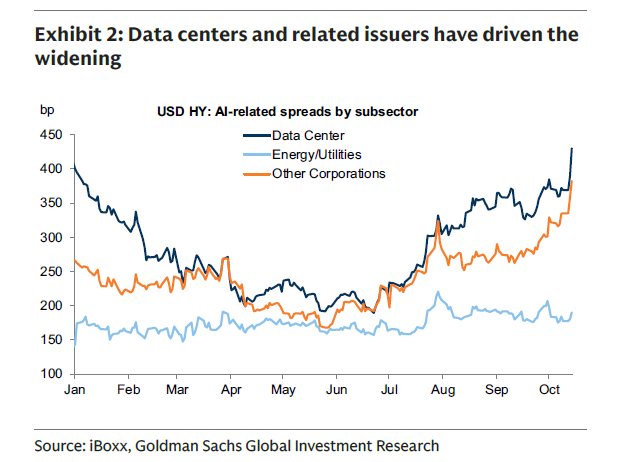
Think of it as danger money. It's the extra interest a risky borrower pays above what safe government bonds pay.
Goldman's own chart shows it has more than doubled for data centre borrowers since early summer. Why would lenders want double? Because they are less sure they'll be paid back.
The CoreWeave question
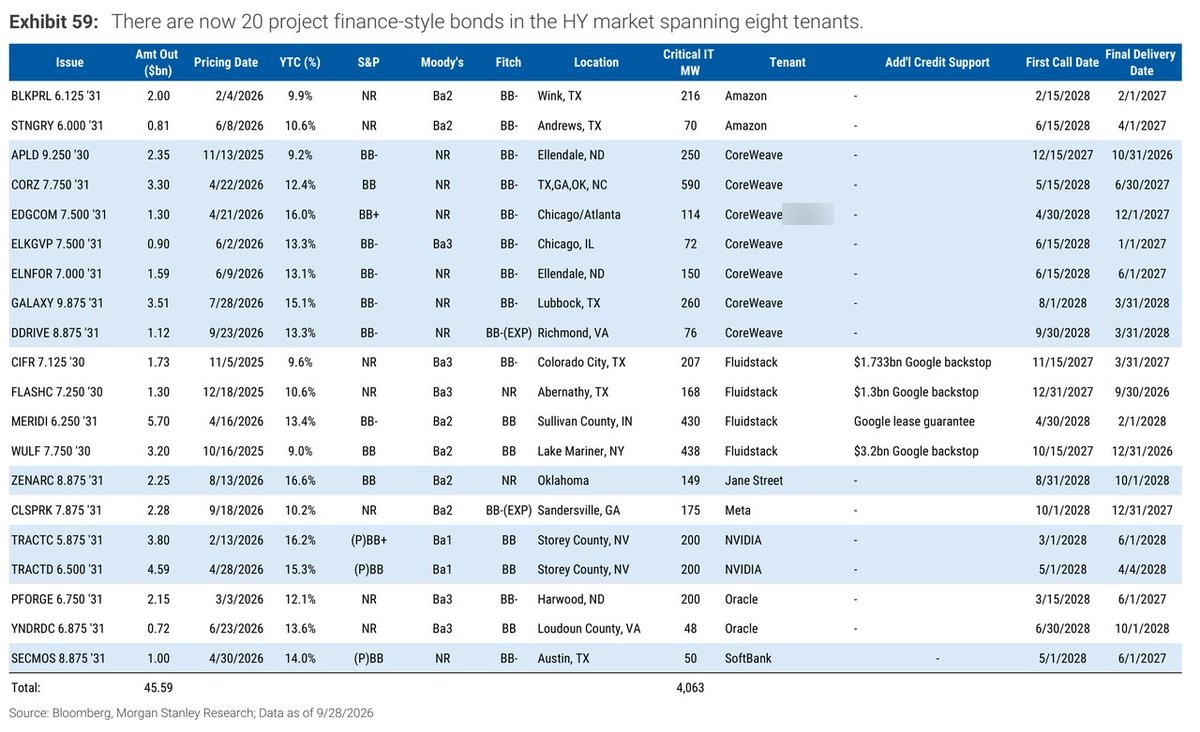
CoreWeave rents out AI computing power. So it's a sort of landlord for AI chips, and a lot of these data centres were built, and borrowed against, on the promise of CoreWeave paying its rent.
Morgan Stanley counted 20 project finance-style junk bonds worth about $46bn. And 7 of the 20 name CoreWeave as a tenant.
Now Bernstein, a big Wall Street research house, sees a $76bn funding hole at CoreWeave.
What a funding hole means
A funding hole is the gap between what a company must spend and the money it has lined up.
Back to the café. You lent on the promise of 1 big regular customer. Now there's a $76bn question mark over that customer.
Goldman expects big differences between AI borrowers. So some of these bonds will get paid in full. And some might not.
Section 4, continued
When AI down means everything down
- 5.00%
- 10-year US government bond yield
- 2.67%
- 10-year real yield, after expected inflation
- 0.73 → 0.91
- AI basket's correlation with the S&P 500 since 14 October
Borrowing is getting dearer
The 10-year yield is the interest America pays to borrow for 10 years. It sits at 5.00%.
It sets the tone for almost every loan in the country, from mortgages to company debt.
The real yield is what's left after expected inflation. It is 2.67%. Goldman's trader says real yields are "in the driving seat".
So borrowed money is expensive. And the AI boom runs on borrowed money.
The day it changed
On 14 October, Goldman's AI Leaders basket fell 4.7% in a single day. A basket is a group of stocks tracked together.
Since then its correlation with the S&P 500 has jumped from 0.73 to 0.91.
Correlation, in plain English
Correlation measures how closely 2 things move together. At 1, they move in perfect step, like 2 dancers doing the same steps. At 0, there's no link.
At 0.91 they're very nearly dancing as 1.
Why this is the unthinkable
AI down now means everything down. And everything means the S&P 500, the fund inside most pensions.
You were told it was the safe, spread-out choice. Now it moves almost in step with a handful of AI stocks. And the boom behind them leans on expensive, lower-rated debt.
Japan again
Japanese savers have poured money into America for decades. If AI cracks and America looks less special, Goldman expects much of that money to head home.
And that would mean heavy selling of American stocks and bonds by people who have been loyal, steady buyers of them for a whole generation.
Section 5
A checklist for your own portfolio
This is education, not personal advice. It shows you what to look at. What you do about it depends on your own situation, so speak to a regulated adviser if you are unsure.
- Count the giants. Add up how much of your money sits in the biggest tech names. Include what you hold through funds, not just shares you bought yourself.
- Check for overlap. Open the factsheet for each fund you own. Look at its top 10 holdings. Do the same names keep turning up?
- Know what your pension holds. Many pension funds track the S&P 500 or a global index. Find out which, and how much of it is big tech.
- Look at the debt. Run the danger zone filter in the Winston app over your shares. Which of them burn cash and lean on borrowed money?
- Set a cash buffer. Decide how many months of spending you want in cash, so a bad year never forces you to sell at the bottom. Write the number down.
- Watch the rotation. Check the chessboard on the week and month views. Is money leaving growth for defensive sectors?
- Write your plan before the next red day. Decide now what would make you act. Panic makes a terrible fund manager.
Why overlap catches people out
Say you own an S&P 500 fund, a global fund and a tech fund. It feels spread out.
But open the factsheets. The same handful of giant names often sit at the top of all 3. So you may own far more AI than you think.
Why the cash buffer matters
The people who get hurt most in a fall are often the ones who must sell. And a cash buffer buys you time.
And time is what lets you wait for the snap back instead of selling into the panic.
Plain English
Plain-English glossary
You don't need a finance degree to follow this. You just need the words.
| Term | What it means |
|---|---|
| Short selling | Betting a price will fall. You borrow a share and sell it, hoping to buy it back cheaper later and hand it back. |
| Short squeeze | When a price rises and short sellers all rush to buy back at once, pushing the price up even faster. |
| Put option | Like an insurance policy on a share. The buyer pays a fee for the right to sell at a fixed price, even if the price falls far below it. |
| Selling a put | Being the insurance company. You collect a fee and promise to buy the share at a set price if it drops to that level. |
| Sector rotation | Money moving from 1 group of stocks to another, such as from tech into utilities and healthcare. |
| Equal-weight index (RSP) | A version of the S&P 500 where every company gets the same share. RSP is the fund most people use to track it. |
| Credit default swap (CDS) | Insurance on a loan. If the borrower can't pay, the insurance pays out. A higher price means more worry. |
| Hyperscaler | A giant tech firm building huge data centres for AI, such as Microsoft, Amazon, Google and Meta. |
| Capex | Capital expenditure. Money spent on big, long-lasting things like factories and data centres. |
| Percentile | A ranking out of 100. The 99th percentile means higher than 99 out of every 100 readings. |
| Standard deviation | A measure of how far something sits from normal. 3 or more is very rare. |
| Correlation | How closely 2 things move together. 1 means in perfect step. 0 means no link. |
| Project finance | A loan for a single project that is paid back only from that project's own income. |
| Junk / lower-rated credit | Bonds and loans from riskier borrowers. They pay higher interest because lenders are less sure of being repaid. |
| 10-year yield | The interest the US government pays to borrow for 10 years. It sets the tone for mortgages and company loans. |
| Technical correction | A fall of 10% or more from a recent high. |
| Probability of profit | The estimated odds that a trade makes at least some money by the time it ends, based on how much the price usually moves. |
Section 6
This will get a lot worse. Learn how to be ready.
The honest worry
Felix would rather worry you a little now than see you get hurt later. He thinks this will get a lot worse.
Maybe not next week. But when it comes, it won't be a few percent. It could hit your pension and the savings you were counting on for the next 20 years.
A skill you were never taught
Reading what the skilled money does while your screen screams panic is a skill. Nobody taught you that at school. And that isn't your fault.
But you can learn it. You've picked up harder things than this. Nobody's born knowing how to drive.
Why now?
Most people try to prepare once the damage is done. But by then the prices have already moved and the good options have gone, so all that is left is a choice between selling at a loss and hoping it comes back.
So the time to learn is before it lands.
Disclaimer
Figures are as published by the sources above at the time of writing. Market prices move every day, so check the latest figures before you act on anything.
This report is for educational and informational purposes only. It does not constitute financial, investment, legal, tax or accounting advice. It is not a recommendation, solicitation or offer to buy or sell any security or financial product. No buy or sell rating or price target is given. The Prehn Institute has no affiliation with any broker and receives no payment from any company named in this report. All investments involve risk, including the possible loss of your capital. Past performance is not a reliable guide to future results. Consider your own circumstances and speak to a regulated financial adviser before making any decision.