
A Once In A 100 Year Investment Opportunity Just Started
Expensive oil, falling real estate jobs and a frightened crowd, and the second half of each headline that nobody reads out
Felix Nikolas Prehn · 30 September 2026 · 18 pages
Bottom line
Each of this week's frightening headlines has a second half. Expensive oil now pays America. Weak housing gives the Fed a reason to ease. A scared crowd has usually already sold. And the money supply is growing at its fastest pace in 4 years. The new money is not lifting everything: 82% of the stocks in the S&P 500 are down. It is being funnelled into a small group of businesses that are actually growing.
5.66%yearly growth in America's money supply (M2) in August, the fastest since June 2022
Bottom Line
4 headlines, 4 second halves
Bottom line. The frightened move, the one most people will make, is to sell and sit in cash. This report argues that is the wrong way round. The money is coming back into the system, and it is being very picky about where it lands.
| The headline | The second half |
|---|---|
| Oil is up almost 50% in a year | America is now by far the biggest oil producer on the planet, so much of that money lands back in America |
| Estate agents are losing their jobs | Real estate job openings nearly halved in 1 month, which hands the Fed a reason to ease |
| Almost half of investors expect lower prices | In the past, readings this frightened came before strong 12-month gains |
| The market looks fine on the surface | 82% of S&P 500 stocks are down; the new money goes to a handful |
The one chart
M2 is growing again, and faster. America's money supply is at a record $23.34 trillion and grew 5.66% in the year to August, the fastest since June 2022.
The difference this time
Not every boat rises. In 2020 and 2021 almost everything went up. This time the money is arriving in a market where most stocks are falling.
The squeeze
Memory chips are short. AI needs vast amounts of memory, and rebuilding production takes years. Some people are calling it a 100 year flood.
The response
A plan, not a panic. Hold less idle cash, read the money not the mood, own checked quality, rethink the index fund and move in stages.
Headline 1
Brent crude: up about 46% in a year
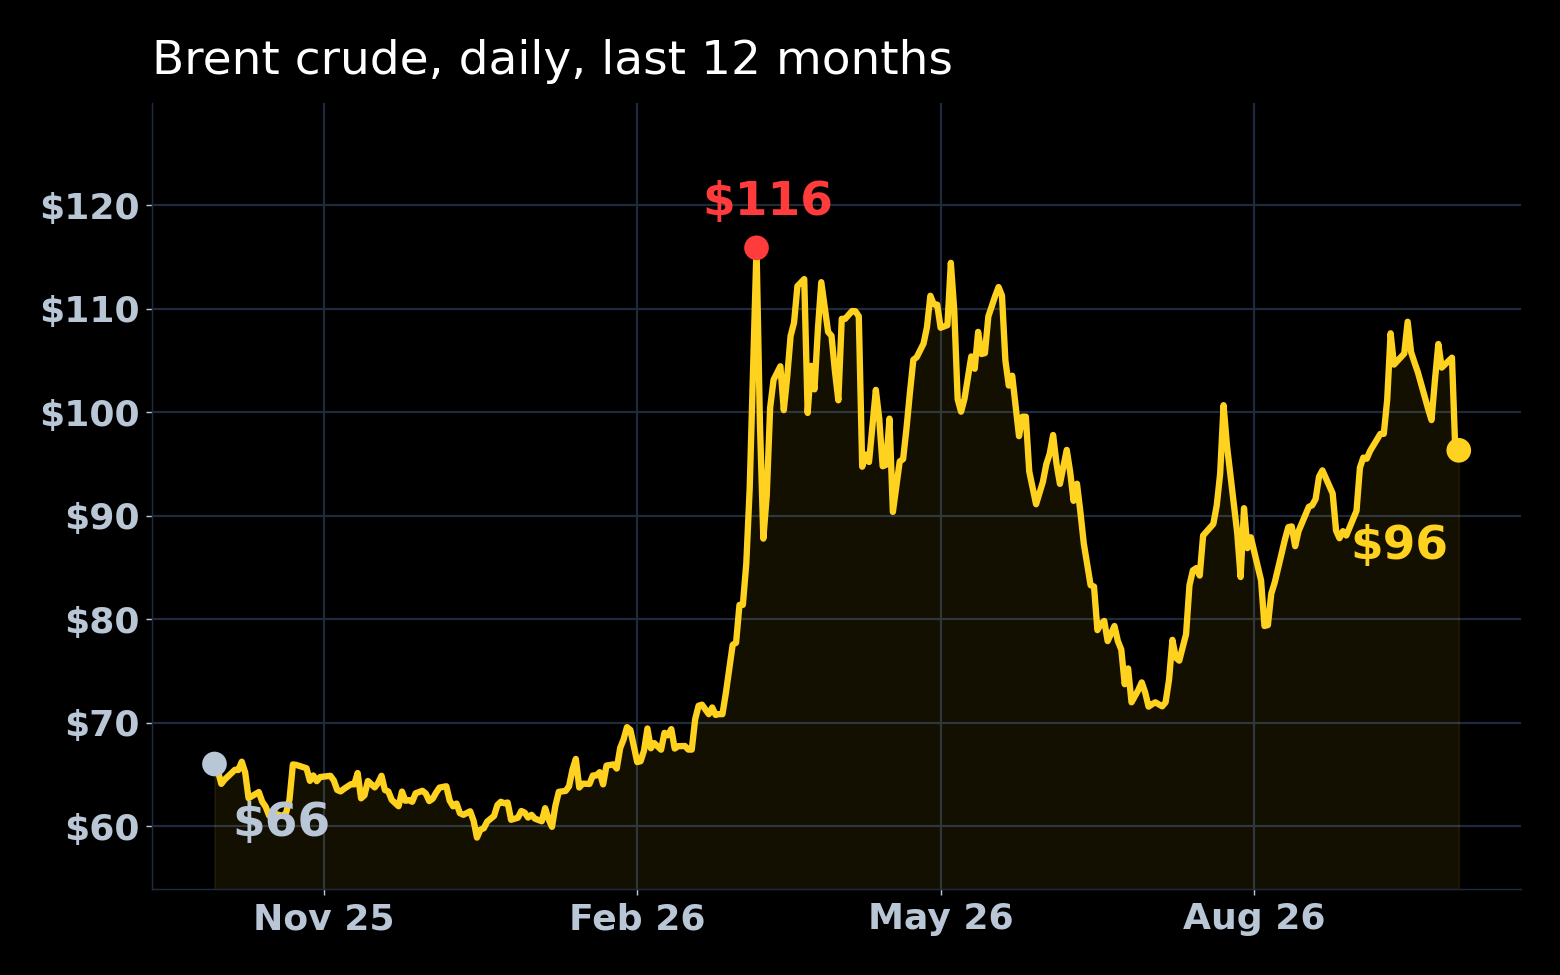
- ~$66
- a barrel a year ago
- ~$116
- the spike on 8 March 2026
- ~$96
- at recording, up about 46% in a year
The usual headline
Petrol up, consumer squeezed, America in trouble. If you fill up a pickup every week, you feel it. That part is real.
The question nobody asks
When the price goes up, who is selling the oil? The answer has changed completely since the 1970s, and it changes what an expensive barrel means for America.
The Second Half of Headline 1
America is now by far the biggest producer
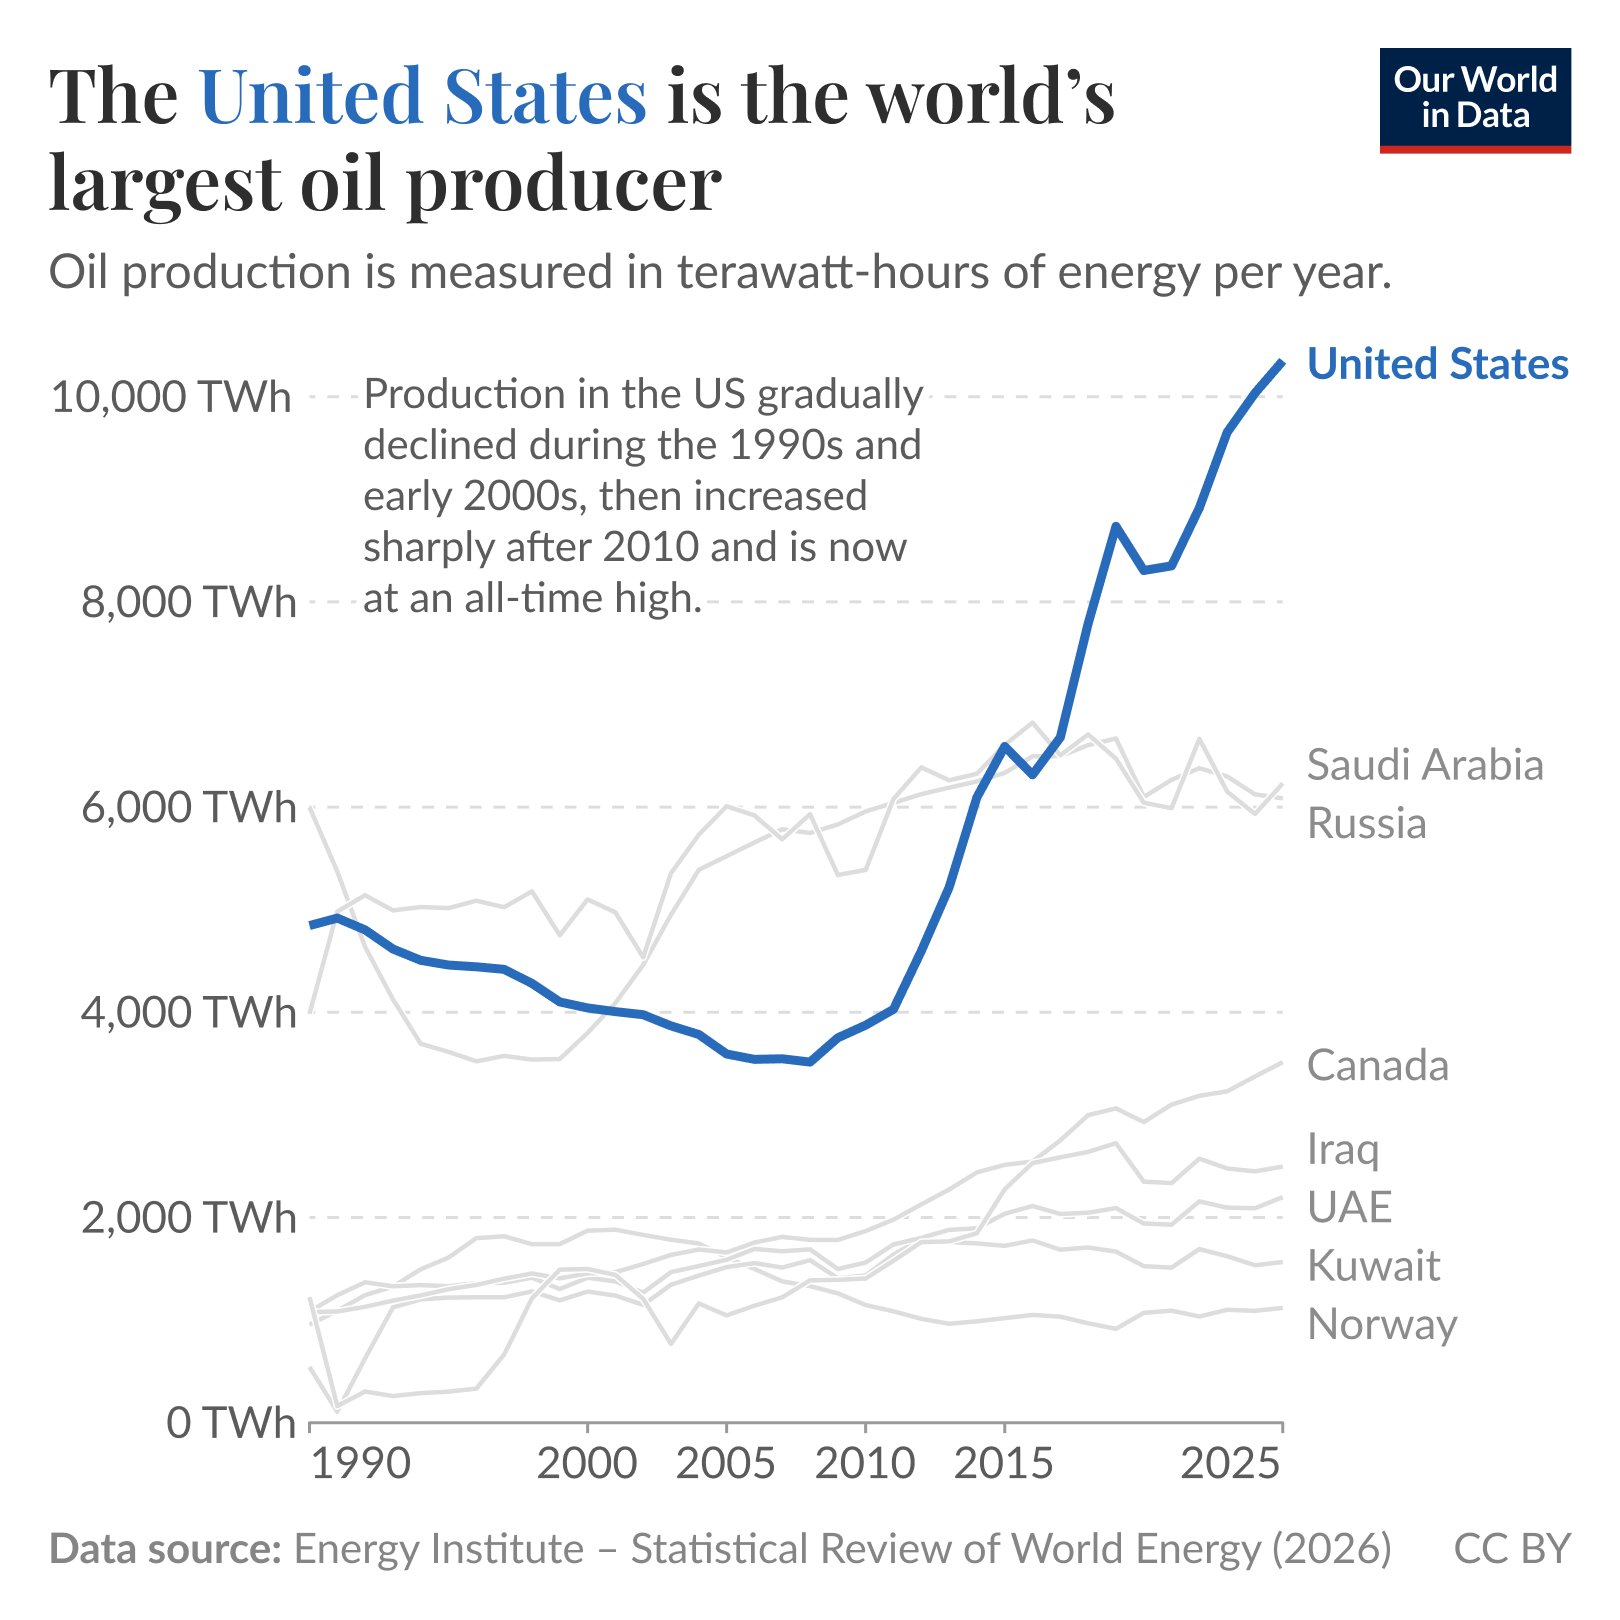
- 66%
- more oil than Saudi Arabia last year
- 70%
- more than Russia
- ~3x
- what America produced in 2008
Then
A tax paid abroad. For decades a high oil price sent money out of petrol stations in Ohio and into Riyadh. In the 1970s an oil shock helped wreck the American economy for the best part of a decade.
Now
Much of the money stays home. Thanks to fracking, it lands in Texas, North Dakota and New Mexico, in the pension funds that own the drillers and with their shareholders.
Same Oil Price, Same Country
Right sector is not enough
Bottom line. Two American oil companies, the same oil price and a completely different result. Being in the right sector is not enough anymore. You have to be in the right stock.
| Company | Winston score | Revenue (last reading) | Earnings (last reading) | Note |
|---|---|---|---|---|
| EOG Resources (EOG) | 70 | Up 61% | Up about 40% | About 9.5 times next year's expected earnings |
| Exxon Mobil (XOM) | 48 | Up 44% | Down 43% | The name everybody has heard of |
- Oil price rises
- Sector looks attractive
- Check the numbers name by name
- Only some turn higher prices into higher earnings
Scores and figures from the Winston app at the time of recording. Shown for education only, not as recommendations.
Under the Surface of the Index
82% of the stocks in the S&P 500 are down
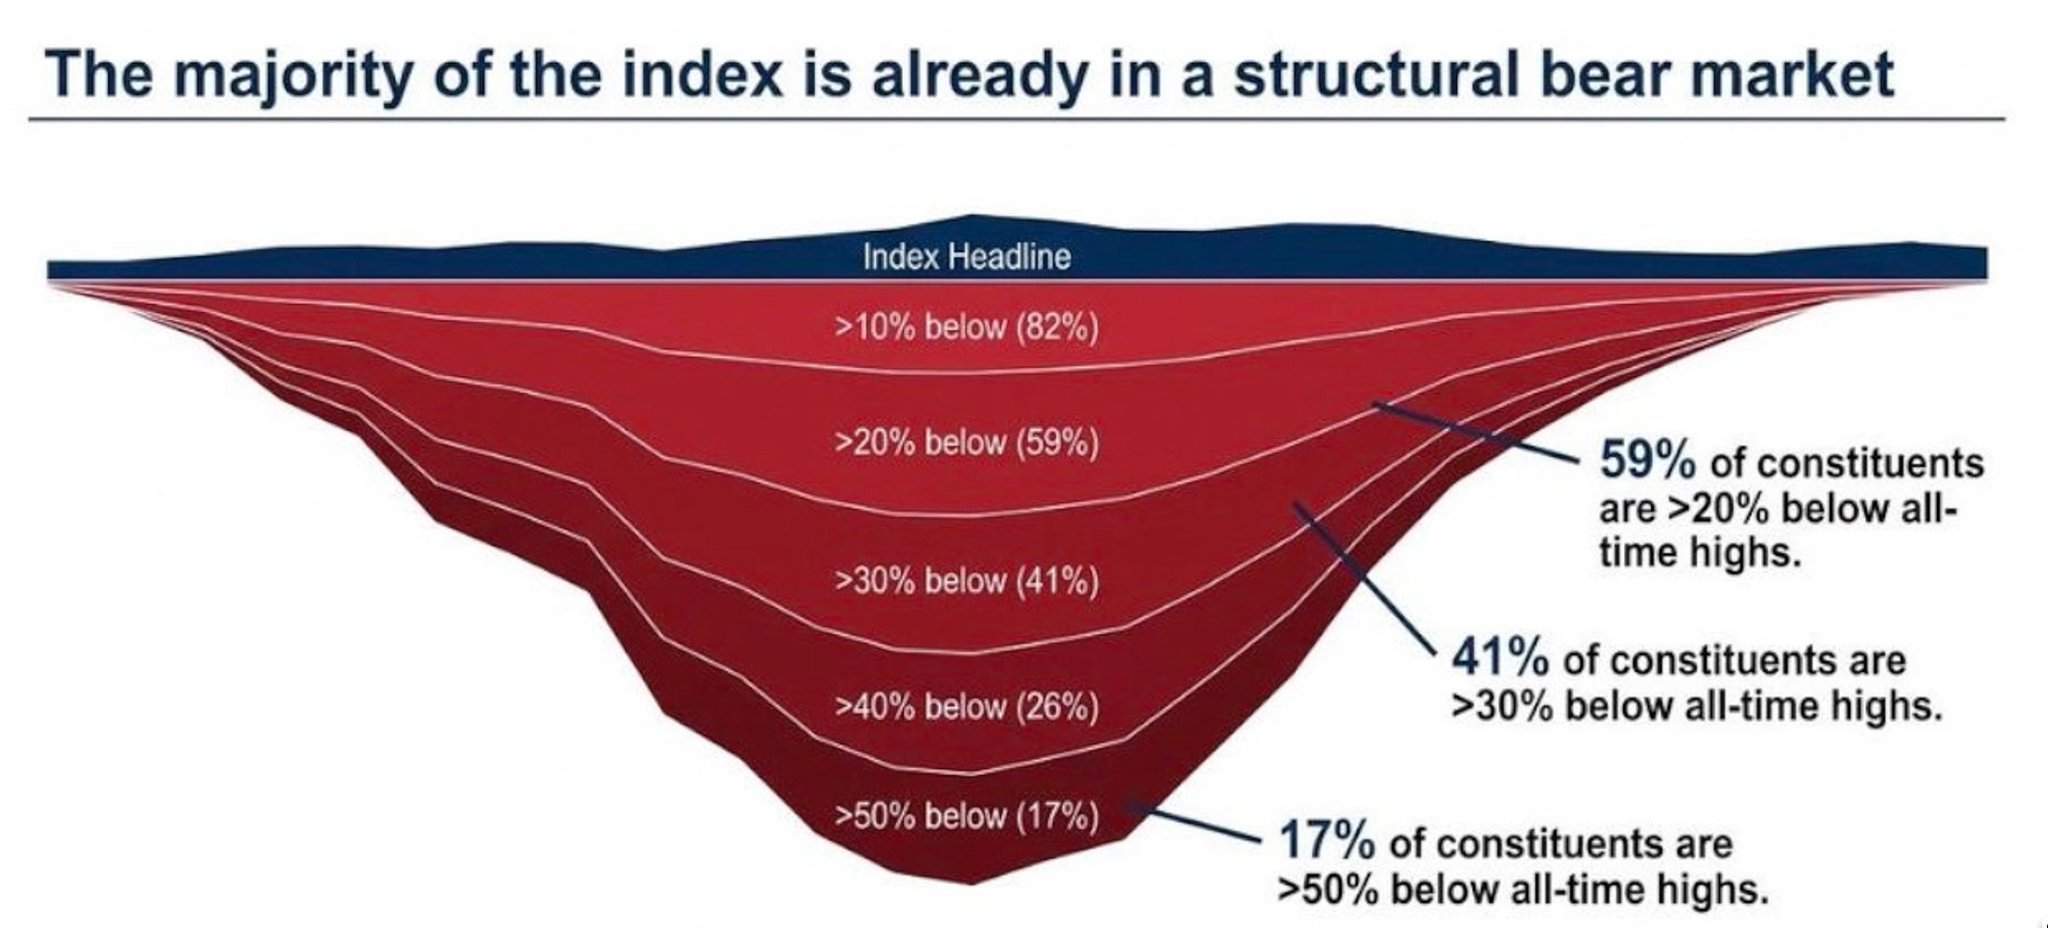
What you think you own
500 companies, spread out and safe. That is what most sensible people have been told for about 40 years.
What you actually own
A small group dragging 400 along. If those few names stumble, there is nothing underneath to catch your 401k or pension.
Why buy and hold worked before
Falling rates lifted nearly everything. For decades that tide carried the whole market. The system has changed, and money moves faster than ever.
What skilled money does
It follows the money. It watches where the big institutions move their cash and moves with it, rather than holding a stock for life.
Headline 2
Real estate job openings nearly halved in 1 month
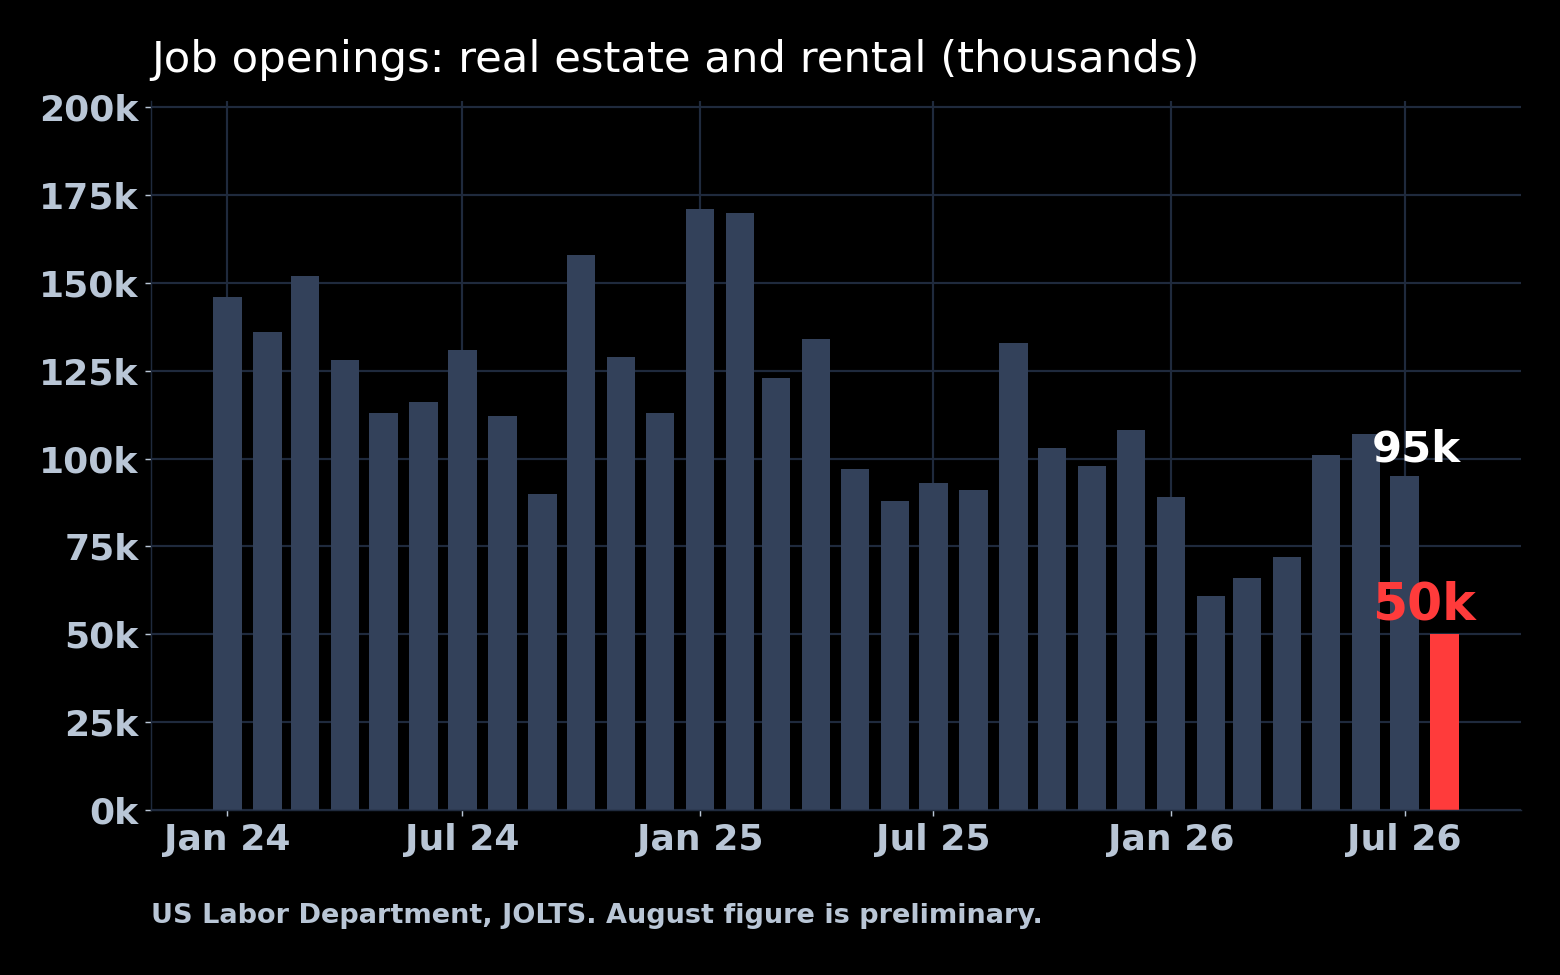
- 95,000
- open jobs in July
- 50,000
- open jobs in August, the lowest on the chart
- ~7.45%
- American mortgage rates
- High mortgage rates
- Buyers stop buying
- Houses sit unsold
- Offices stop hiring, then cut
The Second Half of Headline 2
Housing is where the data breaks first
The Fed's 2 jobs
Prices and jobs. The case against cutting rates has been that the economy is strong. That case must be defended with data every month, and housing is the most rate-sensitive part of the economy.
The crowbar
Pressure that runs one way. Nobody knows whether the Fed cuts next month. A collapsing jobs number in real estate is the sort of chart that gives it cover to ease.
- Housing slows
- Builders slow
- Furniture, removals, carpet fitters
- Mortgage banks
| The obvious rate cut trade | Winston score | Last reading |
|---|---|---|
| D.R. Horton (DHI) | 48 | Revenue flat, earnings down about 5% |
| Lennar (LEN) | 36 | Earnings down 52% |
Obvious and good are not the same thing. Scores from the Winston app at the time of recording, for education only.
The Stock Market Is Not a Thermometer
The economy is not Wall Street
- 14.7%
- American unemployment, April 2020, the worst since the Great Depression
- Record
- S&P 500 all-time high by August 2020
- −19%
- S&P 500 in 2022, with jobs plentiful
| Main Street (the economy) | Wall Street (the money) | |
|---|---|---|
| 2020 | Millions out of work | Government and Fed flood the system; stocks hit a record |
| 2022 | Unemployment low, jobs plentiful | Fed raises hard and pulls money out; stocks fall about 19% |
What the market measures
Future earnings and available money. Not how people feel today. That is why the 2 can run in opposite directions for years.
Why bad news can be good
Weak data loosens policy. Weak jobs, a slowing housing market and falling job openings are reasons to ease. The money reaches markets first and Main Street later.
Headline 3
The crowd is scared
Every week since 1987 the American Association of Individual Investors (AAII) has asked its members whether the stock market will be higher, lower or about the same 6 months from now.
- 31.5%
- bearish on average over the survey's history
- 48.1%
- bearish, week ending 23 September 2026
- 53.3%
- bearish, week ending 16 September 2026
When the crowd was this scared before
| Date | Bearish reading | Backdrop | S&P 500, 12 months later |
|---|---|---|---|
| 5 March 2009 | 70.3% (highest ever) | Banks thought finished | Up about 67% |
| 29 September 2022 | 60.9% | Inflation at a 40 year high, rate rises every few weeks | Up about 18% |
Price only, dividends not included.
- Bearish investors have usually already sold
- Few sellers are left
- Cash waits on the sidelines
- It buys back in, often higher
M2 Money Supply
A record $23.34 trillion
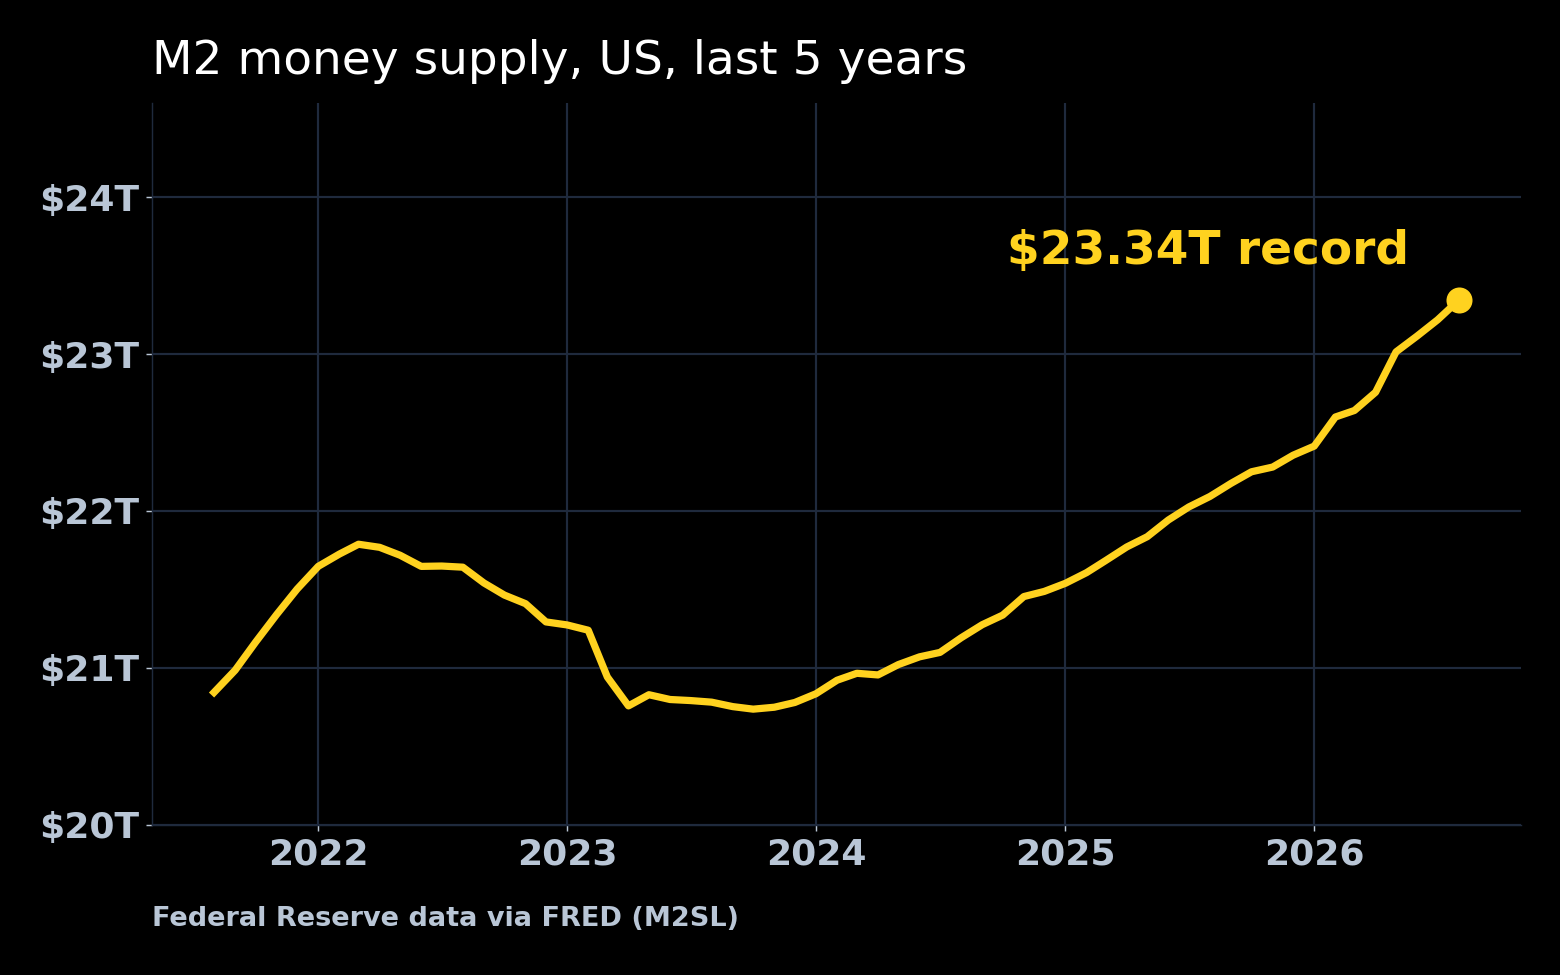
What M2 is
Money people can reach quickly. Cash, current accounts, savings accounts and money market funds. The Federal Reserve publishes it every month.
Speeding up
About 60% faster than a year ago. M2 grew by about $605 billion in the first 8 months of 2025 and about $988 billion in the first 8 months of 2026.
- ~$605B
- added January to August 2025
- ~$988B
- added January to August 2026
- ~60%
- faster pace of new money
From Shrinking to Speeding Up
5.66% a year, the fastest since June 2022
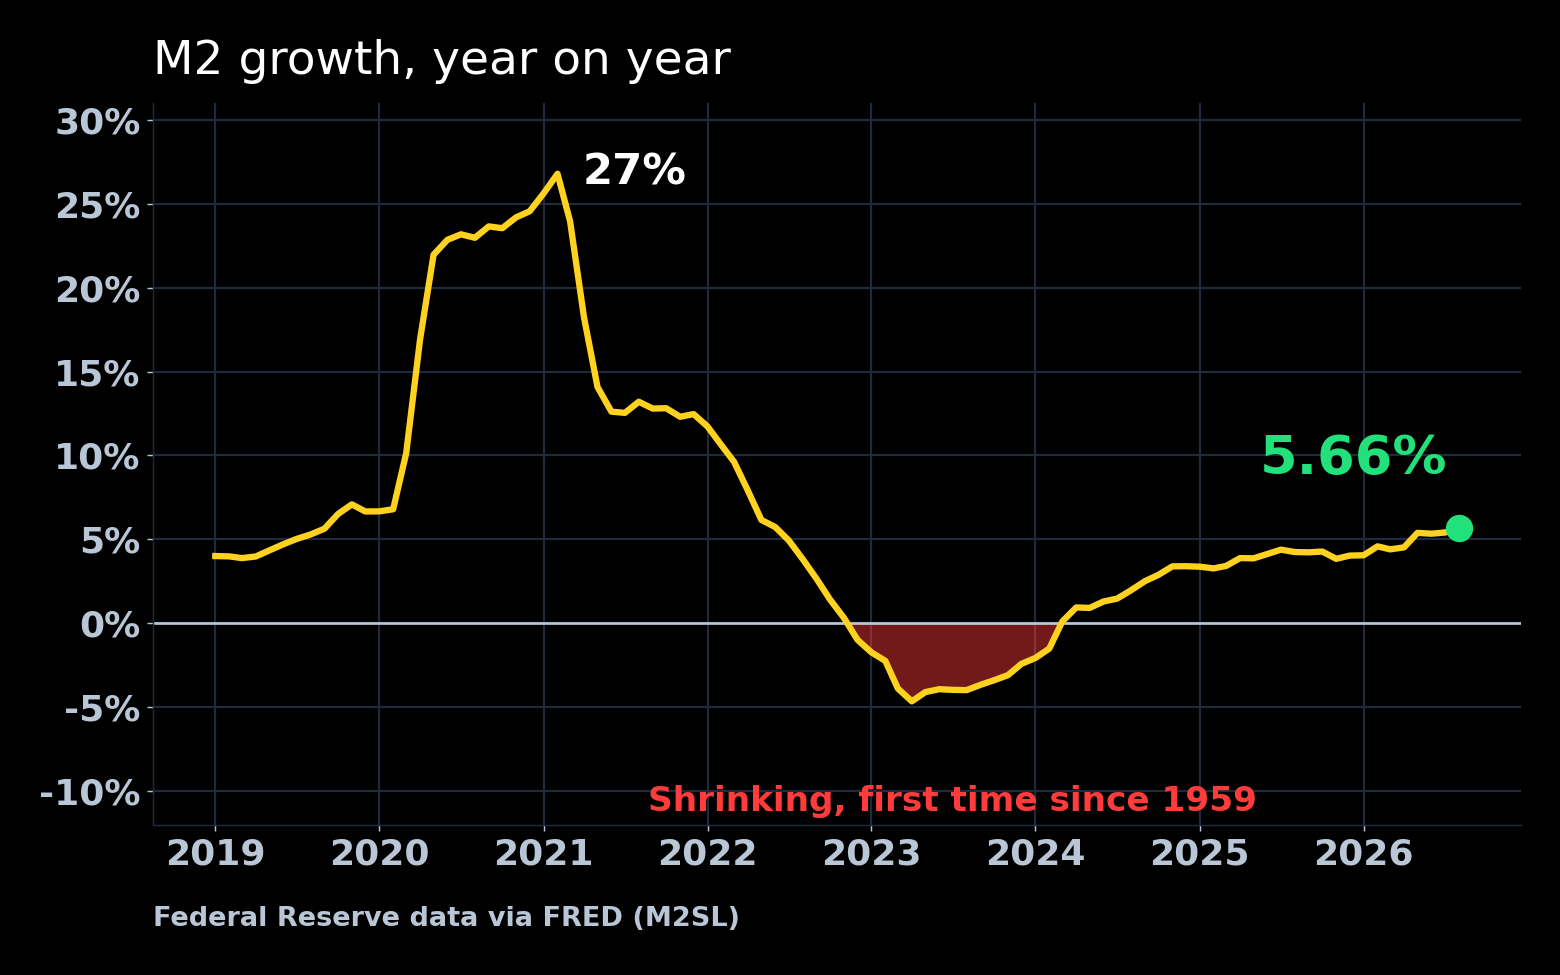
Last time
Everything went up. In 2020 and 2021 M2 grew by as much as 27% in a single year, rates were at zero, and the S&P 500 doubled from its March 2020 low in about 17 months. Companies that had never made a penny rose with the rest.
This time
The money is picky. It is arriving in a market where 82% of stocks are going down. It is not lifting all the boats. It is being funnelled into a small group of businesses that are actually growing.
A Shortage Meets a Flood of Money
The memory chip squeeze
The warning
Price rises are unavoidable. Tim Cook, just before he stepped down as the boss of Apple, said price rises on phones and laptops are now unavoidable because the world is running short of memory chips. Some people are calling it a 100 year flood.
Why it lasts
Capacity takes years. AI needs vast amounts of memory. Chip makers cut production in 2023 during a glut, and rebuilding that takes years.
What happens to the numbers: Micron (MU)
- 81
- Winston score
- ~346%
- revenue growth on the last reading
- ~15x
- earnings growth on the last reading
- 44%
- yearly return on the money it puts to work
- ~6x
- next year's expected earnings
- #1
- biggest American maker of memory chips
Micron is shown to illustrate what a genuine shortage does to a company's numbers. It is not a recommendation to buy. Figures from the Winston app at the time of recording.
The Setup
Why this looks like a once in a 100 year setup
- Oil money flows into America instead of out of it
- A housing slump hands the Fed its excuse to ease
- A frightened crowd has already sold
- The money supply grows faster than at any point in 4 years
- The money lands in a few businesses that are actually growing
Bottom line. Not because everything goes up. Because the money is coming back, and it is going to be very picky about where it lands. The 2 places most people feel safest, cash and the index fund, are where this setup can hurt them most.
Turn Understanding Into Process
5 things a normal person can do
- Hold less of your life in cash. Keep an emergency fund of 3 to 6 months of expenses. Beyond that, if M2 grows 5.66% a year and your savings pay less, your slice of the pie shrinks every month.
- Stop reading the economy as a stock market signal. Ask what a frightening number means for the money, not how it makes you feel.
- Own quality, and check it properly. Is revenue growing? Are earnings growing? Does the business earn a good return on its money? Are you paying a sensible price?
- Do not assume the index fund does the job for you. With 82% of its stocks down, you need a plan for how and when you use it.
- Go in stages. No panic selling and no rush buying. Small, sensible moves spread over time.
Disclaimer
This report is for educational and informational purposes only and does not constitute financial, investment, legal, tax or accounting advice. It is not a recommendation, solicitation or offer to buy or sell any security, currency, commodity or financial product. No buy/sell rating or price target is provided. Companies named are used as illustrations only. All investments involve risk, including the possible loss of principal. Historical patterns described here, including sentiment readings and money supply cycles, may not repeat. Preliminary data can be revised. Readers should conduct their own research and consult appropriately qualified professionals before making financial decisions. Past performance is not indicative of future results. The Prehn Institute and Winston make no guarantee regarding outcomes.