
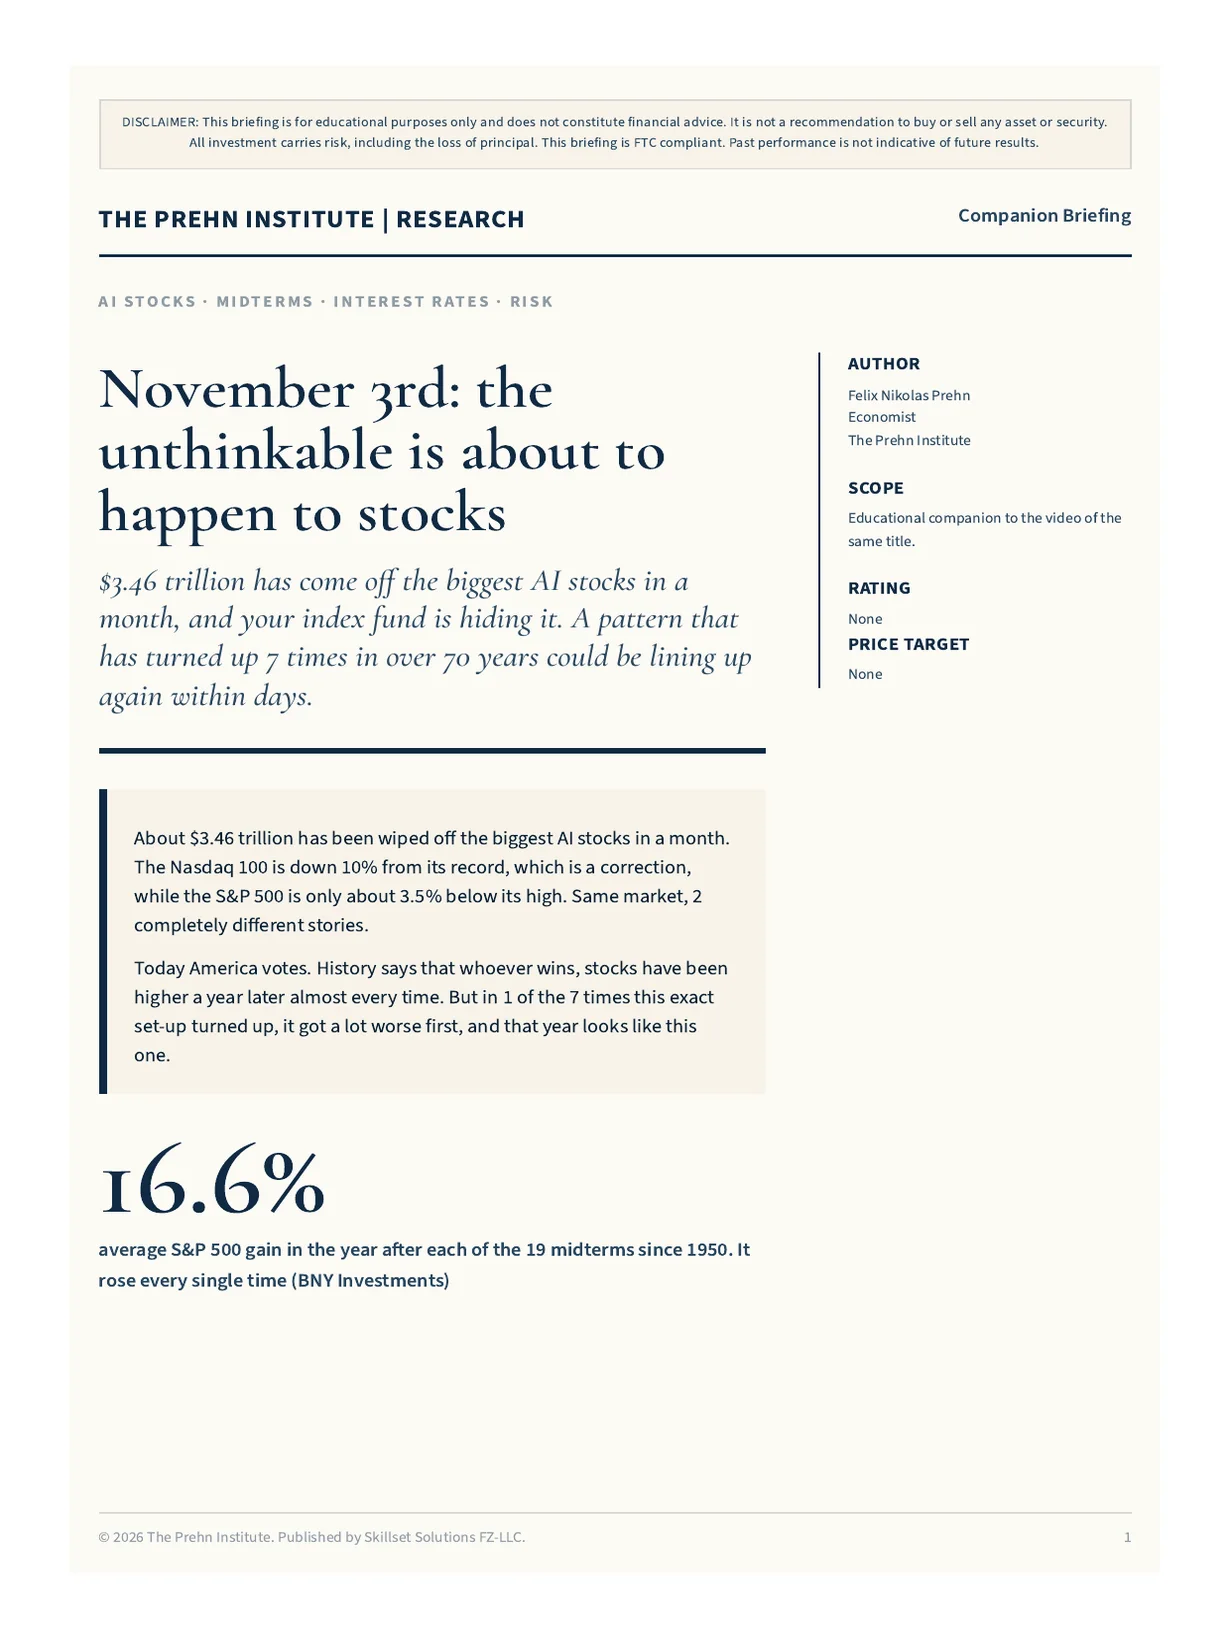
November 3rd: the unthinkable is about to happen to stocks
$3.46 trillion has come off the biggest AI stocks in a month, and your index fund is hiding it. A pattern that has turned up 7 times in over 70 years could be lining up again within days.
Felix Nikolas Prehn · 3 November 2026 · 15 pages
Bottom line
About $3.46 trillion has been wiped off the biggest AI stocks in a month. The Nasdaq 100 is down 10% from its record, which is a correction, while the S&P 500 is only about 3.5% below its high. Same market, 2 completely different stories. Today America votes. History says that whoever wins, stocks have been higher a year later almost every time. But in 1 of the 7 times this exact set-up turned up, it got a lot worse first, and that year looks like this one.
16.6%average S&P 500 gain in the year after each of the 19 midterms since 1950. It rose every single time (BNY Investments)
Same Market, 2 Stories
The crash your index fund is hiding
- -3.5%
- S&P 500 below its record high
- -10%
- Nasdaq 100 from its record, a correction
- 23
- CNN Fear and Greed Index, extreme fear
- Prices ran far ahead of profits
- Earnings season punished the big spenders
- High rates and a nervous oil price
- The crowd heads for the exit
Your pension app looks calm because the damage is hiding inside the average. The S&P 500, which tracks America's 500 biggest companies, is only about 3.5% below its record. The Nasdaq 100, packed with the big technology names, is down 10%. Both are true at once.
How? An index is weighted by size. When money sells out of a handful of giant tech stocks and moves into the other 490 companies, the tech index falls hard while the broad index barely moves. The selling is real. It is just being averaged away.
And today America votes on who runs Washington for the next 2 years. That is where the title comes from, because a specific election result has a specific history behind it.
The Damage Hiding Inside The Average
Money isn't leaving the market. It's changing seats.
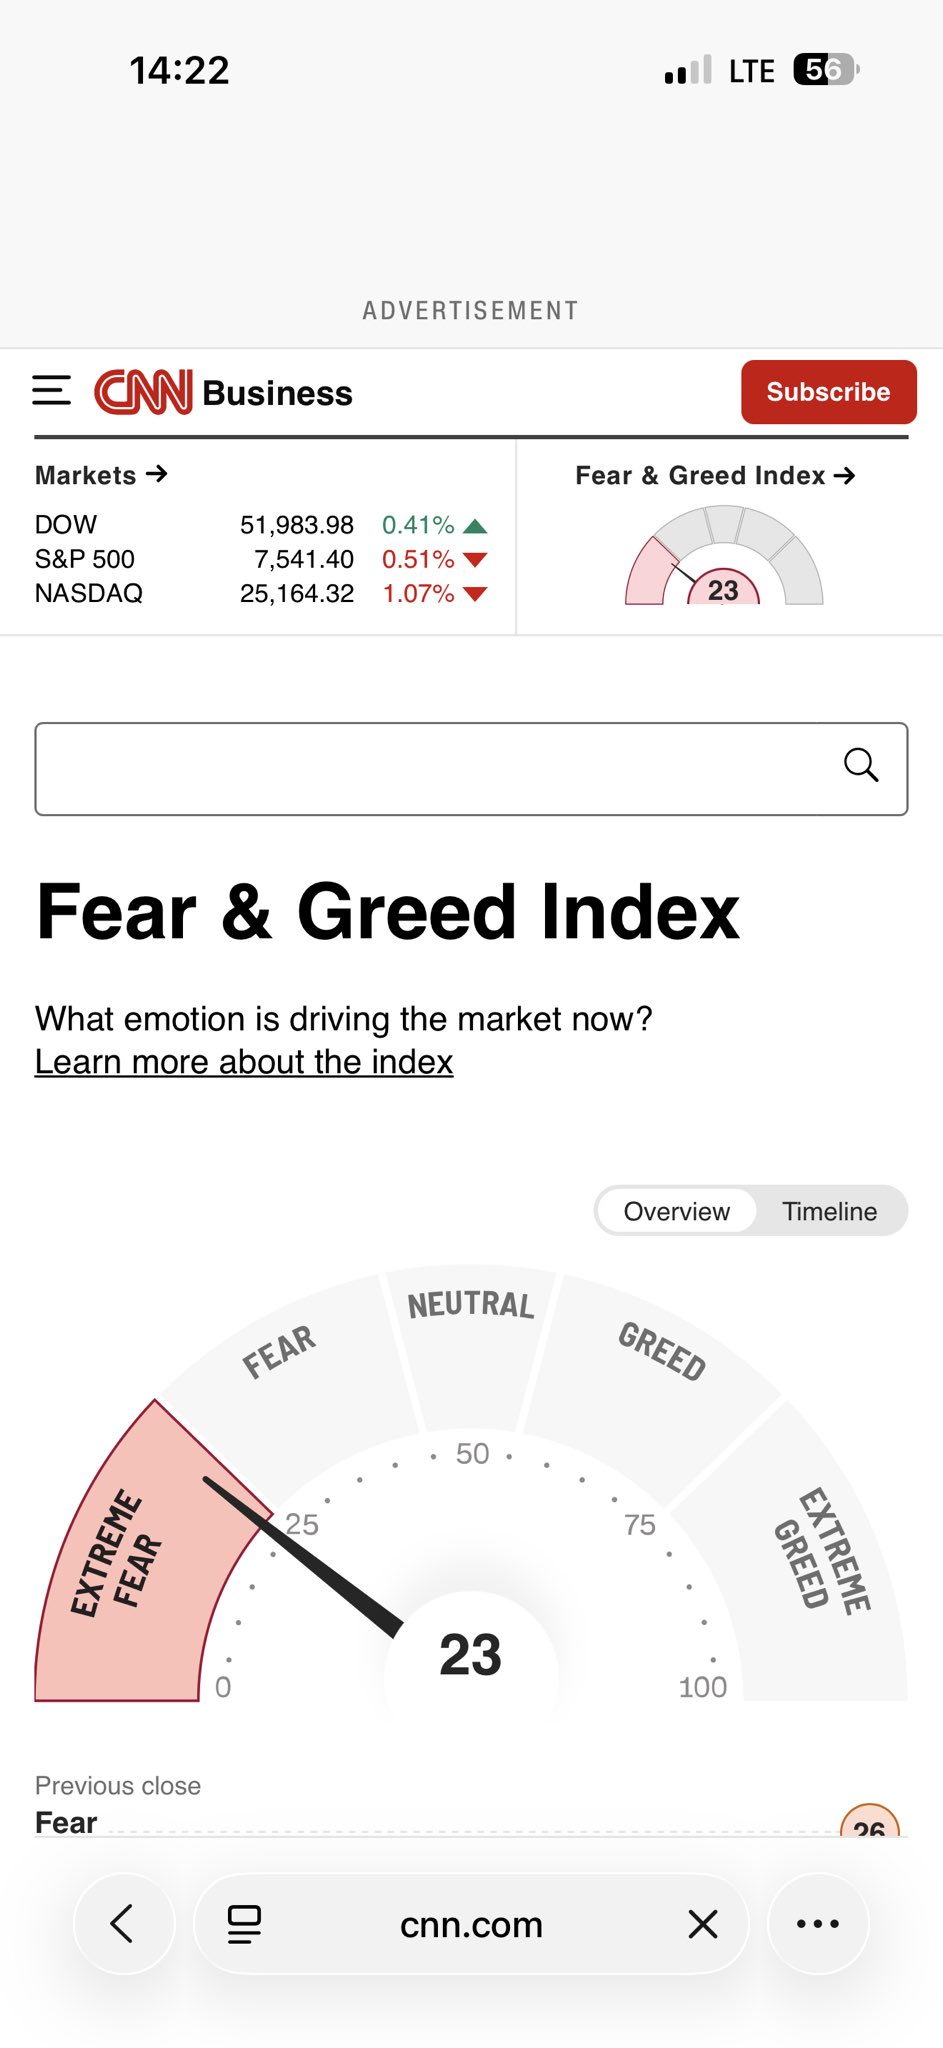
You could see it in a single day last week. The Nasdaq fell 1.07%. The Dow Jones, which leans towards older industrial companies, actually rose 0.41% on the very same day. A 10% fall from a high has a name: a correction, the stage professionals watch before a proper crash. The Nasdaq 100 is there now.
And people are frightened. CNN's Fear and Greed Index measures how nervous or greedy the market is, from 0 for blind panic to 100 for wild greed. It is sitting at 23, extreme fear. Scared people sell, and they usually sell near the bottom, not the top.
Put the damage in money
| A $200,000 technology-heavy fund | What the fall costs |
|---|---|
| A 10% fall | $20,000 gone |
| A 20% fall, and some names are well past that | $40,000 gone |
That is not a number on a screen. That is a kitchen you don't get to redo, or a year of retirement you now have to work. And the people it hurts most are not the gamblers. Picture a careful 55-year-old who put money in a big fund years ago, set it, forgot it, and never touched a meme stock. Because the fund was weighted towards the winners of the last few years, they now hold the exact stocks falling fastest, and have no idea.
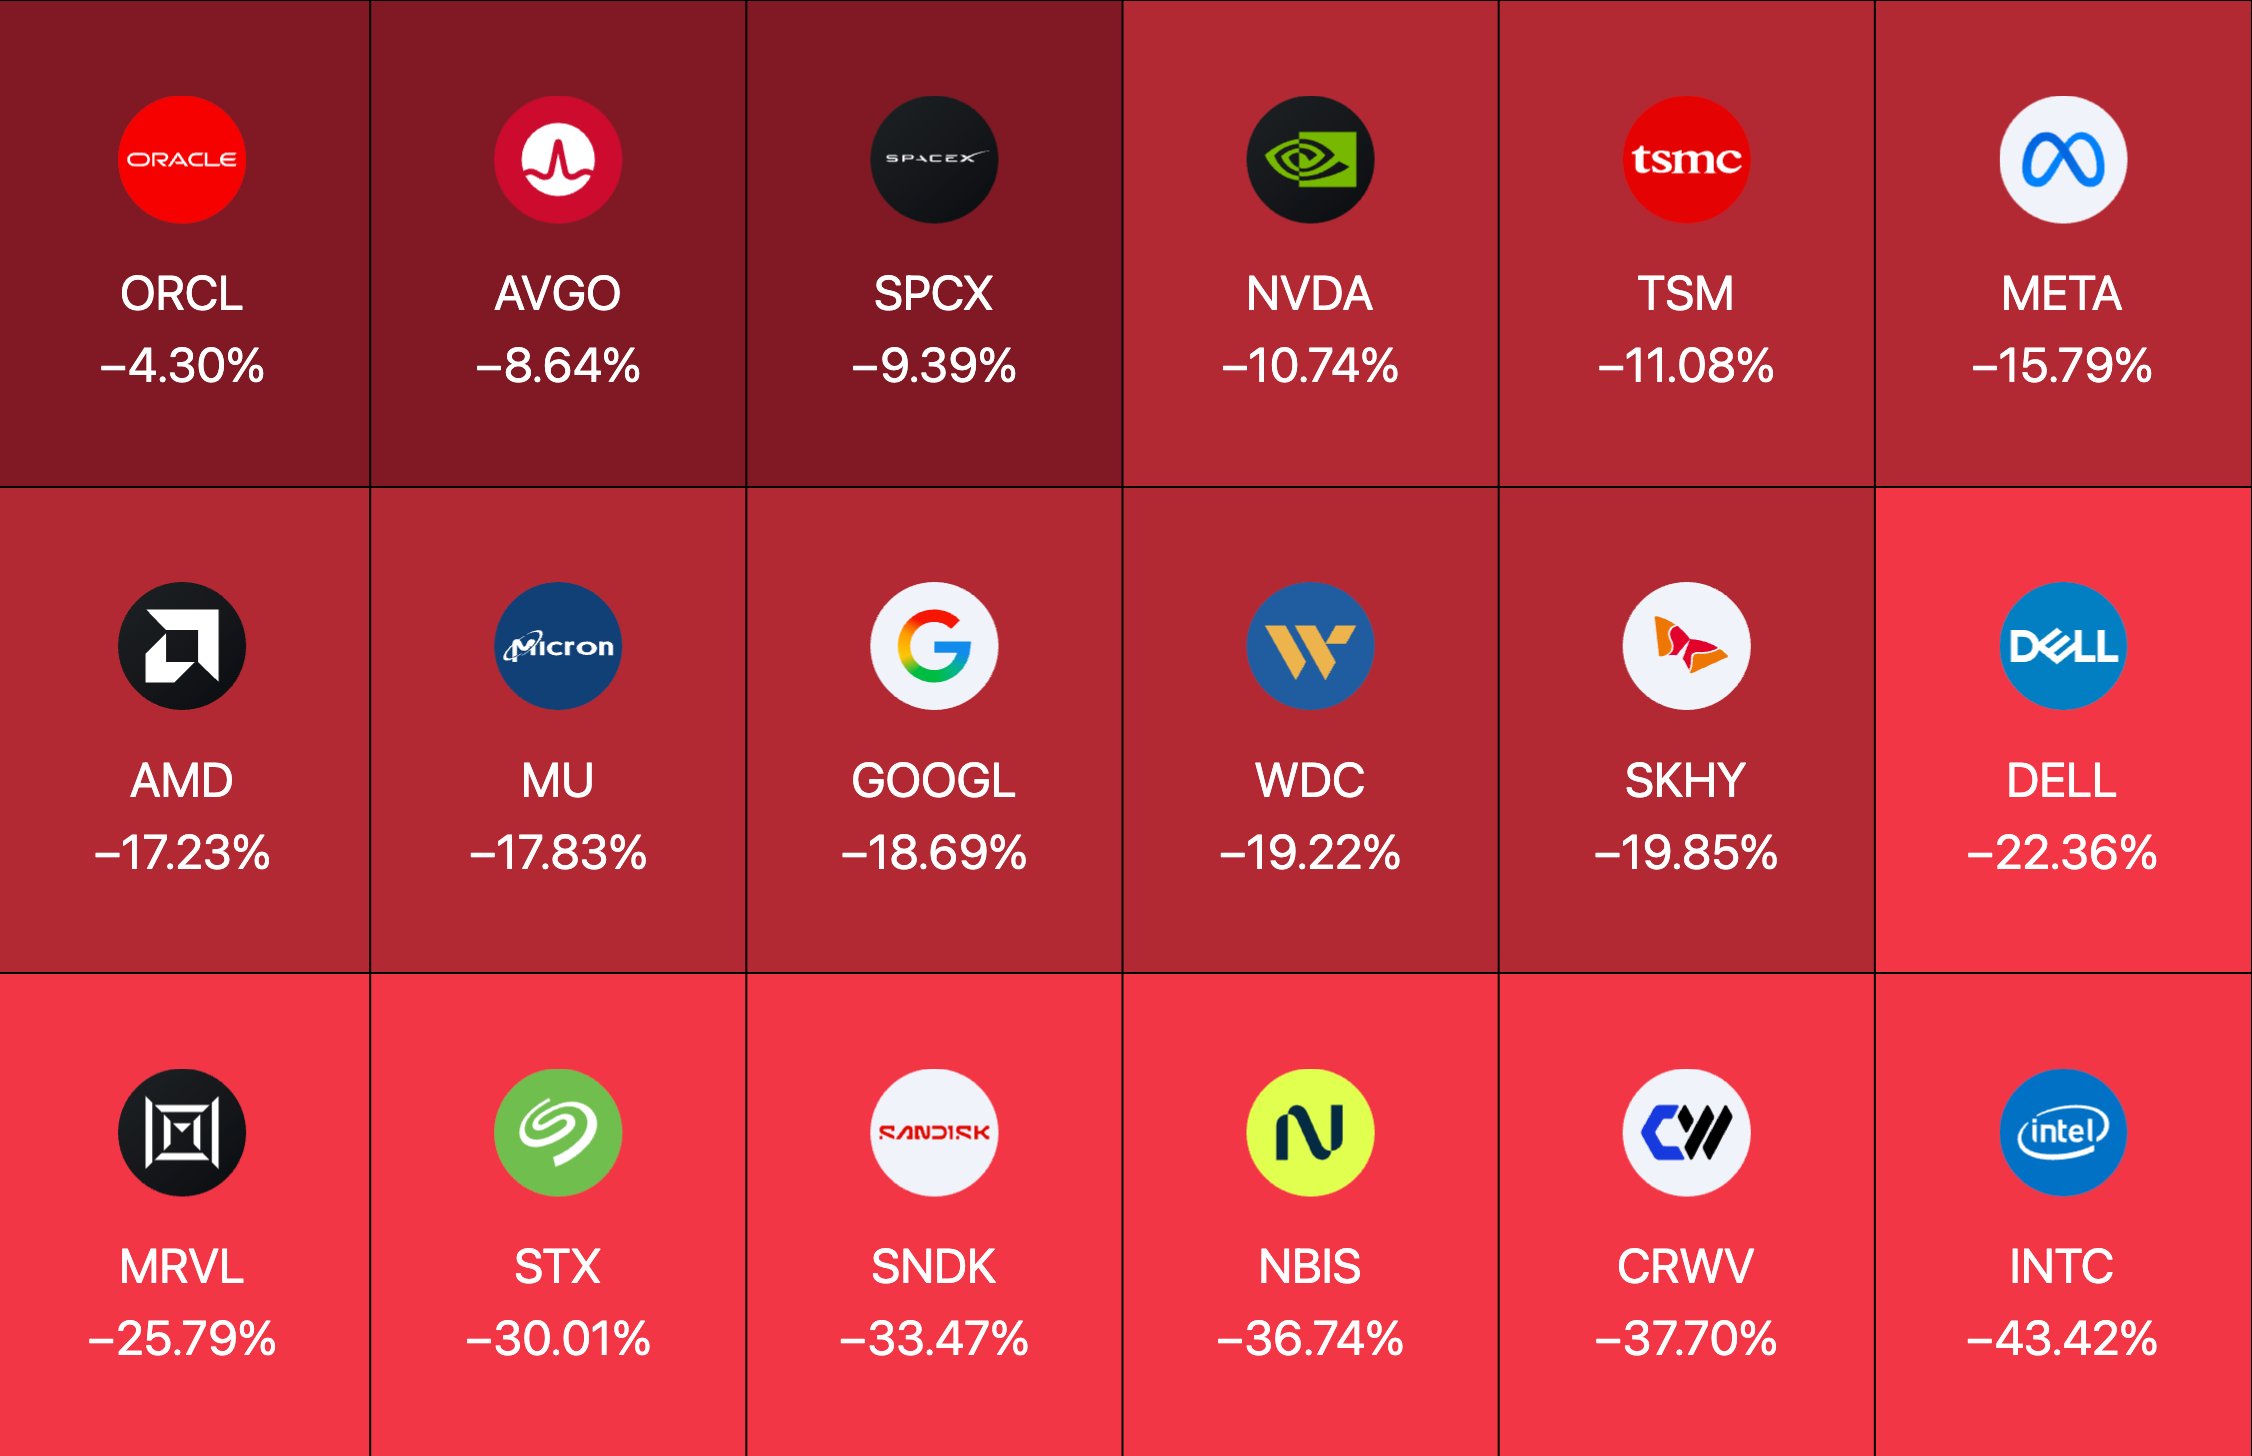
Check it in the Winston app: the Danger Zone
The Danger Zone filter flags the names in your holdings carrying the most risk right now. Run it today and the loudest names are the ones you have already heard about.
- -50%
- CoreWeave from its high
- -40%+
- Nebius from its high
- -52%
- Intel, more than halved
Spotting that before everyone else is a skill. One you were never taught, which is not your fault, but is your responsibility to learn if you want to keep what you have spent your working life building.
Why AI Cracked Now
3 things lined up at once
| The cause | What happened |
|---|---|
| Price | They got expensive. When a share climbs far faster than the company's actual profits, you pay more and more for every dollar it really earns. The moment the belief in those profits wobbles, the most expensive stocks fall the hardest, and the AI leaders were some of the most expensive stocks in the world. |
| Spending | These companies are pouring tens of billions into data centres and chips. Investors cheered it for 2 years. This earnings season the mood flipped, and the market started punishing the ones spending the most, asking when all that money comes back as profit. That is how a strong-looking result can still see shares drop double digits the next morning. |
| Backdrop | The rate the American government pays to borrow for 10 years sets the tone for everything else. When it is high, a safe government bond paying a decent return looks more attractive than a risky, expensive tech stock whose payoff is years away. Add a nervous oil price, with conflict in the Middle East keeping energy costs twitchy, and the crowd heads for the exit on the names that ran up the most. |
None of this means AI is finished. It means the price got ahead of the reality, and the market is repricing. The real question is whether something tips that repricing into something much worse. And there is a very big something on the calendar, because today America votes on who writes the rules for the next 2 years.
The Midterms
Why a blocked Washington suits Wall Street
| Going into today | House | Senate |
|---|---|---|
| Who holds it now | 218 Republicans, 214 Democrats, 1 independent, 2 vacancies | 53 Republicans, 45 Democrats, 2 independents who vote with the Democrats |
| On the ballot today | All 435 seats | 35 seats |
| What flips control | A handful of seats either way | Democrats need to net 4; a 50-50 tie is broken by Vice President Vance |
Heading into today the Democrats were favoured to take the House, leading by about 9 points on the generic ballot, the national polling question of which party you would vote for. They were narrowly favoured in the Senate too, and betting markets had a Democratic sweep at somewhere between 66% and 71%. First polls close at 6pm New York time, the last at 1am, and some races take days or weeks to call. Whoever wins, Congress has to fund the government by 11 December or risk a shutdown.
Most people treat midterms as a coin toss. They are not. The president's party has lost House seats in 18 of the last 20 midterms since the Second World War, and has gained House seats only 3 times since 1906. A split Washington after today is not a shock. It is the normal, boring, historical outcome.
The numbers back it up. From 1951 to 2023 the S&P 500 returned about 9.9% a year under divided government against 8% under one-party rule. After elections that left no single party fully in charge, the market averaged about 15% over the following year, and was positive 14 times out of 15.
Up A Year Later, Almost Every Time
The set-up in the title, 7 times since 1954
After every single one of the 19 midterms from 1950 to 2022, the S&P 500 was higher a year later, on average 16.6% higher (BNY Investments). Fidelity, using data back to 1938, puts it at 95% of the time rather than every time, so let us be honest and say almost always. It barely mattered which party won: colour every midterm by who ended up running Congress and every bar is still positive.
The set-up America might get today is specific: a Republican president coming out of the midterm facing a Democratic Congress. That has happened 7 times since 1954. A year later, stocks were up all 7 times, by about 15.5% on average.
| Republican president, Democratic Congress | 1 month after | 6 months after | 1 year after |
|---|---|---|---|
| 1954, Eisenhower | +6.9% | +19.7% | +33.2% |
| 1958, Eisenhower | +1.9% | +11.8% | +11.1% |
| 1970, Nixon | +5.1% | +22.6% | +12.7% |
| 1974, Ford | -10.3% | +19.9% | +18.7% |
| 1986, Reagan | +3.1% | +17.5% | +1.1% |
| 1990, G.H.W. Bush | +5.9% | +22.0% | +25.1% |
| 2006, G.W. Bush | +2.2% | +9.2% | +6.7% |
| Average | +2.1% | +17.5% | +15.5% |
Election-day basis, 1954 to 2006. Source: historical S&P 500 seasonality data circulated on X (burrytracker). Note: 1974 is the only negative 1-month bar. Figures should be verified against primary S&P data before any on-screen credit.
A narrower count by CNBC, looking at the 3 most recent of these, found stocks dipped half a per cent the day after the vote, then were up about 3.4% a month later and nearly 11% a year later. Same story at different speeds.
When The Pattern Hurts First
1974 is the one that looks like now
There is 1 year in those 7 that didn't go up smoothly. It went down hard first, and it is the year that looks most like right now.
The uncomfortable number
| Average S&P 500 return a year, since 1932, by control | Per year |
|---|---|
| Republican sweep | about 13% |
| Democratic sweep | about 10% |
| Republican president, split or Democratic Congress | about 5%, the weakest of any combination |
Source: RBC Capital Markets US Equity Strategy, Haver Analytics, price returns since 1932.
So both things are true at once. The year after a midterm has been strong. The whole 2-year stretch, for this particular set-up, has been the slowest of the lot. The pattern can be completely right and still hurt you first. That is why the plan uses alerts, not panic selling, and why it starts with checking what you actually own.
The Other Side
The strongest argument against all of this
In fairness, not everybody thinks this ends badly. The strongest version of the other case, which you will hear from parts of Wall Street right now, is that the market is pricing the wrong future entirely.
- Interest rates come down
- The 10-year rate drifts towards 4%
- Oil sells off after the midterms
- S&P towards 10,125 by the end of 2027
In that world the very thing that scared everyone, high oil and high rates, reverses, and the pressure on these stocks comes off. It could be right. You should always know the strongest argument against your own position.
But notice what it rests on: oil falling and rates falling. If those 2 things go the other way, the case weakens fast. And even if it is dead right about the market as a whole, a rising tide does not lift the most expensive, most crowded names first. Plenty of this cycle's tech winners could stay underwater even while the broad index makes new highs, because the money that was hiding in them has already started looking for the next leaders.
The Plan, Whoever Wins
4 steps that don't need you to guess tonight
- Check every holding you own. Not the headline on your pension app, the actual names underneath. Run your holdings through the Danger Zone filter in the Winston app and find out how much of your money is sitting in those 18 AI names. A lot of people are far more concentrated in tech than they ever intended. You can't manage a risk you can't see.
- Do not trade the election result. Whatever happens tonight, resist the urge to buy or sell on it. Vote in the booths, not in your portfolios. The market has gone up after midterms almost every single time regardless of who won, so betting your savings on the result is betting against the clearest pattern there is.
- Use alerts, not panic. Instead of selling in fear, or setting automatic sell orders that can dump your stocks at the worst possible moment, set price alerts. Let the app tell you when something you own hits a level that matters, then make a calm decision with a clear head.
- Build a watchlist to study, not a shopping list to buy. If the leadership of this market really is changing, you want to see where the money goes next before it is obvious.
| Watch in the Winston app | What it is | Why it matters |
|---|---|---|
| QQQ | The tech index itself | So you can see when the selling stops |
| SMH | The chip fund | Chips usually lead both the falls and the recoveries |
| RSP | The S&P 500 with every company weighted equally | The real health of the average stock under the top-heavy headline index |
Know what you own. Don't trade the result. Use alerts. Study where the money's moving. And to say it plainly: this is about understanding your own risk, not chasing the next hot thing.
Learn To Read A Market Pivot
The Great Pivot
This sell-off is not over. It might pause, it might even bounce for a few weeks and tempt everyone back in. But when the real move comes, it won't be a few per cent, and it will hit the people who felt safest, because the index looked calm right up until it didn't.
Spotting a change in market leadership early is a skill. Nobody taught it to you at school, and that isn't your fault. But if you want to protect what you have built, it is worth learning.
The goal is not to hand you a long stock list to run out and buy. The goal is to give you the skill, so you can make your own list, for this pivot and for the next one. We're not going to panic. We're going to have a plan.
Disclaimer
This briefing is for educational purposes only and does not constitute financial advice. It is not a recommendation to buy or sell any asset or security. All investment carries risk, including the loss of principal. Past performance is not indicative of future results. The Prehn Institute takes no sponsorships or endorsements.