
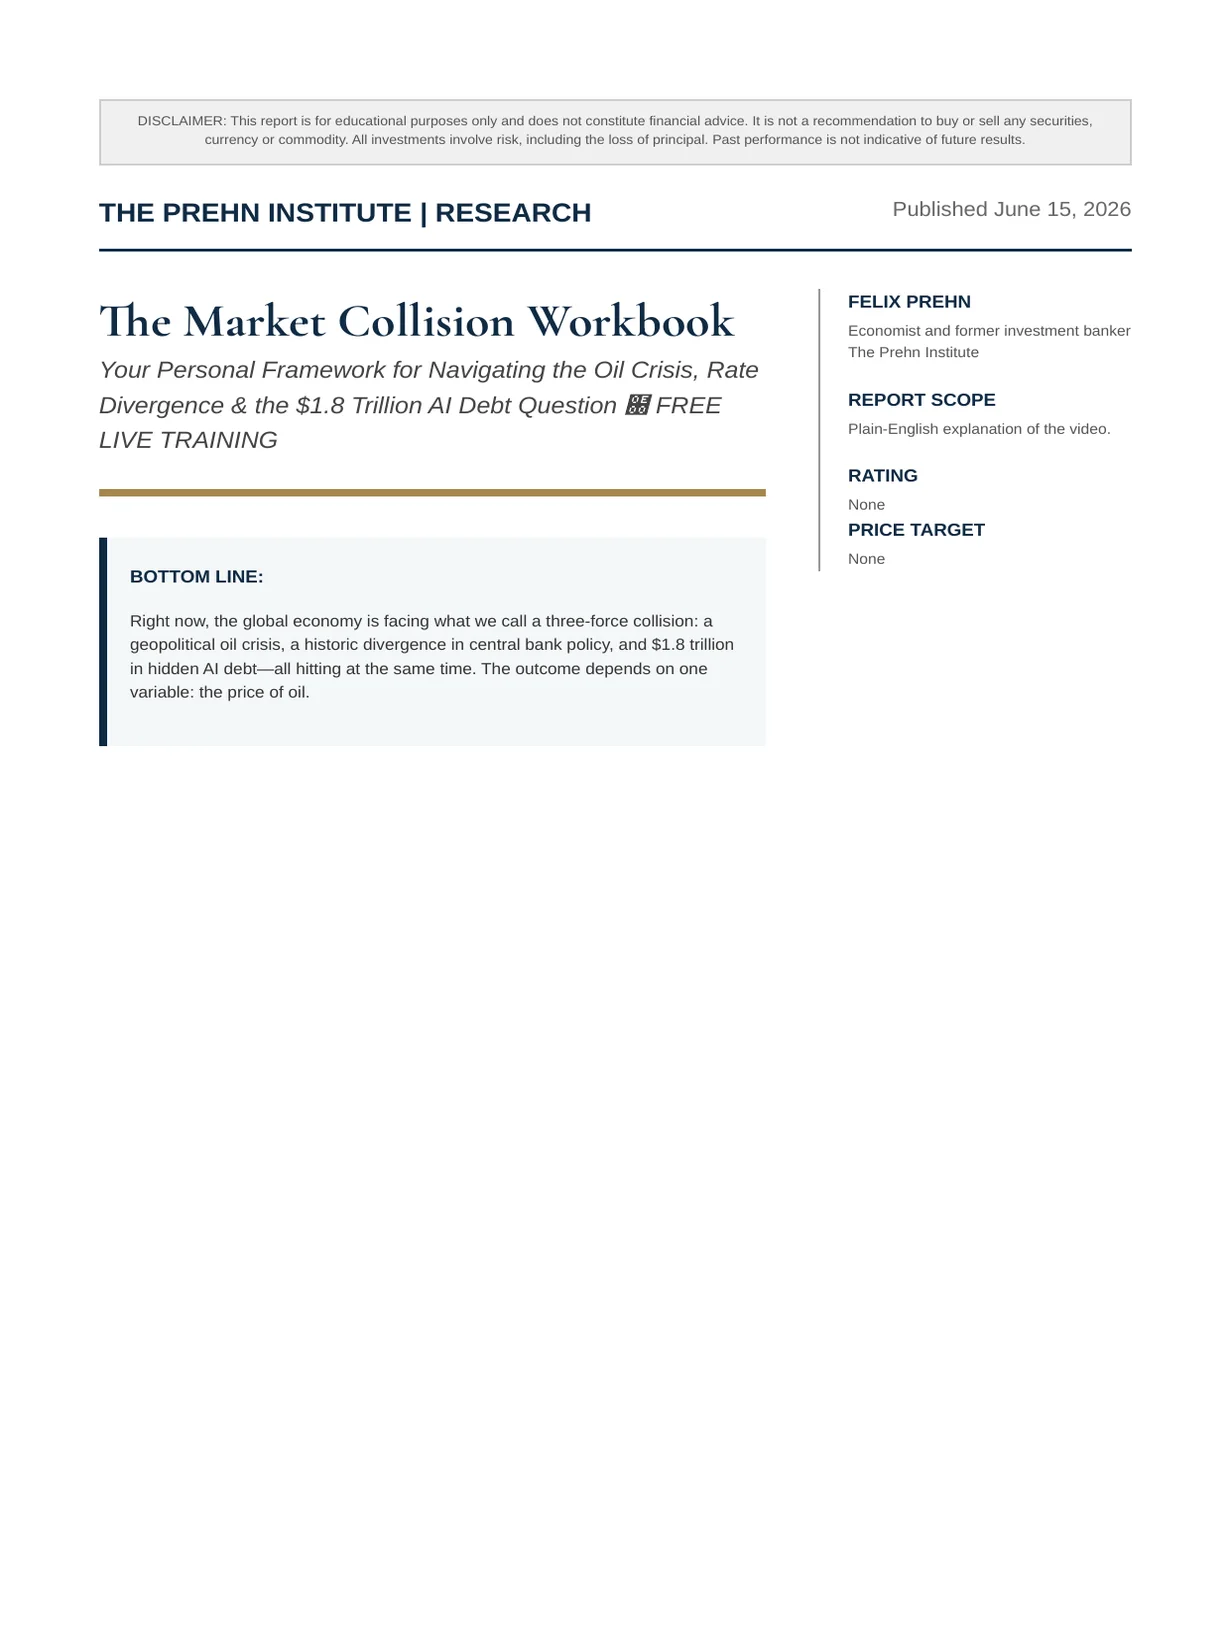
The Market Collision Workbook
Your Personal Framework for Navigating the Oil Crisis, Rate Divergence & the $1.8 Trillion AI Debt Question FREE LIVE TRAINING
Felix Nikolas Prehn · 15 June 2026 · 31 pages
Bottom line
Right now, the global economy is facing what we call a three-force collision: a geopolitical oil crisis, a historic divergence in central bank policy, and $1.8 trillion in hidden AI debt—all hitting at the same time. The outcome depends on one variable: the price of oil.
The Market Collision Workbook
Section 1: The Collision Thesis — Understanding the Two Worlds
Right now, the global economy is facing what we call a three-force collision: a geopolitical oil crisis, a historic divergence in central bank policy, and $1.8 trillion in hidden AI debt—all hitting at the same time. The outcome depends on one variable: the price of oil.
WORLD #1 — WALL STREET'S BET
The thesis: Iran conflict escalates → oil spikes to $120–$150
- inflation spirals → Fed forced to raise rates → recession
Result: Stocks crash, housing freezes, 401(k)s take a beating.
WORLD #2 — THE PEACE PLAY
The thesis: Iran conflict ends → oil floods the market → inflation dies → Fed holds or cuts rates → economy booms
Result: Stocks rip higher, housing recovers, consumer spending surges.
KEY INSIGHT: These two worlds are mutually exclusive. There is very little middle ground. If you are positioned for the wrong world, your portfolio gets cut in half. If you are positioned for the right one, this could be the greatest buying opportunity since 2020.
✏ EXERCISE 1: WHICH WORLD IS YOUR PORTFOLIO BUILT FOR? Before going further, answer honestly:
- How much of your portfolio assumes oil stays high and rates go up?
0% 25% 50% 75% 100%
- If a peace deal were announced tomorrow and oil dropped 40%, how would your portfolio react? It would mostly go UP (positioned for cheap oil) It would mostly go DOWN (positioned for expensive oil) I honestly don't know
- List your 5 largest holdings. For each, write whether it benefits from cheap oil (C) or expensive oil (E):
| Holding / Ticker | % of Portfolio | Cheap Oil (C) or Expensive Oil (E)? |
|---|
Analyst: Winston
The Market Collision Workbook
Why This Collision Matters to You
This is not abstract geopolitics. The oil–rate collision directly affects three things every American investor cares about:
| What You Own | If Oil Stays High | If Oil Drops |
|---|---|---|
| Your 401(k) | Funds loaded with stocks that bust | Funds loaded with stocks that boom |
| Your Mortgage | Monthly payment could jump hundreds of dollars | You could refinance and save thousands |
| Your Portfolio | Survives if positioned correctly, crushed if not | Thrives if positioned early |
THE GOOD NEWS: The framework we teach in this workbook works regardless of who is president. It is not about politics—it is about understanding what cheap oil does versus what expensive oil does to every single asset class. Once you learn this, you can use it for the rest of your investing life.
The framework is called The Peace-to-Prosperity Pipeline:
3 Forces that drive everything
5 Waves — the order that capital moves through the economy
6 Sectors — where money flows and where it disappears
✏ EXERCISE 2: YOUR PERSONAL STAKES
What is the single biggest financial decision you need to make in the next 12 months? (e.g., refinancing, buying a home, retiring, rebalancing, etc.)
How would that decision change if oil dropped 40%? How would it change if oil doubled?
Analyst: Winston
The Market Collision Workbook
Section 2: The Peace-to-prosperity Pipeline Framework
The framework has three forces that work together like dominos. When one falls, the others follow in a predictable sequence.
FORCE 1: The Oil Lever How peace becomes cheap energy
▼
FORCE 2: The Rate Divergence America holds while Europe breaks
▼
FORCE 3: The Confidence Collision
When Wall Street's models break
Each force triggers the next. The sequence is predictable. Once you see it, you can position AHEAD of it.
The Market Collision Workbook
The Two Pathways — Complete Chain Reaction
SCENARIO A: THE PEACE PATHWAY
Peace Deal ▼ Cheap Oil ▼ Inflation Drops ▼
Fed Holds/Cuts Rates
▼
AI Debt Stays Manageable
▼
Economy Grows → Stocks Rip
SCENARIO B: THE WAR PATHWAY
War Escalates
▼ Oil Spikes ▼
Inflation Explodes
▼
Fed Forced to Raise
▼
AI Debt Implodes
▼
Recession → Stocks Crash
THE ASYMMETRY: Right now, Wall Street is almost entirely positioned for Scenario B (the war pathway). That means if Scenario A hits—the peace pathway—the repricing will be violent and fast. That is where fortunes get made.
Analyst: Winston
The Market Collision Workbook
Section 3: Force 1 — The Oil Lever
Oil is not just about gas prices. Oil is baked into everything: shipping, food production, plastics, chemicals, and manufacturing. When oil drops 30%, the price of nearly everything follows—with a 60-to-90-day lag.
The Market Collision Workbook
The Oil Cascade — How Price Drops Flow Through the Economy
OIL PRICE DROPS
▼
Energy Companies Reprice (within days)
▼
Transportation Costs Fall (30–60 days)
▼
Consumer Prices Drop (60–90 days)
▼
Manufacturing Costs Decline (90–180 days)
The Market Collision Workbook
Historical Pattern
| Event | What Happened to Oil | Economic Result |
|---|---|---|
| End of Gulf War (1991) | Oil dropped sharply | Economy boomed within 6 months |
| Iran Nuclear Deal (2015) | Oil crashed from ~$100 to below $50 | Consumer spending surged |
| Pattern: Peace → Cheap Energy → Economic Growth. Every. Single. Time. |
Wall Street's Blind Spot — Your Edge
Every major bank's models assume war continues and oil stays at $120–$150. If oil drops to $60–$70, those models break. Institutions are forced to rebalance—but they operate on quarterly cycles, meaning they are 60–90 days behind. A retail investor can move in hours.
THE SPEEDBOAT ADVANTAGE: Institutions are aircraft carriers—massive, but they take 5 miles to turn. You are a speedboat. Use that.
Analyst: Winston
The Market Collision Workbook
Force 1 Worksheet: Oil Lever Self-assessment
- List every holding in your portfolio that would be HURT by a 40% oil price drop:
| Holding | % of Portfolio | Estimated Impact if Oil Drops 40% |
|---|
- List every holding that would BENEFIT from a 40% oil price drop:
| Holding | % of Portfolio | Estimated Upside if Oil Drops 40% |
|---|
- Your Oil Exposure Score:
Add up the "% of Portfolio" that gets HURT by an oil drop. This is your oil-risk concentration.
LOW RISK HIGH RISK
0–15% = Low Risk | 15–35% = Moderate Risk | 35%+ = High Risk — one peace deal away from trouble
My oil-risk concentration: _____%
✏ EXERCISE 4: THE CASCADE TIMELINE For each stage of the oil cascade, write one holding or sector in your portfolio that would be affected:
| Cascade Stage | Timing | Your Holding / Sector Affected |
|---|---|---|
| Energy Repricing | Within days | |
| Transportation Benefit | 30–60 days | |
| Consumer Relief | 60–90 days | |
| Manufacturing Renaissance | 90–180 days |
The Market Collision Workbook
Section 4: Force 2 — The Rate Divergence
For the first time in modern financial history, America and Europe are running opposite monetary policies during the same global event.
AMERICA'S PLAY
Fed holding rates at 3.50%–3.75% FOMC vote: 8–4 split (most divided since 1992) Strategy: Resist rate hikes, kill inflation through supply (cheap energy), not demand destruction Balance sheet quietly growing again — back above $6.7 trillion
EUROPE'S TRAP
ECB raising rates into a shrinking economy GDP contracting, manufacturing in recession Europe's only tool: raise rates and hope Cannot control oil supply, print reserve currency, or negotiate peace
The Market Collision Workbook
Why This Matters: Capital Flows
When rates diverge this dramatically, capital flows shift massively. Money flows toward higher returns and stability. The last time the US and Europe diverged this hard on rates was 2014–2015. What happened? Massive capital inflow to the US. The dollar surged. European stocks underperformed American stocks for over 3 years.
PORTFOLIO CHECK: A lot of "international diversification" funds are 40–50% European stocks. That diversification could be dragging your returns. Check your fund allocations.
✏ EXERCISE 5: RATE DIVERGENCE EXPOSURE CHECK
- List your international or global funds and their European allocation:
| Fund Name / Ticker | % of Portfolio | Estimated % in European Stocks |
|---|
TIP: Check your fund's fact sheet online for country allocation. Most "Total International" funds are 40–50% Europe.
- Rate Divergence Framework: Circle your current positioning:
Overweight US (correct for rate divergence) Overweight Europe (exposed to underperformance) Evenly split (partially exposed) I need to check my allocations
Analyst: Winston
The Market Collision Workbook
The Rate Divergence — Reference Table
| Metric | United States | Europe (Eurozone) |
|---|---|---|
| Policy Rate | 3.50%–3.75% (holding) | 2.25%–2.40% (hiking) |
| Direction | Holding / dovish bias | Raising into weakness |
| GDP Trend | Positive but slowing | Contracting (Q1 -0.2%) |
| Manufacturing | Stable | In recession (Germany, France, Italy) |
| Inflation Strategy | Supply-side fix (cheap energy) | Demand destruction (raise rates) |
| Energy Independence | Net exporter of oil & gas | Imports nearly all energy |
| Reserve Currency | Yes (USD) | No |
| FOMC/ECB Vote | 8–4 split (most divided since 1992) | Unanimous (forced consensus) |
| Balance Sheet | $6.7T and growing | Shrinking via QT |
| Historical Precedent (2014–15) | Outperformed 3+ years | Underperformed 3+ years |
✏ EXERCISE 6: THE EUROPE EXPOSURE CALCULATION Calculate your total European stock exposure as a percentage of your entire portfolio:
Formula: (Fund A × its Europe %) + (Fund B × its Europe %) + ... = Total Europe Exposure
My total Europe exposure: _____%
Guideline: Under extreme rate divergence, 15%+ European exposure creates drag risk on your portfolio.
Analyst: Winston
The Market Collision Workbook
Section 5: Force 3 — The Confidence Collision & the $1.8T AI Debt
Institutional investors follow computer models. Right now, every major bank's model assumes three things: (1) War continues, (2) Oil stays above $100, (3) The Fed raises rates. All three could be wrong at the same time.
The Market Collision Workbook
What Happens When Consensus Breaks
When every big investor is positioned for the same outcome and the opposite happens, the market moves violently. Model-dependent funds are forced to rebalance—all at the same time—creating massive, fast price swings.
Precedent — Early 2020: Nobody expected the recovery to be that fast. But the stimulus was massive, rates went to zero, and the market ripped higher. That recovery minted more new millionaires than any 12-month period in market history. The money was made by people who positioned for the recovery.
The Market Collision Workbook
The $1.8 Trillion AI Debt Wildcard
Whether this debt is a crisis or a goldmine depends entirely on which world materializes:
IF RATES RISE
$1.8T in debt becomes incredibly expensive to service Hyperscaler leverage has doubled: 0.9x → 1.8x Like the 2008 mortgage crisis — debt that seemed fine at low rates becomes toxic when rates spike
IF RATES STAY LOW
$1.8T in debt stays cheap to service AI bets get time to pay off Companies survive and investments start generating revenue
SAME DEBT. SAME COMPANIES. COMPLETELY OPPOSITE OUTCOME. The variable? Interest rates. This is why the oil → inflation → rates chain matters so much—it determines whether $1.8 trillion in AI debt becomes a growth engine or a time bomb.
✏ EXERCISE 7: AI DEBT BALANCE SHEET TEST For any AI or tech stock you own, check: What percentage of operating cash flow is being consumed by capital expenditures?
| AI/Tech Holding | CapEx as % of Operating Cash Flow | Safe (40–60%) or Danger (90%+)? |
|---|
TIP: Companies spending 90%+ of cash flow on CapEx are the dangerous ones. Companies at 40–60% with clear monetization paths are the opportunities. This 5-minute balance sheet test can protect your portfolio.
Analyst: Winston
The Market Collision Workbook
Force 3 Worksheet: Consensus Break Readiness
For each assumption that Wall Street's models are built on, write your own probability estimate:
| Wall Street's Assumption | Your Probability Estimate (0–100%) | What If They're Wrong? |
|---|---|---|
| 1. War continues in the Middle East | ||
| 2. Oil stays above $100/barrel |
- The Fed raises interest rates
If all three assumptions are wrong simultaneously, how would your portfolio react?
✏ EXERCISE 9: YOUR CONSENSUS-BREAK POSITIONING What percentage of your portfolio is positioned for the outcome NOBODY is betting on (the peace pathway)?
0% 5% 10% 15% 20% 25%+
Recommended: 10–20% exposure to the contrarian outcome. Enough to capture upside without betting the house.
FREE LIVE TRAINING
First & Only LIVE Training on
"How to Turn the IPO Summer into a 5-Year Wealth Machine"
Get Your Free Seat →
Analyst: Winston
The Market Collision Workbook
Section 6: The Five Waves of Capital Flow
When geopolitical risk collapses, capital does not flow into everything at once. It moves in a predictable sequence, like dominos. Most investors only see Wave 1 and panic. The real money is made in Waves 3 through 5.
Energy Repricing (First 30 Days) Oil and gas stocks reprice almost overnight. Energy futures collapse. This is the wave that makes headlines—but it is NOT where the big money is made.
Transport & Logistics (30–60 Days) Airlines, shipping, and trucking see costs drop while prices stay the same. That gap is called margin expansion—and it is profit gold.
Consumer Relief (60–90 Days) Gas prices drop → people have more money → they spend on restaurants, vacations, appliances. This is where Main Street finally feels the benefit.
Manufacturing Renaissance (90–180 Days) Lower input costs make it cheaper to produce goods in America. US manufacturing becomes globally competitive again. Industrials rerate higher.
The Credit Unlock (180+ Days) Lower inflation → Fed can cut rates → mortgage rates drop → housing explodes. Autos, big-ticket purchases, everything requiring a loan unlocks.
THE PATIENT INVESTOR'S EDGE: Most investors only see Wave 1 and panic-sell their energy stocks. The real money—the generational wealth—is made in Waves 3 through 5. That is where the patient investor wins.
Analyst: Winston
The Market Collision Workbook
Five Waves Worksheet: Map Your Holdings to the Waves
For each wave, list holdings in your portfolio (or watchlist) that would benefit. This helps you see which waves you are exposed to—and which you are missing.
| Wave | Timing | Your Holdings That Benefit | Missing? (Y/N) |
|---|---|---|---|
| Wave 1 — Energy | 0–30 days | ||
| Wave 2 — Transport | 30–60 days | ||
| Wave 3 — Consumer | 60–90 days | ||
| Wave 4 — Manufacturing | 90–180 days | ||
| Wave 5 — Credit/Housing | 180+ days |
Which waves are you most exposed to?
Which waves are you completely missing?
What is one holding you could add to fill your biggest wave gap?
✏ EXERCISE 11: THE "FIRST MOVERS VS. LAGGARDS" TEST In each wave, some sectors benefit first and some benefit last. Position for the first movers — by the time the laggards catch up, the easy money is made.
| Wave 3 — Consumer | First Movers ✅ | Laggards |
|---|---|---|
| Examples | Travel, restaurants, auto dealers | Appliances, furniture, electronics |
| Your holdings |
Analyst: Winston
The Market Collision Workbook
Section 7: Six Sector Scorecards
For each of the six sectors most affected by the collision, we outline what happens in both worlds. Use the scorecards to assess your own exposure.
SECTOR 1: ENERGY
CHEAP OIL WORLD
Risk: Oil & gas producers drop 25–40%. Most portfolios are overweight energy right now.
Opportunity: Infrastructure (pipelines, LNG terminals) does fine—volume increases even if price drops. Shift from producers to infrastructure.
EXPENSIVE OIL WORLD
Risk: Energy stocks rip higher short-term, but sustained high oil kills demand, triggers recession.
Key: "High oil is great for energy stocks for about 6 months. Then it destroys the economy that buys the oil."
SECTOR 2: AIRLINES & TRANSPORTATION
CHEAP OIL WORLD
Opportunity: Fastest margin expansion of any sector. Historically 2–3x returns within 12 months of a major oil decline.
EXPENSIVE OIL WORLD
Risk: Fuel is 30–40% of costs. At $100+ oil, airline margins get destroyed.
Early Signal: Watch jet fuel futures — they move 2–3 weeks before airline stocks. That lag is your window.
SECTOR 3: TECHNOLOGY / AI
LOW RATES
Opportunity: $1.8T debt stays cheap. AI bets get time to pay off. Greatest tech buying opportunity since late 2022. Global AI spending projected at $2.52 trillion this year.
HIGH RATES
Risk: Hyperscaler leverage doubled (0.9x → 1.8x). Off- balance-sheet commitments become toxic. Morgan Stanley calls it "AI subprime."
The Filter: CapEx as % of operating cash flow: 90%+ = danger. 40–60% with clear monetization = opportunity.
Analyst: Winston
CHEAP OIL WORLD
Opportunity: Consumers get hundreds of extra dollars per month. That money goes to restaurants, travel, home improvement. This is Wave 3—one of the biggest wealth- creation opportunities historically.
EXPENSIVE OIL WORLD
Risk: Energy prices up 23%+ YoY. Gas at $4–$5/gallon eats into every household budget. Retail stocks could get much worse.
Timing: Travel and restaurants benefit first. Appliances and furniture benefit last.
SECTOR 5: REAL ESTATE & HOUSING
RATES HOLD/DROP
Opportunity: Mortgage rates come down → demand surges. REITs and homebuilders can rerate 30–50% higher. A 0.5% rate drop increases affordability by ~5–6%.
RATES RISE
Risk: Housing freezes again. Buyers stuck at peak rates. Commercial real estate already in trouble—offices empty, defaults rising.
The Math: On a $400K home, 0.5% rate change = difference between qualifying and not for millions of families.
SECTOR 6: INTERNATIONAL / EUROPEAN EXPOSURE
SELECTIVE OPPORTUNITY
European exporters selling into a strong US dollar actually benefit. Pockets of value at historic discounts—but be surgical, not broad.
THE RISK
Raising rates into a recession. European stocks could underperform US by 30%+ over 2 years. Most "international" funds are 40–50% Europe.
Framework: Overweight the country holding rates low (US). Underweight the country raising rates into weakness (Europe).
Analyst: Winston
The Market Collision Workbook
Six Sector Scoring Worksheet
For each sector, estimate your current portfolio weighting and score your readiness for both scenarios. Rate 1 (not ready) to 5 (well positioned).
| Sector | Your Current Weighting (%) | Peace Scenario Readiness (1–5) | War Scenario Readiness (1–5) |
|---|---|---|---|
| 1. Energy | |||
| 2. Airlines/Transport | |||
| 3. Tech/AI | |||
| 4. Consumer/Retail | |||
| 5. Real Estate | |||
| 6. International/Europe |
Biggest vulnerability:
Biggest opportunity I am currently missing:
✏ EXERCISE 13: EARLY SIGNALS TO WATCH From the video, these are the key early signals for each sector. Write the current reading or set a reminder to check:
| Signal | What It Tells You | Where to Check |
|---|---|---|
| Jet fuel futures | Airlines about to move (2–3 week lead) | |
| CapEx / Operating Cash Flow ratio | AI stock safety test | |
| FOMC voting split | Fed direction shifting | |
| ECB rate decisions | Europe's desperation level | |
| Diplomatic signals | Peace deal probability |
Analyst: Winston
The Market Collision Workbook
Sector Deep-dive Notes
Use this page to take notes on each sector as you watch the video. Write down specific tickers, ETFs, or trades you want to research further.
ENERGY — NOTES & TICKERS TO RESEARCH
AIRLINES / TRANSPORT — NOTES & TICKERS TO RESEARCH
TECH / AI — NOTES & TICKERS TO RESEARCH
CONSUMER / RETAIL — NOTES & TICKERS TO RESEARCH
REAL ESTATE — NOTES & TICKERS TO RESEARCH
INTERNATIONAL / EUROPE — NOTES & TICKERS TO RESEARCH
Analyst: Winston
The Market Collision Workbook
Section 8: Your Personal Portfolio Audit
This is the master exercise. Pull up your brokerage account and fill in the table below. Be honest—this is for your eyes only.
| Holding / Ticker | % of Portfolio | Sector | Wave (1–5) | Cheap Oil: or ? | Expensive Oil: or ? | Action Needed? |
|---|
Analyst: Winston
The Market Collision Workbook
Portfolio Audit Summary
Total % positioned for expensive oil (war pathway): _____%
Total % positioned for cheap oil (peace pathway): _____%
Total % neutral / unaffected: _____%
Wave coverage:
Wave 1 (Energy) — I have exposure Wave 2 (Transport) — I have exposure Wave 3 (Consumer) — I have exposure Wave 4 (Manufacturing) — I have exposure Wave 5 (Credit/Housing) — I have exposure
My portfolio's biggest blind spot is:
The single most important change I need to make:
Analyst: Winston
The Market Collision Workbook
Section 9: The 4-Step Action Plan
Do not just read this and forget it. Here are four steps you can take this week.
Audit Your Portfolio Ask: how much of my portfolio is built on the assumption that war continues and oil stays high? If "most of it"—you are one peace deal away from a serious problem. (You did this in Section 8.)
Identify Your Wave 3-to-5 Positions These are the sectors that benefit from the outcome nobody is positioned for: airlines, consumer discretionary, housing, manufacturing—the downstream beneficiaries.
Size Your Risk This is NOT "go all in on peace." That is gambling. This is about having some exposure to the outcome the market is not pricing. Maybe 10–20% of your portfolio. Enough to capture the upside without betting the house.
Set Your Triggers Specific oil price levels. Specific rate decisions from the Fed and ECB. Specific geopolitical signals. Do not wait for CNBC to tell you what happened. Set your triggers NOW so you move WHEN it happens.
✏ EXERCISE 16: MY PERSONAL ACTION PLAN Step 1 — My audit result (from Section 8):
Step 2 — Wave 3–5 positions I want to research:
Step 3 — The % of my portfolio I will allocate to the peace-pathway positions: _____%
Step 4 — My triggers (fill in on next page):
Analyst: Winston
The Market Collision Workbook
Trigger Sheet — Your Decision Framework
Set these triggers NOW so you act with confidence when the signal hits. Do not make emotional decisions in the moment.
| Trigger Category | Signal to Watch | My Action If This Happens |
|---|---|---|
| Oil Price — Peace Signal Oil drops below $_____/barrel | ||
| Oil Price — War Signal | ||
| Oil rises above $_____/barrel | ||
| Fed Decision | ||
| Fed raises / holds / cuts | ||
| ECB Decision | ||
| ECB hikes again / pauses | ||
| Geopolitical Signal | ||
| Ceasefire / escalation / deal | ||
| Jet Fuel Futures | ||
| Drop below $____/gallon |
REMEMBER: History shows us that when consensus is this strong in one direction, the money is usually made betting on the other— IF you manage your risk. The question is not whether the collision is coming. It is whether you will be positioned on the right side of it.
90% of investors have no idea it's coming. You are not in the 90% anymore.
FREE LIVE TRAINING
First & Only LIVE Training on
"How to Turn the IPO Summer into a 5-Year Wealth Machine"
Get Your Free Seat →
Analyst: Winston
The Market Collision Workbook
Section 10: Sources & Further Reading
| # | Data Point | Source |
|---|---|---|
| 1 | $1.8T off-balance-sheet AI exposure | Morgan Stanley via ZeroHedge; confirmed by PIMCO AI credit analysis |
| Hyperscaler leverage 0.9x → 1.8x | Morgan Stanley; confirmed by Moody's leasing data via Futu | |
| CPI 4.2% YoY, Energy +23.5% YoY | BLS CPI Report (May 2026); confirmed by Reuters | |
| Fed Funds Rate 3.50–3.75%, 8-4 vote | Federal Reserve FOMC Statement (April 2026); confirmed by CNBC | |
| Fed balance sheet $6.7T+ | ||
| American Action Forum Fed Balance Sheet Tracker; confirmed by Federal Reserve H.4.1 | ||
| data | ||
| ECB rate hike into GDP contraction | ECB Press Release (June 2026); confirmed by The Guardian | |
| Eurozone GDP -0.2% Q1 2026 | ECB Staff Projections; confirmed by European Commission Spring Forecast | |
| Oil $120–$150 Wall Street consensus | Oxford Economics via Fortune; Exxon Mobil via CNBC | |
| Strait of Hormuz — 20% of global oil | Brookings Institution; confirmed by EIA | |
| Historical oil/peace patterns (1991, 2015) | EIA Historical Oil Price Data; confirmed by FRED | |
| 2014-15 US/Europe rate divergence | Federal Reserve Economic Data (FRED); MSCI Europe vs S&P 500 data | |
| Global AI spending $2.52T in 2026 | Gartner Press Release (Jan 2026); confirmed by CNBC | |
| Airline fuel cost 30–40% of OpEx | IATA Industry Economics; confirmed by SEC 10-K filings | |
| 0.5% mortgage rate drop = ~5-6% affordability | ||
| gain | ||
| Freddie Mac; confirmed by Bankrate mortgage calculator |
About Felix Prehn and The Prehn Institute
Felix Prehn is a former investment banker. He gained deep insights into the strategies and principles that professional investors use to build and protect wealth.
The Prehn Institute Felix Prehn is the founder of The Prehn Institute, an educational platform that has taught over 20,000 students the fundamentals of investing and stock market analysis. The Prehn Institute focuses on demystifying Wall Street's investment strategies and making them accessible to regular investors. The academy provides comprehensive training on fundamental analysis, technical analysis, risk management, and portfolio construction—empowering individual investors to make informed decisions about their financial futures.
Tradevision.io Felix Prehn is also the co-founder of Tradevision.io, a platform dedicated to providing news and data specifically tailored for retail investors. Tradevision.io helps individual investors access the information and tools they need to compete effectively in modern financial markets.
Mission and Dedication Felix Prehn has dedicated his retirement to teaching regular investors how to protect their wealth and navigate the complexities of the stock market. His approach emphasizes understanding the fundamental principles that drive long-term investment success, rather than chasing short-term trends or speculation. By bridging the knowledge gap between Wall Street professionals and individual investors, Felix works to level the playing field and help people take control of their financial destinies.
Connect with Felix Prehn on YouTube youtube.com/felixfriends