
The day Iran makes peace, stocks break out
And why gold could be next. What a deal would do to oil, to interest rates and to your portfolio, and how to be ready if the talks fall apart.
Felix Nikolas Prehn · 1 November 2026 · 16 pages
Bottom line
America has been at war with Iran for 8 months. Oil is up more than 50%, and the S&P 500 is still up 10%. In June the market rehearsed the end of this war for 3 weeks. Oil fell 28%. Smaller companies hit records. You don't need to guess the outcome. You need a plan for both.
28%the fall in Brent crude between 10 June and 2 July, after the temporary deal
Oil Is The Switch
A war, oil up 50%, and stocks up 10%
- A deal is signed and Hormuz opens
- Oil falls back
- Inflation eases
- Rates can come down
- Money hunts for new leaders
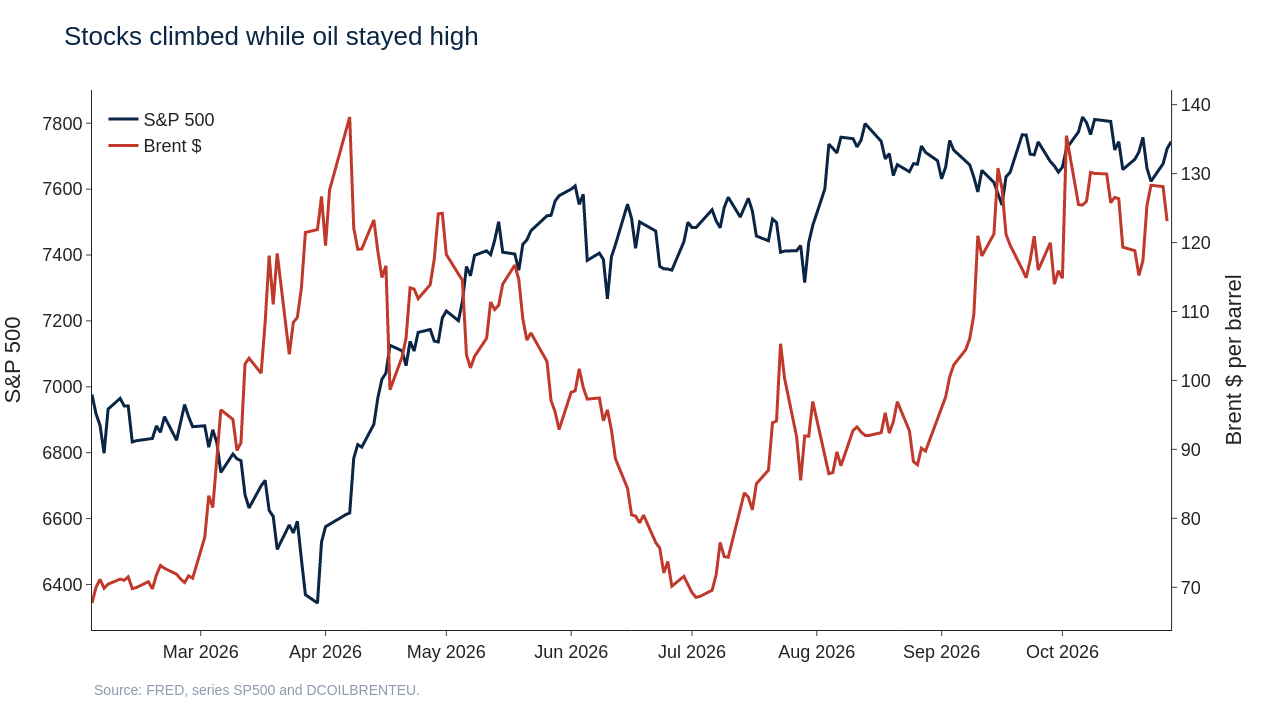
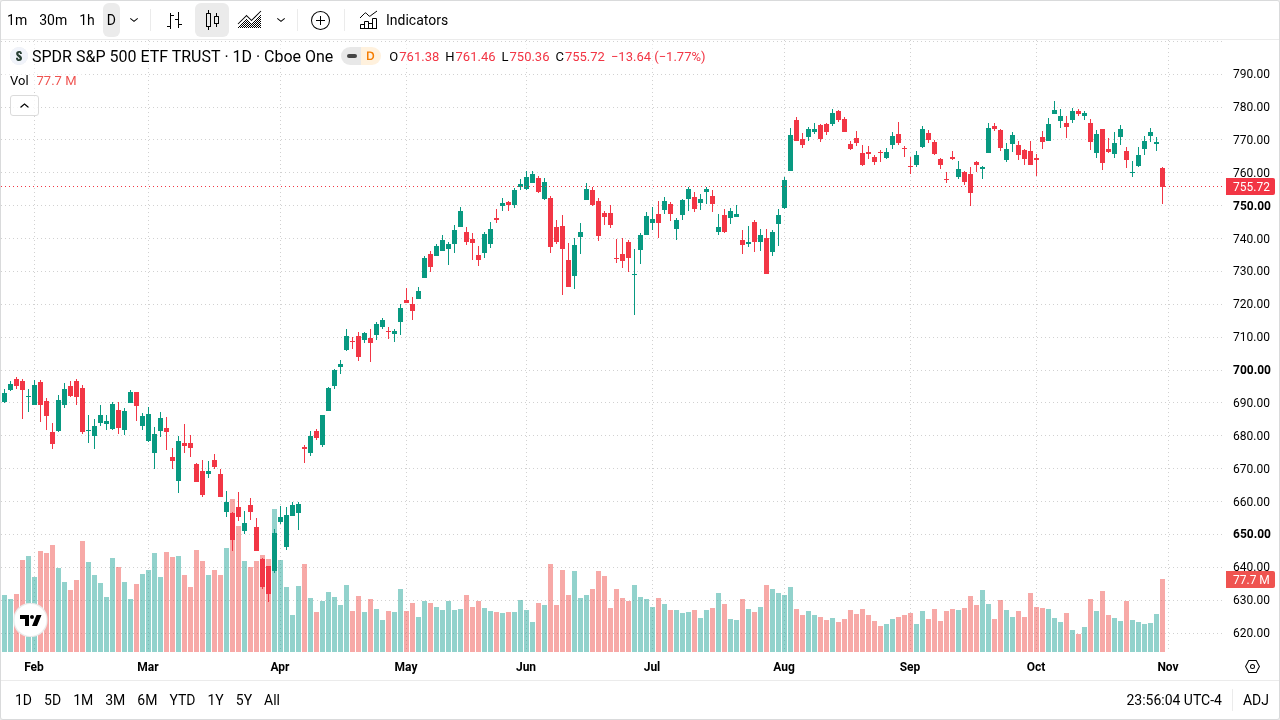
Wars are meant to crash markets. This one hasn't. Since the war began, the S&P 500 is up about 10%, which is roughly what it makes in a whole normal year, even though oil has been trading at crisis prices for most of that time.
So what's going on? Markets price the future. And once investors can see a way out of a war, they start pricing the end of it while the fighting carries on.
Now there's talk of peace. An American offer has been carried into Tehran by Qatari mediators. But nothing is signed.
But you've already seen what peace looks like. In June a temporary deal held for 3 weeks. Oil fell 28%, smaller companies closed at records and energy shares fell.
And gold? It's down about 27% in the middle of a war. Governments under pressure had to sell it. That pressure has an expiry date.
You don't need to guess the outcome to be ready for it.
The War Bill You're Already Paying
The market has done fine. Your household probably hasn't.
- 2.4% → 3.7%
- American inflation, February to September
- +74%
- fuel oil on a year earlier (petrol +34%, energy +20%)
- 5.98% → 7.24%
- typical 30-year fixed mortgage rate
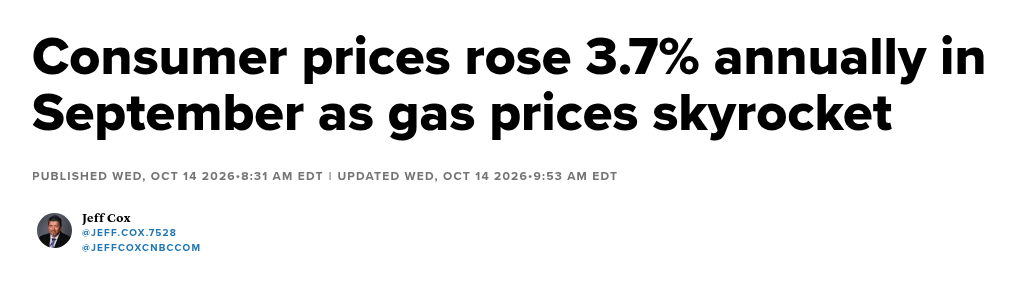
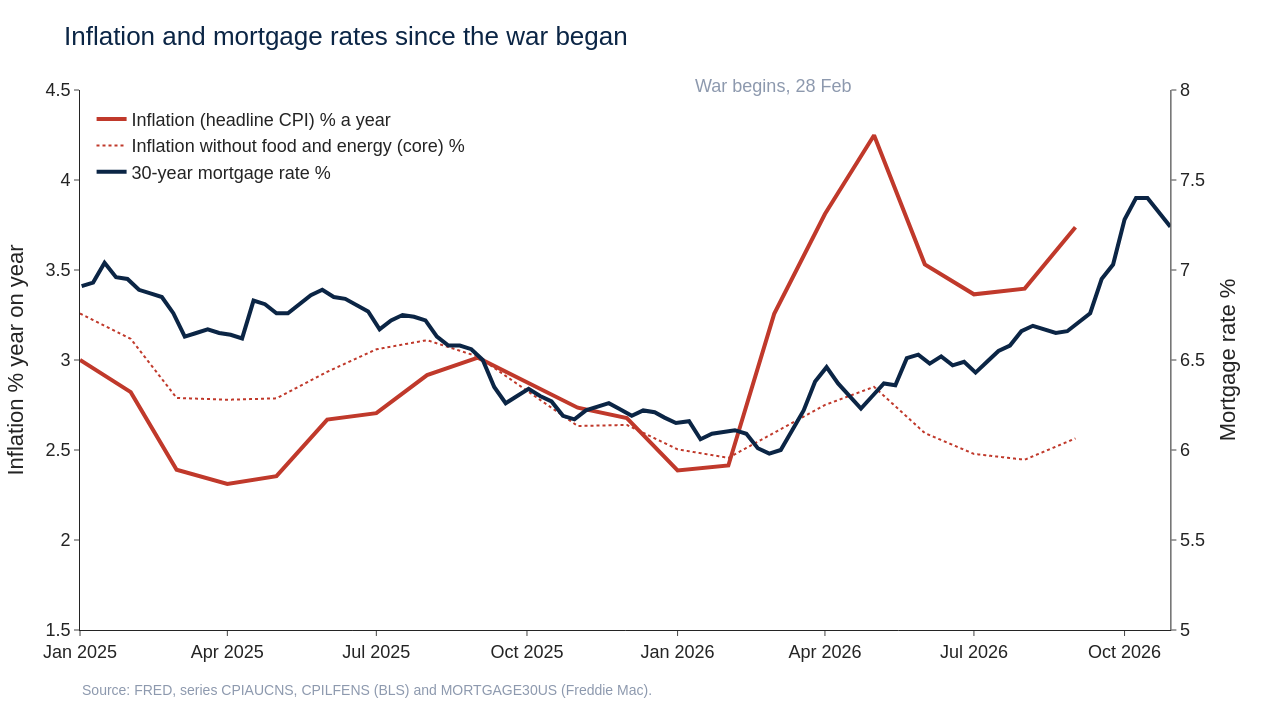
Inflation is how fast prices rise across everything you buy, from your food to your heating. In February it ran at 2.4%. By September it was 3.7%.
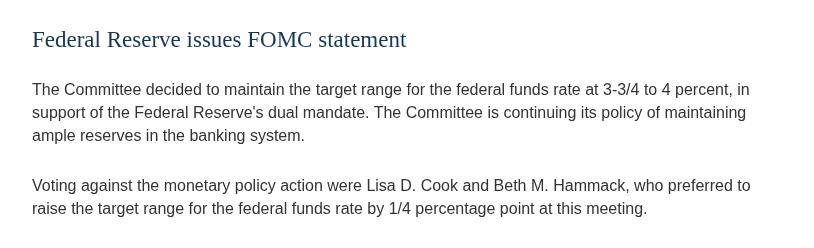
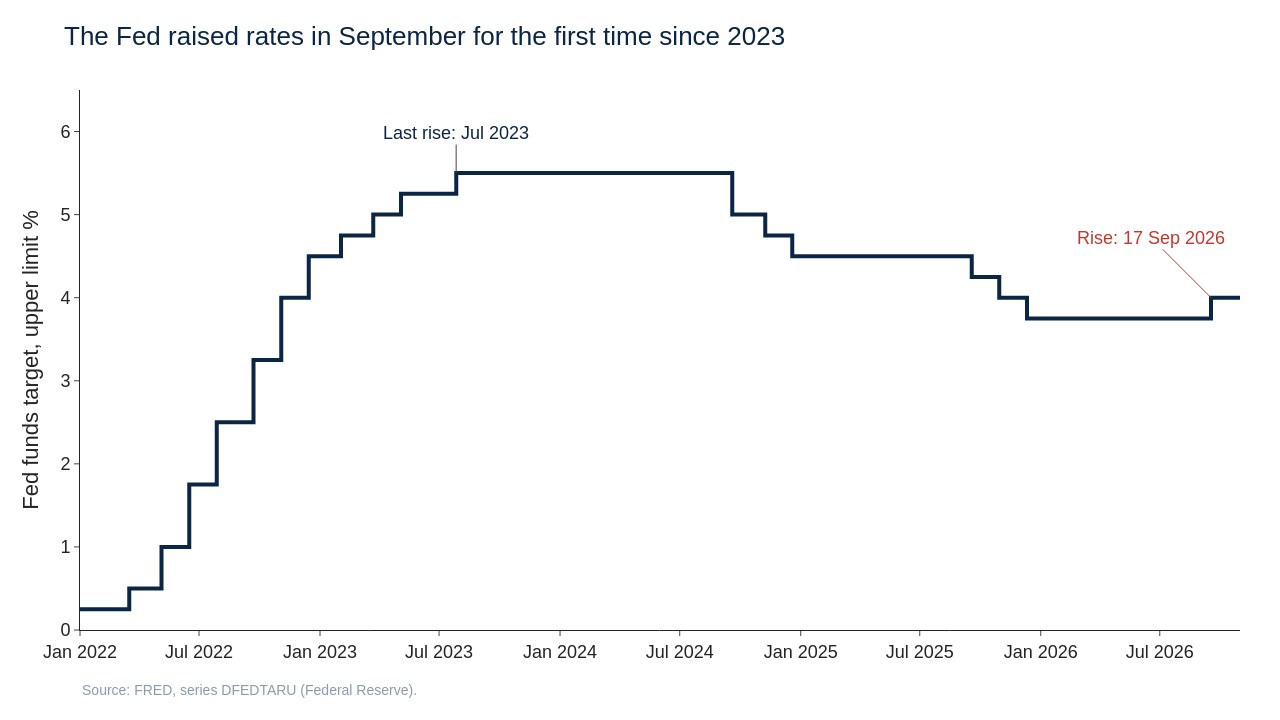
So the Federal Reserve did something it hadn't done since July 2023. It raised rates, to a top of 4%. And you feel that in your mortgage.
| A $400,000, 30-year loan | Monthly payment |
|---|---|
| At 5.98%, the week before the war | about $2,390 |
| At 7.24%, today | about $2,730 |
| Extra cost | $333 a month, about $4,000 a year, close to $120,000 over the loan |
Why did mortgages jump? Because they follow what the American government pays to borrow for 10 years. That rate was just under 4% before the war, and in early October it touched 5.31%, so the banks passed the bill straight on to anyone trying to buy a home.
3 sensible people, 3 different costs
Cash felt safe. But a savings account paying less than 3.7% buys a little less every month. The neighbour who sold in the first panic has missed a climb of 19.5% from the low. And the friend who bought gold is sitting on a loss of about 27%.
None of them are foolish. They did what the headlines suggested. But by the time something is on the front page, the price has usually moved already.
Why Stocks Climbed A Wall Of War
Markets price the end of a war before it ends
- -7.8%
- S&P 500, last close before the strikes to the low on 30 March
- +19.5%
- S&P 500 from that low
- 3.4%
- first estimate of Q3 growth, annual rate
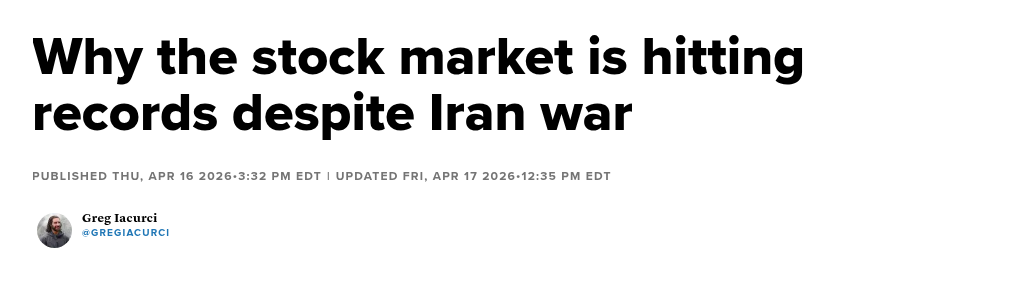
It did fall at first. That's when the panic selling happened. But by the middle of April the S&P 500 was hitting a fresh record during the trading day. It closed at an all-time high of 7,818 on 6 October.
So why the climb? A stock price is a guess about the future. When you buy a share, you buy a slice of every profit the company will make. So the price moves on what people expect, not on today's paper.
America has been here before
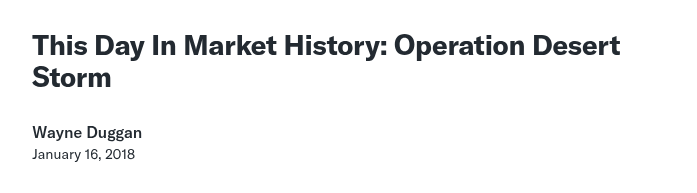
In August 1990 Iraq invaded Kuwait. Oil more than doubled and the S&P 500 fell about 20%. Then came the first day of Desert Storm in January 1991. Oil fell by about a third in a single session. And the S&P jumped 3.7%. From mid-January to the victory parade in June, it gained about 20%.
So who got there late? Anyone waiting for a signed peace and a parade.
The 3-Week Preview
June showed you what peace does
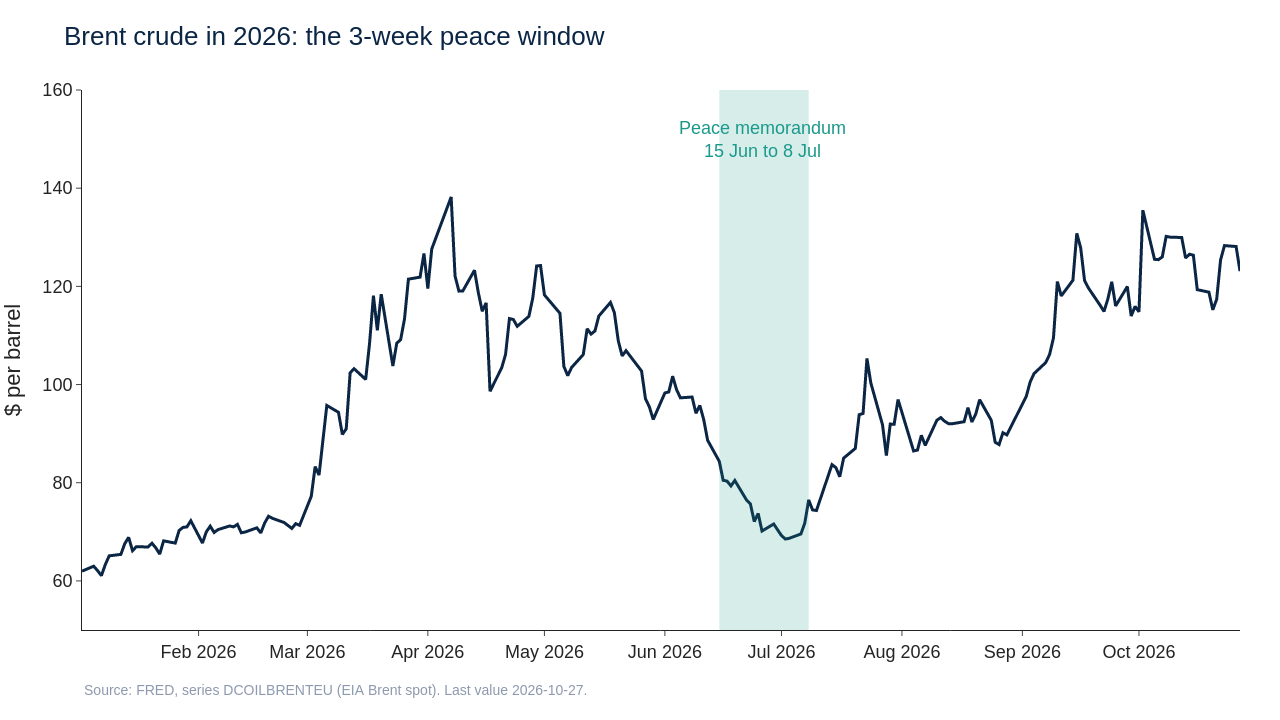
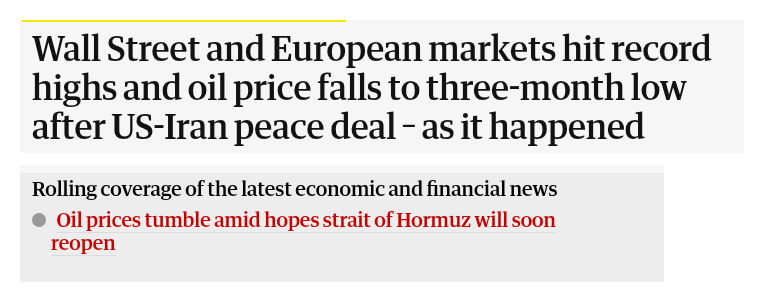
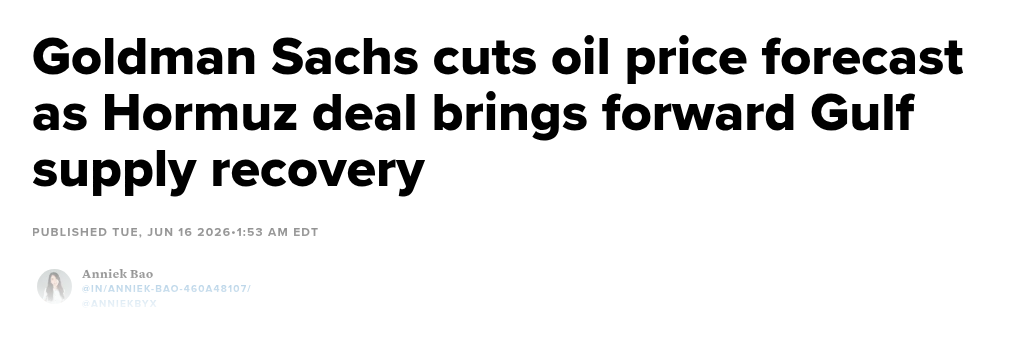
On 15 June America and Iran agreed a temporary deal to halt the fighting and reopen the Strait of Hormuz. That's the narrow sea lane between Iran and Oman that a large share of the world's oil tankers use.
Markets moved within hours. And the Nasdaq rose about 3% and the S&P about 1.5%. The Dow and the Russell 2000 of smaller companies both closed at records. But energy shares fell, because cheaper oil means lower profits for the companies that pump it.
If you watched oil, you saw Brent crude, the global benchmark, go from $95.73 on 10 June to $68.53 on 2 July. And Goldman Sachs cut its forecast to $80 for the last 3 months of the year and $75 for 2027.
It didn't last. On 8 July attacks on shipping started again and the deal fell apart.
Where The Deal Stands Now
A rumour with a pulse, and nothing more yet
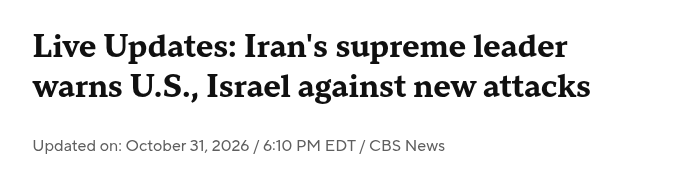
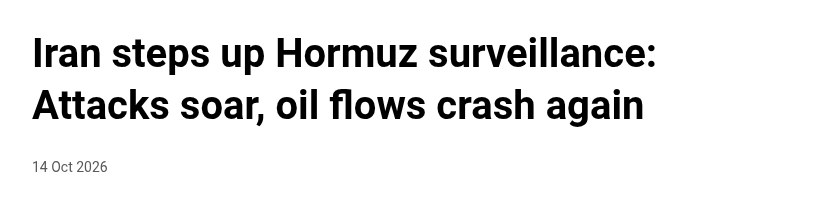
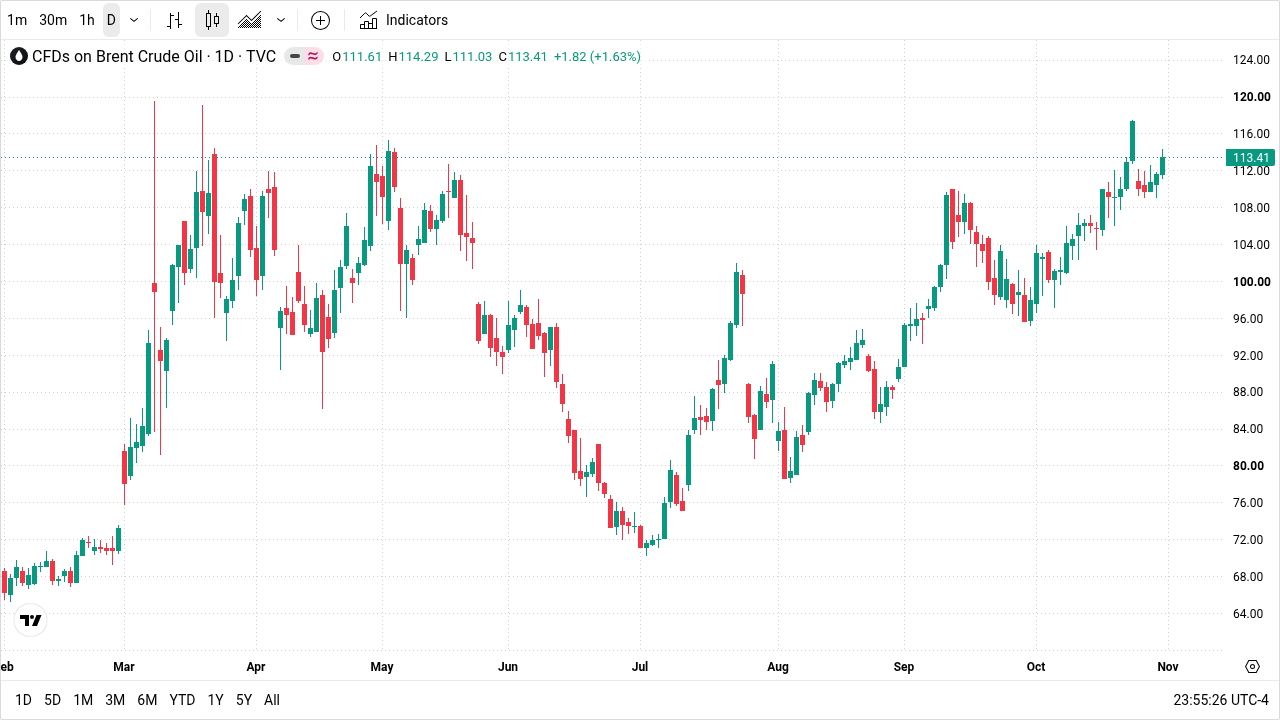
Since late September an American outline for a deal has gone to Tehran through Qatar. On 25 October a Qatari draft was presented, and senior Iranian officials called it unacceptable. On Friday the mediators flew back to keep trying.
On Saturday Iran's foreign minister said there were no plans to meet American officials. And Iran wants its conditions accepted first, including an end to the blockade of its ports and to sanctions on its oil and gas.
But on the water it looks worse. If you track tankers, you'll know Hormuz traffic had recovered to about 81% of normal in September. Then 10 tankers were hit in a single week, and on Friday Brent traded around $112.
Nothing is signed. The last deal lasted 3 weeks.
So what should you do with that? Anyone who calls a deal certain is guessing. So is anyone who says it can't happen. What matters for your money is what each outcome would do.
Normal Oil, Lower Inflation, Lower Rates
Oil decides which way rates go
Inflation is 3.7%. Core inflation, which strips out food and energy, is 2.6%. And that gap of about 1.1 points is mostly the war, at the petrol pump and in heating bills.
On Wednesday the Fed held its rate at 3.75% to 4%. But 2 voters, Lisa Cook and Beth Hammack, wanted a quarter-point rise. According to CNBC, futures traders lean towards another rise in December.
| If a deal is signed | If the talks collapse | |
|---|---|---|
| Brent crude | Back towards Goldman's $75 to $80 | Goldman's no-deal case: above $130 |
| Inflation | Moves back towards the 2.6% core figure | Sticks |
| The Fed | Talk turns from rises to cuts | A December rise becomes likely |
| Mortgages | Can drift back towards 6% | Stay higher for longer |
This is a reading, not a forecast. So is there a precedent? Yes. During the 1990 to 1991 Gulf crisis the Fed cut 6 times, from 8.25% to 6.75%.
Lower rates matter for your shares too. When cash pays well, a share has to work hard to look attractive. So when rates fall, money in savings starts looking for a better return.
The oil price is the switch.
What Normal Oil Does To Stocks
A tax cut for some, a pay cut for others
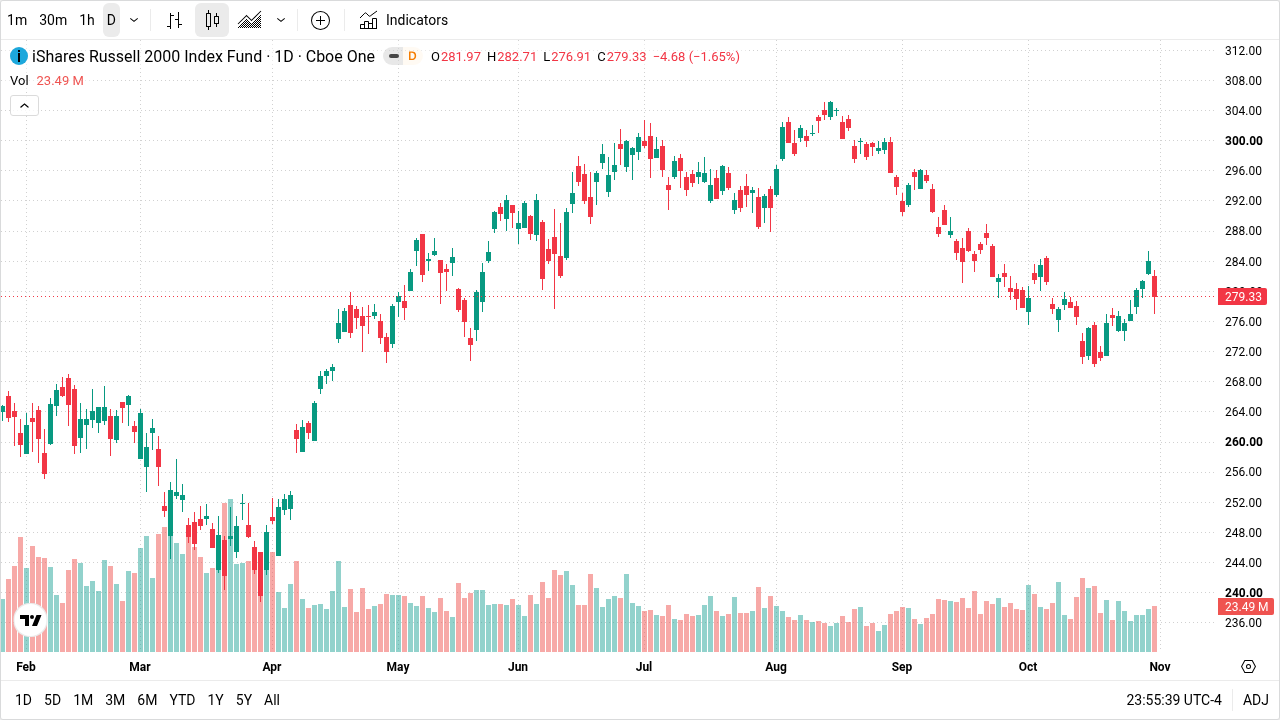
This is education, not advice. So treat these as names to study, not a shopping list.
| Fund to study | What it holds | Why cheaper oil matters |
|---|---|---|
| IWM | Smaller American companies | Borrow at rates that move with the market, sell mostly at home |
| JETS | Airlines | Fuel is among the biggest costs after staff |
| IYT | Truckers, railways, delivery firms | Every lorry and freight train burns diesel |
| ITB, XHB | Housebuilders and their suppliers | Mortgages nearer 6% let more families buy |
| XLY | Spending people can put off | Cheaper petrol leaves more money at the end of the month |
| XLE | Big oil companies | The reverse: profits depend on a high oil price |
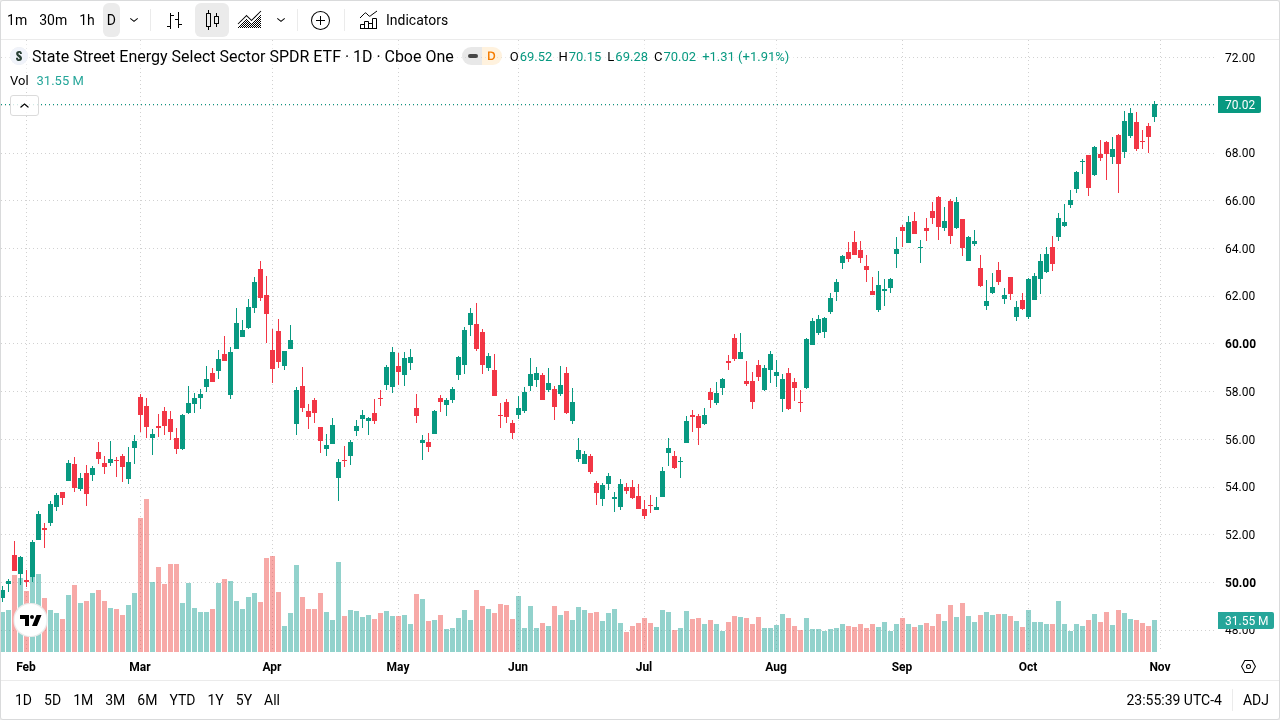
Now look at energy. It has been the place to be. XLE rose almost 14% in October alone. But on deal day in June those same companies fell. So if you hold a lot of energy, a deal is a risk to you.
And if the talks fall apart? Energy is your insurance. That's why selling everything in 1 sector to pile into another is a gamble.
So write down what you own. Next to each, mark whether it does better with cheap oil or expensive oil. If everything works in only 1 world, you're making a bet, whether you meant to or not.
Gold: Who's Been Selling, And Why It Stops
Forced sellers, with an expiry date
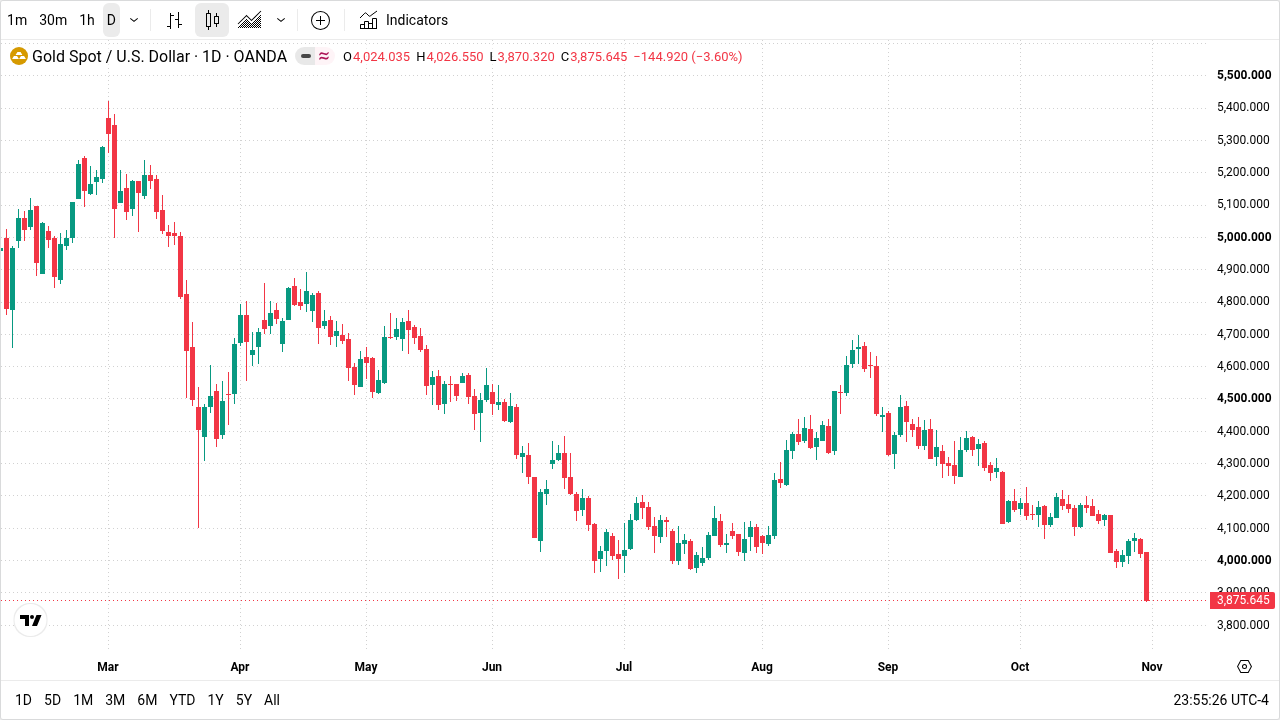

Gold hit a record of about $5,595 an ounce at the end of January, and it was still about $5,296 on the last trading day before the war, so plenty of people bought it as protection. On Friday it closed around $3,880, down about 27% since the war began.
Who was selling? Central banks have been the biggest buyers of gold in recent years. This year some of them turned seller.
| Seller | What the record shows |
|---|---|
| Turkey | Holdings fell about 131 tonnes in March. Net sales of 82 tonnes this year by August |
| Russia | Sold 56 tonnes |
| Jordan | Sold 3 tonnes in August |
| Azerbaijan's state oil fund | Sold gold in the first quarter |
Why sell in a crisis? Because they needed the cash. Their oil bills are paid in dollars. When a currency slides, the central bank sells reserves to prop it up, much as you might sell something to cover a big bill. And gold is often the easiest thing to sell quickly in size.
So the selling has an expiry date. If oil falls, those bills shrink and currencies calm down. When the lira steadied, Turkey bought back 3 tonnes in August. Central banks as a group still added about 170 tonnes to August.
There's no reliable evidence that the Gulf states have been selling gold. Gold could still fall further, especially if the talks collapse. But you can now judge when the reason for the selling has gone.
When Big Money Changes Its Mind
Last week, the old winners cracked
- -29%
- Intel on Friday, its worst day since 1974
- $500bn
- roughly what Alphabet lost on its worst day ever
- +5%
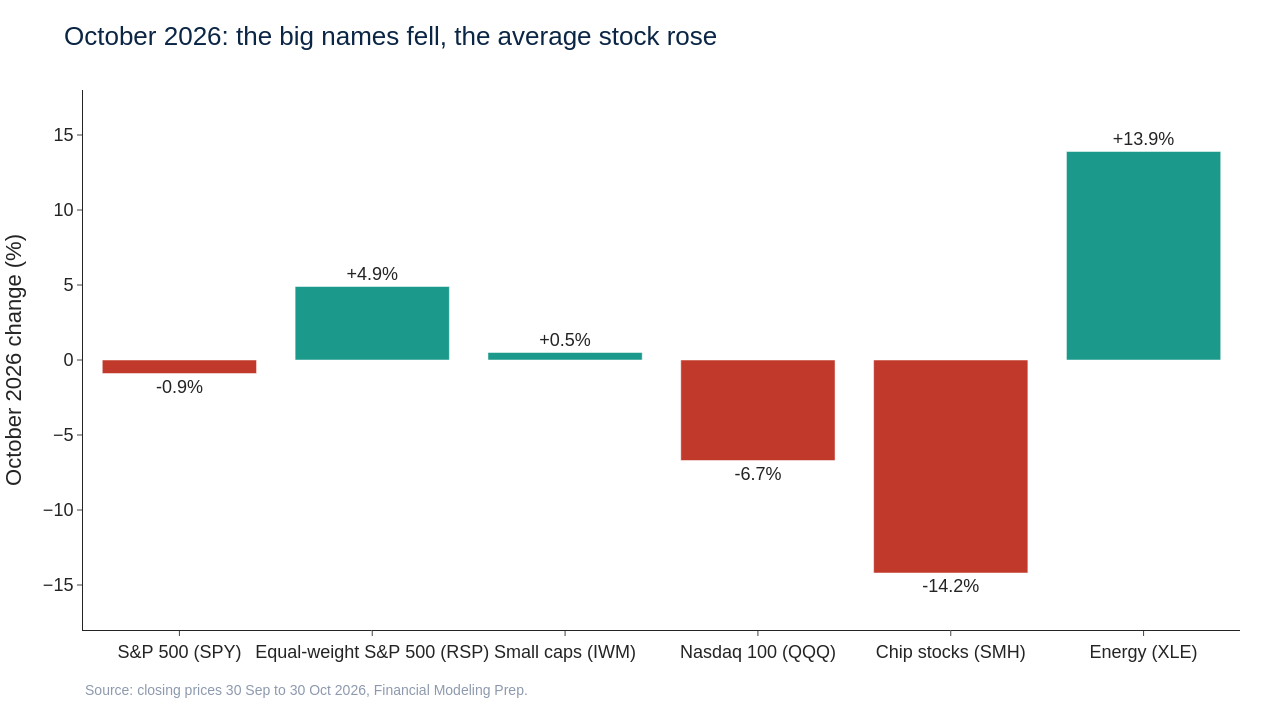
- almost, the average S&P 500 company in October
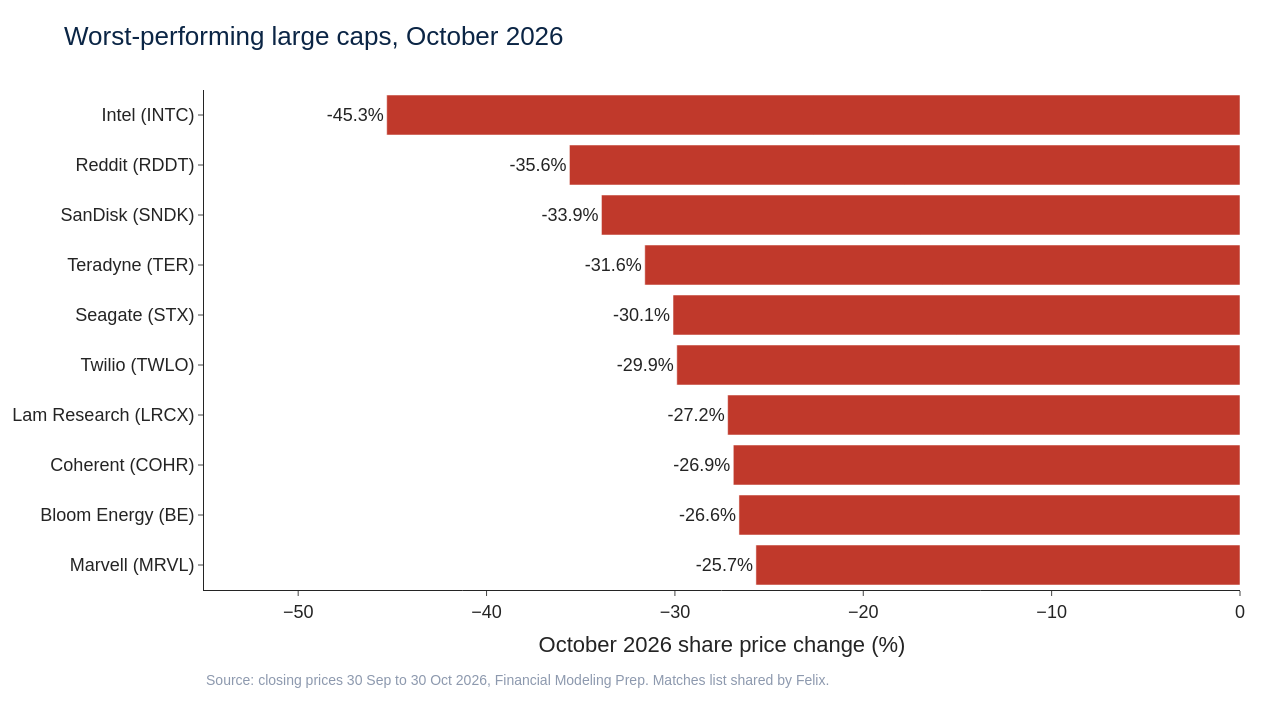
On Friday the S&P 500 had its worst day since June. The Nasdaq fell almost 3%. In October Intel was down 45%, Reddit 36% and SanDisk 34%. Most of the rest of the losers were chip and memory makers.
But the big oil companies hit records. That's a rotation: money leaving one group of stocks for another.
Depending on whose numbers you use, the Magnificent 7 tech giants made up around half or more of the S&P 500's gains in each of the last 3 years. Now they're wobbling.
So who gets hurt if oil falls and rates come down? Mostly the people still holding the old winners while new leaders set up somewhere else.
The Plan, Deal Or No Deal
Hold things that work in both worlds
- Deal signed: June is your guide
- Talks collapse: Goldman's $130 oil case is the risk
Put those 2 side by side. You'll see that most of the companies that do well after a deal struggle if the talks collapse. And energy is the reverse.
And gold sits apart, because its forced sellers go away if there's a deal.
4 things to watch each week
- Headlines about the Qatari mediators, and any meeting between American and Iranian officials.
- The number of tankers passing through Hormuz. It tells you more than any speech.
- The Fed's December meeting.
- The World Gold Council's monthly numbers on central bank buying and selling.
Your own checklist
- List every holding you own.
- Mark each one: does it need cheap oil or expensive oil?
- Check how much energy you hold. A deal is a risk to it.
- Check whether you lean on the old tech winners.
- Make sure you can live with both outcomes.
That's what having a plan means. Or, as Felix puts it in the video: "We're not going to panic. We're going to have a plan."
Learn To Spot The Shift Early
The Great Pivot
Spotting a change in market leadership early is a skill. Nobody taught it to you at school. And that isn't your fault.
But if you want to protect what you've built, it is worth learning. Do you know which of your holdings are old leaders and which could be new ones?
Disclaimer
This briefing is for educational purposes only and does not constitute financial advice. It is not a recommendation to buy or sell any asset or security. All investment carries risk, including the loss of principal. Past performance is not indicative of future results. The Prehn Institute takes no sponsorships or endorsements.