
The Interest Income Playbook
Felix Nikolas Prehn · 10 July 2026 · 23 pages
Bottom line
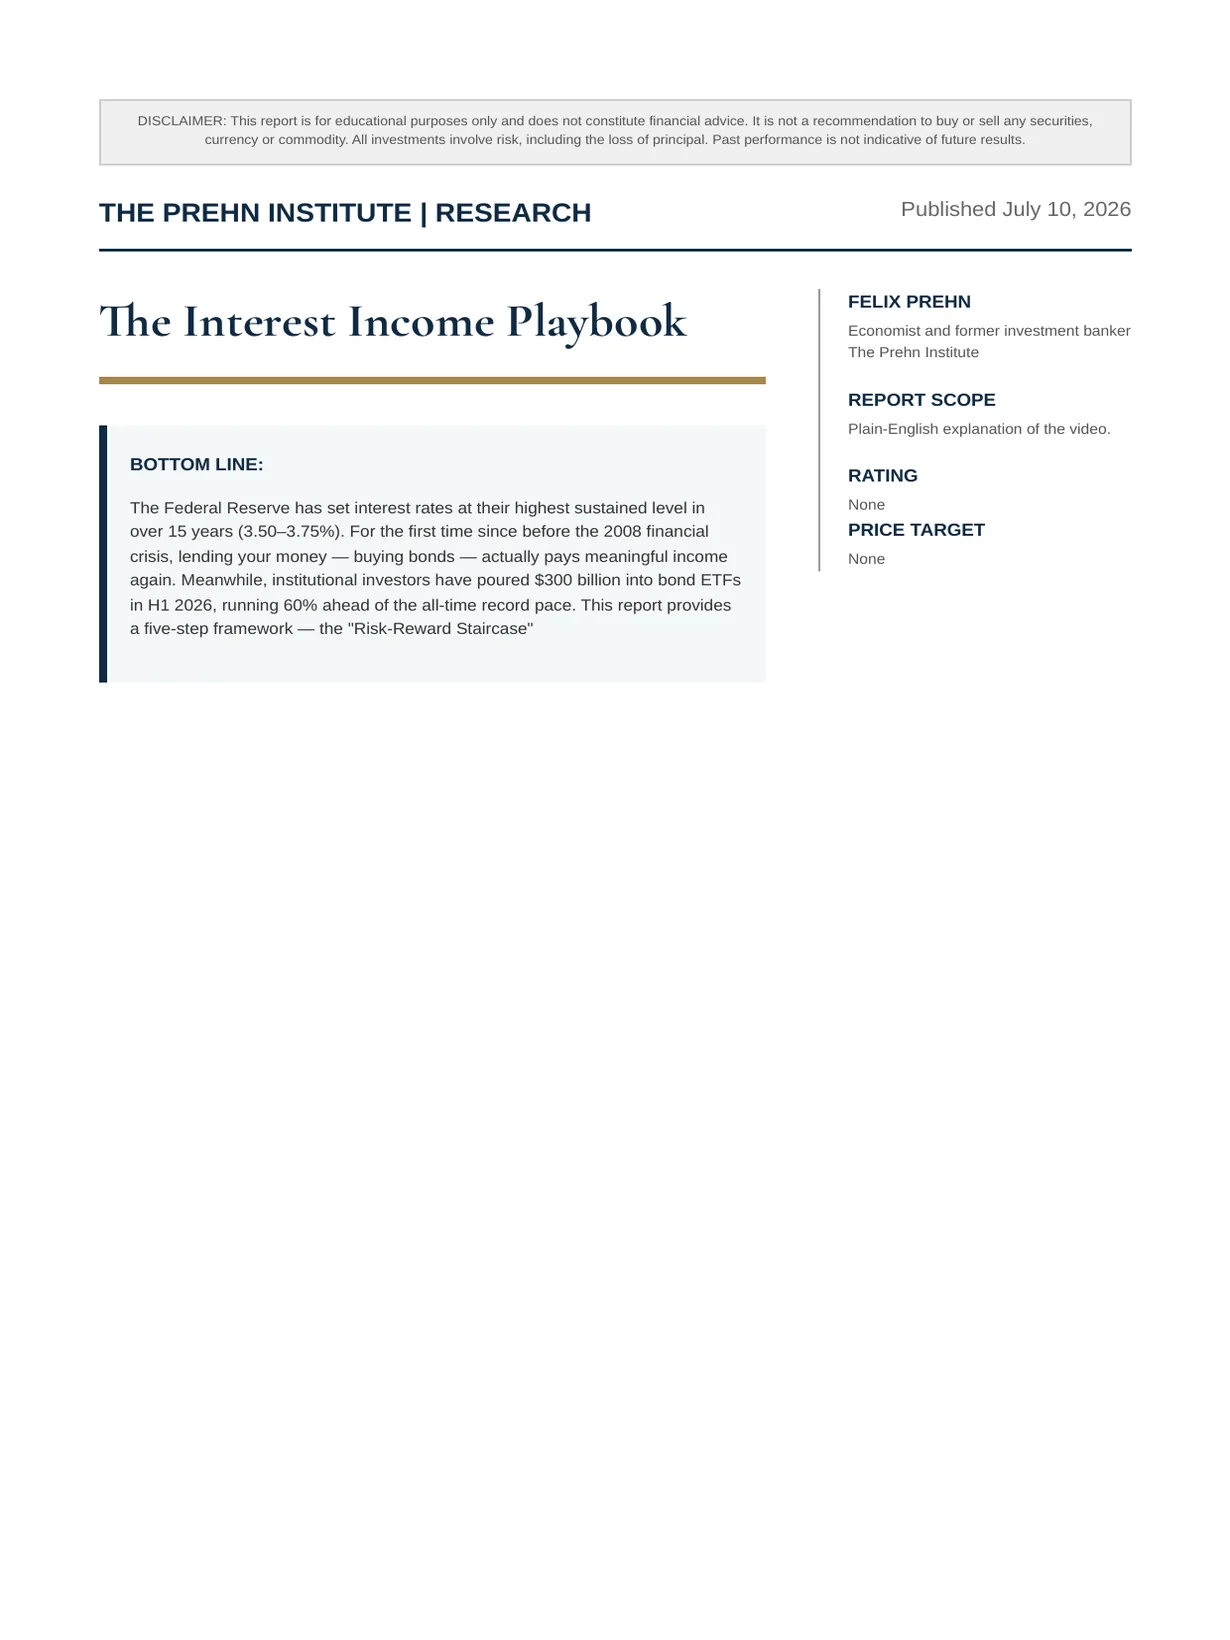
The Federal Reserve has set interest rates at their highest sustained level in over 15 years (3.50–3.75%). For the first time since before the 2008 financial crisis, lending your money — buying bonds — actually pays meaningful income again. Meanwhile, institutional investors have poured $300 billion into bond ETFs in H1 2026, running 60% ahead of the all-time record pace. This report provides a five-step framework — the "Risk-Reward Staircase"
Overview
The Interest Income Playbook
A Beginner's Framework for Earning 3.5% to 6.5% Per Year — Using the Same Tools the
Big-Money Investors Are Buying Right Now
BOTTOM LINE:
The Federal Reserve has set interest rates at their highest sustained level in over 15 years (3.50–3.75%). For the first time since before the 2008 financial crisis, lending your money — buying bonds — actually pays meaningful income again. Meanwhile, institutional investors have poured $300 billion into bond ETFs in H1 2026, running 60% ahead of the all-time record pace. This report provides a five-step framework — the "Risk-Reward Staircase"
- that enables investors of all experience levels to select interest-paying investments that match their personal risk tolerance, from near-zero-risk U.S. Treasuries (~3.8%) to higher-yielding risky company bonds (~6.5%). We include ETF options for U.S., UK, and EU investors. No buy/sell ratings or price targets are included.
1. The Problem: Why Your Savings Are Shrinking
The Savings Trap. The average U.S. savings account pays 0.38% per year (FDIC, June 2026). At the same time, prices are rising at 4.2% per year (BLS CPI, May 2026). This means for every $100 sitting in a savings account, the bank pays you 38 cents — while the cost of groceries, petrol, and insurance goes up by $4.20. Your money is shrinking 10 times faster than it's growing.
This Is Not New. Since 2010, what banks pay on savings has been lower than how fast prices go up. For 15 years, everyday savers have been quietly losing purchasing power. The banks benefited — they used your cheap deposits to make billions for themselves.
- 0.38%
- Average savings rate Source: FDIC, June 2026
- 4.2%
- Rate prices are going up Source: BLS CPI, May 2026
3.5–6.5%
Available via bond ETFs Source: Fund providers, July 2026
In Simple Terms: If prices go up faster than your savings grow, you're getting poorer — even though you didn't spend a cent. That's what's been happening for 15 years to anyone who just left their money in a bank account.
2. The Opportunity: What Changed in 2026
The Rate Cycle. Think of interest rates like a house thermostat — the Federal Reserve turns them up and down depending on what the economy needs. In 2020, the pandemic hit and rates dropped to nearly zero. By 2022, all that cheap money had caused prices to explode, so the Fed cranked rates to their highest point in 15 years. Rates came down slightly in 2024–2025, but in June 2026, new Fed Chair Kevin Warsh held the rate at 3.50–3.75% — the highest sustained level since before the financial crisis. He signalled that rates will stay high as long as price increases remain above target.
The Big-Money Move. While regular investors were focused on tech stocks and AI, the big-money investors quietly shifted. Hedge funds became net sellers of semiconductor (chip) stocks, according to Goldman Sachs prime brokerage data. Where did that money go? Into interest-paying investments. Bond ETFs received $300 billion in the first half of 2026 — running 60% ahead of the all-time record pace, per SSGA and ETF Trends data.
What This Means For You. The richest, most well-resourced investors on the planet — with billion-dollar research teams
- looked at this environment and decided it was time to collect interest. They have a system. They know when to move from one type of investment to another. This report gives you a similar framework.
2020
Rates → ZERO (Pandemic)
→
2022
Rates → HIGHEST (Fight price rises)
→
2025
Rates → Down
(Relief)
→
2026
Rates → STAYING HIGH
(3.50–3.75%)
Key Number: $300 billion flowed into bond ETFs in just six months (H1 2026). That's not panic — that's a plan. The big- money investors are locking in interest income at levels not seen in over 15 years.
3. Two Ideas Every Investor Needs to Understand
Idea 1: Partners vs. Banks — Stocks vs. Bonds
Imagine your neighbour opens a restaurant and needs $10,000. You have two choices:
Choice A — Be a Partner (Stocks). You put in $10,000 and own 10%. If the restaurant booms, you share the profits — could be $5,000 or $50,000 a year. But if the restaurant flops, you lose your money. Maybe all of it. That's how stocks work. You're an OWNER. Unlimited upside, unlimited downside.
Choice B — Be the Bank (Bonds). You lend your neighbour $10,000. He signs a contract to pay you 6% interest ($600/year) and give you your $10,000 back in five years. If the restaurant becomes a hit — you still only get $600. But if it barely survives — he still owes you $600. And if he goes broke, you get paid BEFORE the partners. That's how bonds work. You're a LENDER. Limited upside, but you're protected.
Most people only know how to be partners (buy stocks). For 15 years, being the bank paid almost nothing, so nobody bothered. But now, with rates at 3.5–3.75%, being the bank pays real money again.
Idea 2: The Seesaw — How Bond Prices Move
When interest rates go UP, bond prices go DOWN. When rates go DOWN, bond prices go UP. Like a seesaw — one side up, the other down.
Short-term bonds (due back in months) barely bounce. The seesaw is tiny. You just collect your interest. Very calm.
Long-term bonds (due back in 10–20 years) bounce a LOT. If rates go up 1%, a long-term bond fund could drop 7–8%. The seesaw swings hard.
Takeaway: Short-term = calm and steady. Long-term = more income but more bouncing around. Pick what matches your comfort level.
Idea 3: Are You Actually Making Money? (Real
Gain)
If someone says "I'm earning 4% on my investment!" it sounds great. But prices are going up by 4.2%. So you're still falling behind. The simple maths:
Your Rate − 4.2% (price increases) = Your Real Gain
Positive = you're getting richer · Negative = you're still falling behind
Example: 5.8% − 4.2% = +1.6% real gain — you're actually beating rising prices
4. The Risk-reward Staircase — Overview
We present a five-step framework called the Risk-Reward Staircase. Each step pays more income, but asks you to accept more risk. You don't climb higher than you're comfortable with. Most professional investors stand on more than one step at the same time.
| Step | What You're Lending To | Approximate Yield | Real Gain (after 4.2% price rises) | Risk Level | Key ETF(s) |
|---|---|---|---|---|---|
| 1 | U.S. Government | ~3.8% | −0.4% | Lowest | SGOV, USFR |
| 2 | Countries America Protects | ~5.8% | +1.6% | Low–Medium | EMB |
| 3 | Big, Strong Companies | ~4.4–5.2% | +0.2 to +1.0% | Medium | VCSH, LQD |
| 4 | Risky Companies | ~6.5% | +2.3% | High | HYG |
| 5 | Cities & States (Tax-Free) | ~3.0–3.5% (tax-free) | Equiv. 5.56% taxable* | Low–Medium | VTEB, MUB |
| *Tax-equivalent yield calculated at 37% federal tax bracket. Source: Fund provider websites, July 2026. Data accessed via app.goatacademy.org. |
The Interest Income Playbook
STEP 1: LENDING TO THE U.S. GOVERNMENT — THE SAFEST BET
How It Works. The U.S. government collects about $5 trillion in taxes and spends about $7 trillion. That $2 trillion gap is filled by borrowing — from you, from pension funds, from other countries. The national debt has passed $39.4 trillion (JEC Senate Dashboard, July 2026). When you buy a Treasury bond, you're lending money to the government. They pay you interest.
Why It's the Safest. The U.S. government has three advantages no company has: (1) it can raise taxes on 330 million people, (2) it can print money through the Federal Reserve, and (3) if it refused to pay, the entire global economy would collapse. Every country on earth has a reason to make sure that never happens.
SGOV — iShares 0–3 Month Treasury Bond ETF. Pays approximately 3.8% per year. Interest paid monthly. Because these are ultra-short-term (3-month) Treasuries, the price barely moves — the seesaw is almost flat. Near-zero bouncing.
USFR — WisdomTree Floating Rate Treasury Fund. Also approximately 3.84%. The interest rate FLOATS — meaning if the Fed raises rates, your payments go up automatically. You're not locked in.
Tax Bonus. Treasuries are exempt from state and local taxes. In a high-tax state like California (13% state tax), a savings account at 3.8% nets ~3.3% after state tax. SGOV at 3.8% nets the full 3.8%. That gap compounds over years.
STEP 1 SCORECARD · Pays: ~3.8% · Real Gain: −0.4% · Risk: Lowest · Tax Bonus: No state tax · Best For: Parking cash safely while earning more than a bank account.
The Interest Income Playbook
STEP 2: LENDING TO COUNTRIES AMERICA PROTECTS
The Idea. Some countries operate under the American umbrella — militarily and economically. Saudi Arabia, the UAE, and Qatar have currencies pegged (locked) to the U.S. dollar. Because they are not the United States, they must offer higher interest rates to attract lenders. But because they have dollar protection and U.S. military presence, the risk isn't as extreme as lending to a country with no such backing.
EMB — iShares J.P. Morgan USD Emerging Markets
Bond ETF. Pays approximately 5.8% per year (SEC yield 5.77% per iShares, July 2026). All bonds are paid in U.S. dollars, so you're not exposed to foreign currency bouncing around. Top holdings include Saudi Arabia, Mexico, and Indonesia. The fund is spread across dozens of countries — if one country has problems, the others cushion the blow.
The Trade-Off. The price of this fund bounces around more than Treasuries. Some of these countries can fail to pay — it's happened before (Argentina, Lebanon, Russia). But in a diversified fund across dozens of countries, one failure doesn't wipe you out.
STEP 2 SCORECARD · Pays: ~5.8% · Real Gain: +1.6% · Risk: Low–Medium · Key: All in U.S. dollars · Best For: Investors who want to beat rising prices with manageable extra risk.
Why +1.6% Real Gain Matters: At Step 1, your money still slightly loses value after accounting for rising prices. At Step 2, your money is genuinely growing in purchasing power. That's a meaningful upgrade — the difference between treading water and actually swimming forward.
The Interest Income Playbook
STEP 3: LENDING TO BIG, STRONG COMPANIES
The Idea. Now you're lending to the biggest, strongest companies in America — Microsoft, JPMorgan, Johnson & Johnson. These companies borrow money to build data centres, buy other companies, and expand operations. They issue bonds (contracts to pay you back with interest). As a bondholder, you have a legal contract. If they can't pay, they go bankrupt — and bondholders get paid BEFORE stockholders. You're first in line.
VCSH — Vanguard Short-Term Corporate Bond ETF. Pays approximately 4.4% per year (Vanguard, July 2026). Holds bonds that are due back in 1 to 5 years. Because the loans are short, the price barely moves — very calm. And because bonds constantly mature and the fund reinvests at new rates, you actually benefit when rates go up. Management fee: 0.03% — practically free.
LQD — iShares Investment Grade Corporate Bond ETF. Pays approximately 4.5–5.2% per year (iShares, July 2026). Holds longer-term company bonds — about 8 years of "seesaw" exposure. More income potential, but if rates go up 1%, this fund could drop about 8% in price. The seesaw swings hard both ways.
The Professional "Barbell" Approach. Instead of putting everything in one fund, professionals split their money: half in the short, calm fund (VCSH) and half in the longer, higher- paying one (LQD). The short end stays stable and benefits from rate rises. The long end earns more income and gets a price boost if rates fall. They balance each other out — a technique that most regular investors have never heard of.
STEP 3 SCORECARD · Pays: ~4.4–5.2% · Real Gain: +0.2 to +1.0% · Risk: Medium · Key: Big companies, legal contracts · Strategy: The "barbell" — split between short and long.
The Interest Income Playbook
STEP 4: LENDING TO RISKY COMPANIES (HIGH YIELD / "JUNK" BONDS)
The Deal. "Junk bonds" sounds scary, but all it means is loans to companies that the rating agencies consider high risk. These are smaller companies, companies with a lot of debt, or companies with unproven business models. The rating agencies look at them and say: "There's a real chance this company might not pay you back." So why invest? Because these companies have to pay HIGHER interest to convince anyone to lend to them. More risk, more reward.
HYG — iShares High Yield Corporate Bond ETF. The biggest risky-company bond fund in the world. Pays approximately 6.5% per year (SEC yield 6.50% per iShares, July 2026). The portfolio is mostly BB and B-rated debt — risky, but not the absolute bottom tier.
The Critical Warning. Risky-company bonds are a bet on the economy. When the economy booms, even the risky companies can pay their bills — you collect 6.5% and life is good. But when the economy turns down, the weakest companies go broke first. Your fund can drop 15–25% in a downturn. Right now, the risk cushion (the extra premium you're paid for taking junk risk) is historically thin, meaning there's not much safety net if the economy slows.
The Honest Question. Before stepping onto Step 4, ask yourself: "Do I believe the economy is strong enough that these risky companies will keep paying their bills for the next 1 to 2 years?" If yes — 6.5% is attractive income. If no — you may be picking up coins on a train track.
STEP 4 SCORECARD · Pays: ~6.5% · Real Gain: +2.3% · Risk: HIGH · Key: Economy must stay strong · ⚠️ Risk cushion is historically thin — less safety net than normal.
The Interest Income Playbook
STEP 5: THE TAX TRICK — LENDING TO CITIES & STATES (MUNICIPAL BONDS)
A Different Kind of Step. Steps 1–4 are about climbing higher for more income. Step 5 is a SIDE step. It's not about earning more on paper — it's about KEEPING more of what you earn. This is primarily relevant for U.S. investors in higher tax brackets.
How It Works. Municipal bonds are loans to cities and states to build roads, schools, and bridges. The interest you earn is EXEMPT from federal income tax. At the top federal tax rate of 37%, that exemption is worth a lot.
VTEB
— Vanguard Tax-Exempt Bond
ETF.
Pays approximately 3.5% per year, tax-free at the federal level (SEC yield 3.49% per Vanguard, July 2026). Holds over 10,000 municipal bonds across the country. Management fee: 0.03%.
MUB — iShares National Muni Bond ETF. Pays approximately 3.0% per year, also tax-free.
Are Cities Safe? Not quite as safe as the federal government. Detroit went bankrupt in 2013. But in a diversified fund with 10,000+ bonds across the entire country, one city's problems barely register.
Savings Account
$1M × 3% = $30,000 Tax (37%): −$11,100
You keep: $18,900
Muni Bond Fund (VTEB)
$1M × 3.5% = $35,000
Federal Tax: $0
You keep: $35,000
That's $16,100 more per year. Same million dollars. At $5M, the gap is $80,000+/year.
The Tax-Equivalent Yield Formula
To compare munis fairly against taxable investments, use this formula: Muni Yield ÷ (1 − Your Tax Rate) = Tax-Equivalent
Yield5.56% Yield. Example: VTEB at 3.5% ÷ (1 − 0.37) = 5.56%. This means a muni bond paying 3.5% puts the same money in your pocket as a taxable investment paying 5.56%. That beats most corporate bonds — with far less risk.
STEP 5 SCORECARD · Pays: ~3.0–3.5% (tax-free) · Tax-Equivalent: 5.56%+ for high earners · Risk: Low–Medium · Key: U.S. investors in high tax brackets · The "stealth play" that the wealthy use.
5. UK & EU Alternatives — Index Fund Options for Non-u.s. Investors
The ETFs discussed in Steps 1–5 are U.S.-listed and primarily designed for U.S. investors. UK and EU investors may face tax complications, withholding issues, or platform restrictions when buying U.S.-domiciled ETFs. Below we present UCITS-compliant alternatives that are available on major European and UK platforms. These are Ireland- or Luxembourg-domiciled, which means they comply with EU regulations and are accessible via most UK and European brokers.
Important Note: Tax treatment varies by country. UK investors should consider the impact of the ISA wrapper (which shelters gains and income from tax) and the Personal Savings Allowance. EU investors should consult local tax guidance. The tax-free municipal bond advantage (Step 5) is a U.S.-specific benefit and does not apply outside the United States.
| Step | U.S. ETF | UK/EU UCITS Alternative | Ticker | Approx. Yield | Notes |
|---|---|---|---|---|---|
| 1 | SGOV / USFR | iShares $ Treasury Bond 0– 1yr UCITS ETF | IBTS (LSE) | ~3.5–4.0% | USD-denominated short Treasuries; hedged versions available (e.g., IGLS for GBP-hedged gilts) |
| 1 | — | Lyxor Smart Overnight Return UCITS ETF | CSH2 (Euronext) | ~3.3–3.6% | EUR cash proxy; tracks the Solactive Euro Overnight Return Index |
| 1 | — | iShares UK Gilts 0–5yr UCITS ETF | IGLS (LSE) | ~3.5–4.2% | Short-dated UK government bonds; GBP; no currency risk for UK investors |
| 2 | EMB | iShares J.P. Morgan $ EM Bond UCITS ETF | IEMB (LSE) | ~5.5–6.0% | Same index as EMB but UCITS-compliant; USD- denominated |
| 3 | VCSH | Vanguard USD Corporate 1– 3yr Bond UCITS ETF | VUSC (LSE) | ~4.0–4.5% | Short-term investment-grade corporate bonds in USD |
| 3 | LQD | iShares $ Corp Bond UCITS ETF | LQDE (LSE) | ~4.5–5.0% | Investment-grade USD corporates; longer duration; same idea as LQD |
| 3 | — | iShares Core € Corp Bond UCITS ETF | IEAC (LSE/Euronext) | ~3.5–4.0% | EUR-denominated investment-grade corporate bonds; no FX risk for EUR investors |
| 4 | HYG | iShares $ High Yield Corp Bond UCITS ETF | IHYU (LSE) | ~6.0–6.5% | USD high yield; UCITS version of HYG |
| 4 | — | iShares € High Yield Corp Bond UCITS ETF | IHYG (LSE/Euronext) | ~5.0–5.5% | EUR high yield corporates; no FX risk for EUR investors |
| 5 | VTEB / MUB | No direct equivalent. U.S. municipal bond tax exemption does not apply outside the U.S. UK investors can use an ISA wrapper to shelter bond income from tax. EU investors should consult local tax guidance. | |||
| Source: iShares, Vanguard, Lyxor fund factsheets, July 2026. Yields are approximate SEC/distribution yields. Actual returns may vary. Currency risk applies to | |||||
| non-hedged versions. Data cross-referenced via app.goatacademy.org. |
UK Investors: Consider holding bond ETFs inside an ISA (Individual Savings Allowance) to shelter interest income from income tax. The 2026/27 ISA allowance is £20,000 per year. For amounts above this, the Personal Savings Allowance may shelter up to £500–£1,000 of interest income depending on your tax band. UK gilts (IGLS) are exempt from capital gains tax if held directly, but this does not apply to ETFs holding gilts.
EU Investors: UCITS ETFs domiciled in Ireland benefit from favourable withholding tax treaties with the U.S. (15% vs. 30% on U.S.-source dividends/interest). EUR-denominated options (CSH2, IEAC, IHYG) eliminate currency risk. Tax treatment of bond ETF income varies by EU member state.
6. The Full Staircase — Summary Comparison
| Step | Category | Key ETF(s) | Yield | Real Gain | Risk | UK/EU ETF | Best For |
|---|---|---|---|---|---|---|---|
| 1 | U.S. Treasuries | SGOV, USFR | ~3.8% | −0.4% | Lowest | IBTS, IGLS, CSH2 | Parking cash; emergency fund |
| 2 | Foreign Gov Bonds | EMB | ~5.8% | +1.6% | Low– Med | IEMB | Beating price rises; growth |
| 3 | Big Company Bonds | VCSH, LQD | ~4.4– 5.2% | +0.2–1.0% | Medium | VUSC, LQDE, IEAC | Steady income; barbell |
| 4 | Risky Company Bonds | HYG | ~6.5% | +2.3% | High | IHYU, IHYG | Economy-bull; active bet |
| 5 | Tax-Free Munis | VTEB, MUB | ~3.0– 3.5% | Equiv 5.56%* | Low– Med | ISA wrapper (UK) | U.S. high earners; tax play |
| *Tax-equivalent yield at 37% bracket. Yields from fund providers, July 2026. Cross-referenced via app.goatacademy.org. |
The Key Insight: Don't chase the biggest headline number. Compare each step by what you ACTUALLY keep after rising prices and taxes are accounted for. A 3.5% tax-free city bond might put MORE money in your pocket than a 6.5% risky bond that gets taxed and might blow up. That's how professionals think — they chase the best risk-adjusted, tax-adjusted return.
7. The Two-engine Portfolio
The One-Engine Problem. Most regular investors run on one engine — stocks. Growth. "Buy this stock and hope it goes up." One engine. One bet. If the stock market drops, you've got nothing else working for you.
What the Professionals Do. Institutional investors have always run on two engines. Engine 1 is stocks (growth). Engine 2 is bonds (interest income). They work together. When stocks drop, bonds often go up. When growth stalls, interest keeps paying you.
The 15-Year Gap. For 15 years, Engine 2 was dead. Rates were near zero. Everybody forgot it existed. The Fed just rebuilt that engine — it's running at the highest power in over 15 years. Institutional investors noticed immediately: $300 billion into bond ETFs in just six months.
Our View. We are not suggesting investors sell all their stocks. We are observing that having zero exposure to interest-paying investments in the current environment may be leaving value on the table. The framework presented in this report offers a structured way to consider adding a second engine to your portfolio — at whatever risk level matches your personal comfort.
🚀 ENGINE 1 Stocks Growth
+
💰 ENGINE 2 Bonds Interest Income
=
✈️ TWO ENGINES
Balanced Growth + Income
you held too long.
The institutional investors just sold their tech stocks and moved into interest. They knew when to sell. Do you?
💡 Go to https://whentosell.org
8. Risk Factors
Interest Rate Risk. If the Fed raises rates further, longer- duration bond funds (LQD, LQDE) will experience price declines. The "seesaw" effect means a 1% rate increase could result in a ~7–8% price drop for funds with 7–8 years of duration. Shorter-duration funds (SGOV, VCSH) are far less affected.
Credit Risk. Corporate and high-yield bonds carry the risk that the issuing company fails to pay. Default rates rise during economic downturns. HYG's current risk cushion (option- adjusted spread) is historically thin at 246 basis points (iShares, July 2026), meaning investors are receiving less compensation for credit risk than typical historical levels.
Inflation Risk. If price increases accelerate beyond 4.2%, real gains from all steps would shrink. Only Step 4 (HYG at 6.5%) has a meaningful buffer above current levels. Investors should monitor CPI releases for signs of accelerating or decelerating price growth.
Currency Risk (Non-U.S. Investors). Most ETFs discussed are denominated in U.S. dollars. UK and EU investors face FX risk unless they use hedged versions. A declining USD would reduce returns for GBP and EUR investors. Currency- hedged UCITS alternatives are available for most funds.
Liquidity Risk. During market stress, bond ETF prices can deviate from the value of their underlying holdings. This "NAV discount" risk is typically small for large, liquid funds (SGOV, LQD, HYG) but may be more pronounced for less-traded alternatives.
Political & Geopolitical Risk. Emerging market bonds (EMB) carry sovereign risk. Changes in U.S. foreign policy, trade wars, or regional conflicts could affect the creditworthiness of individual countries within the fund.
Tax Risk. Tax laws change. The municipal bond tax exemption could be modified or eliminated by future U.S. legislation. UK ISA rules and EU tax treaties are also subject to change. Investors should not assume current tax benefits will persist indefinitely.