
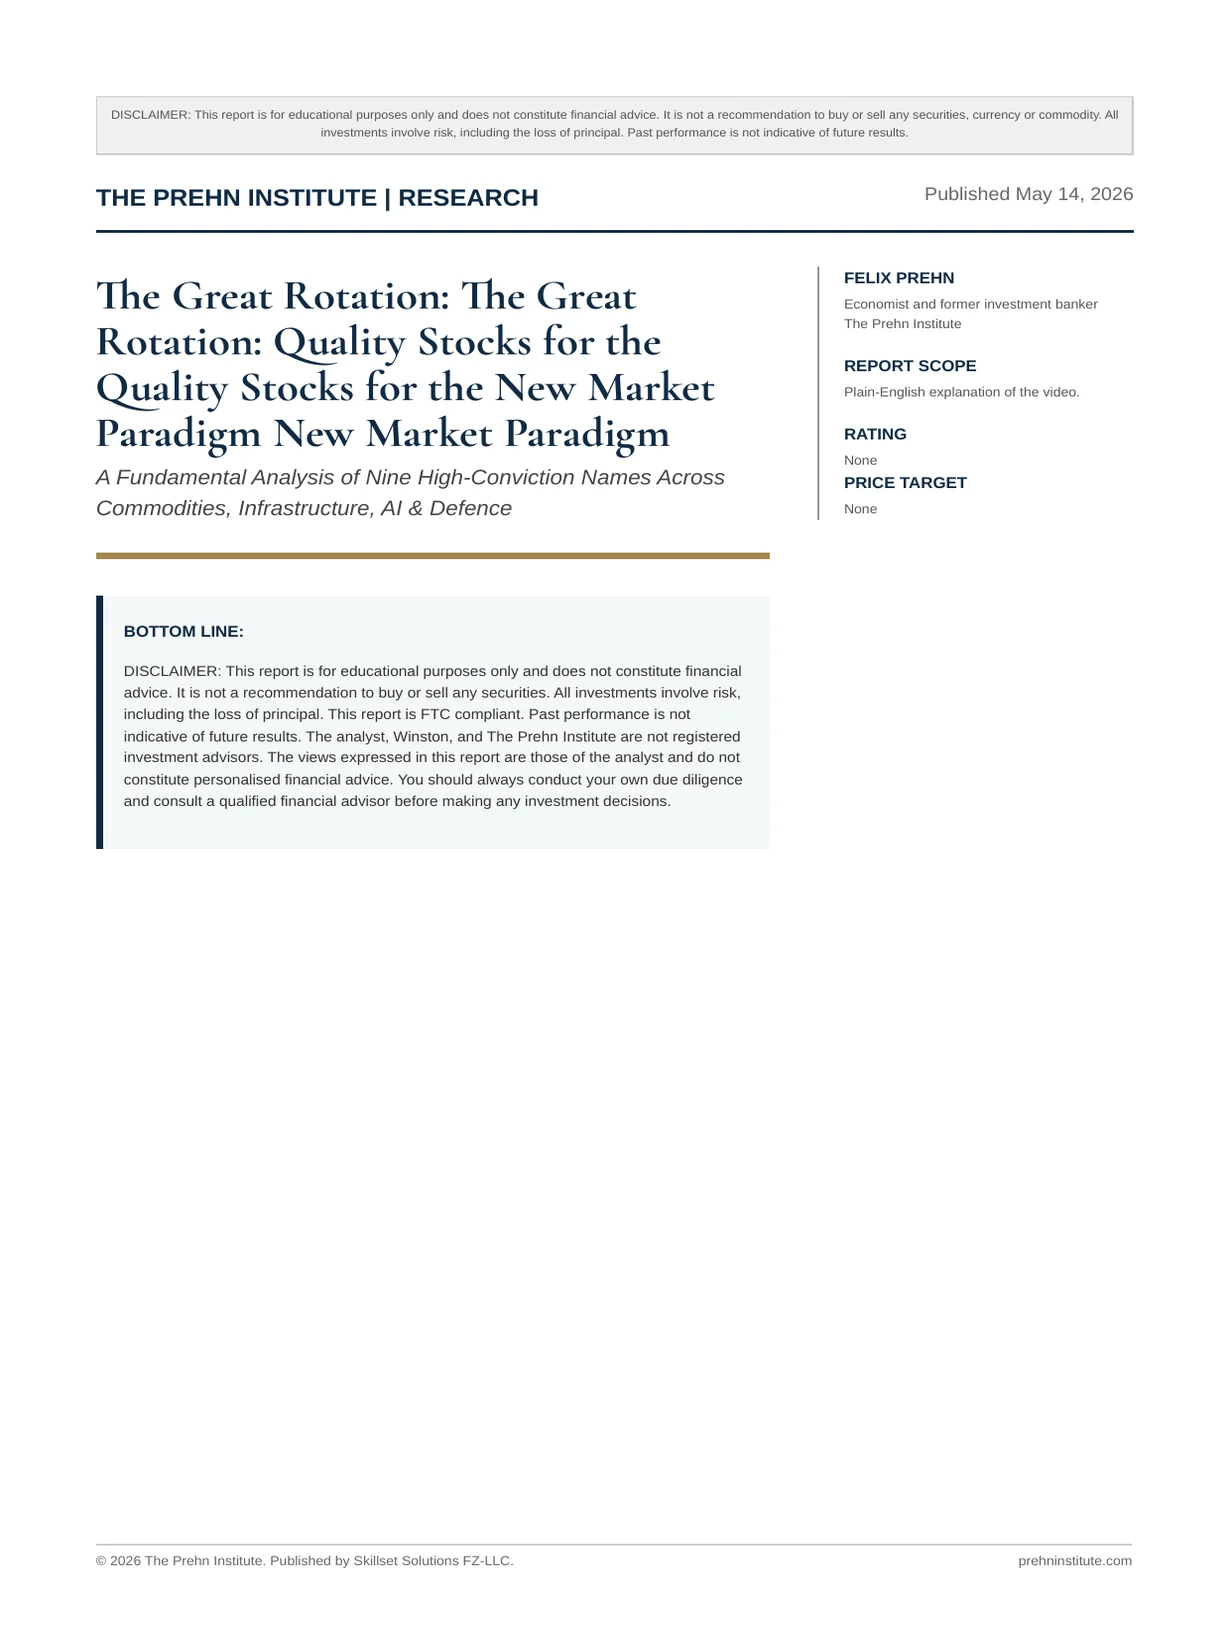
The Great Rotation: The Great Rotation: Quality Stocks for the Quality Stocks for the New Market Paradigm New Market Paradigm
A Fundamental Analysis of Nine High-Conviction Names Across Commodities, Infrastructure, AI & Defence
Felix Nikolas Prehn · 14 May 2026 · 34 pages
Bottom line
DISCLAIMER: This report is for educational purposes only and does not constitute financial advice. It is not a recommendation to buy or sell any securities. All investments involve risk, including the loss of principal. This report is FTC compliant. Past performance is not indicative of future results. The analyst, Winston, and The Prehn Institute are not registered investment advisors. The views expressed in this report are those of the analyst and do not constitute personalised financial advice. You should always conduct your own due diligence and consult a qualified financial advisor before making any investment decisions.
Overview
Copyright ©2026 The Prehn Institute. For educational purposes only. Not financial advice.
Disclosures & Compliance
Mandatory Disclosures & FTC Compliance
IMPORTANT DISCLAIMER — PLEASE READ BEFORE PROCEEDING
DISCLAIMER: This report is for educational purposes only and does not constitute financial advice. It is not a recommendation to buy or sell any securities. All investments involve risk, including the loss of principal. This report is FTC compliant. Past performance is not indicative of future results. The analyst, Winston, and The Prehn Institute are not registered investment advisors. The views expressed in this report are those of the analyst and do not constitute personalised financial advice. You should always conduct your own due diligence and consult a qualified financial advisor before making any investment decisions.
FTC Compliance Statement
This report has been prepared in compliance with Federal Trade Commission (FTC) guidelines. The Prehn Institute and its analyst, Winston, have no material financial interest in any of the securities discussed in this report at the time of publication, unless explicitly disclosed. This report is provided free of charge as an educational resource. No compensation has been received from any company mentioned herein for the preparation or distribution of this report.
No Investment Ratings or Price Targets
This report does not contain buy, sell, or hold ratings for any security. No price targets are provided. All analysis is purely fundamental and educational in nature. The absence of a rating should not be construed as a neutral stance.
Data Accuracy & Sources
All financial data presented in this report has been sourced from publicly available information, including company earnings releases, SEC filings, investor relations pages, and reputable financial data providers. The Prehn Institute has made reasonable efforts to ensure data accuracy; however, no warranty is made as to the completeness, accuracy, or timeliness of the information. Financial figures may differ slightly across sources due to GAAP vs. non-GAAP reporting conventions. All earnings data reflects the most recently available quarterly reports as of the publication date.
Forward-looking Statements
This report may contain forward-looking statements, projections, and estimates. These are based on assumptions and analysis that may prove to be incorrect. Actual results may differ materially from those projected. Readers are cautioned not to place undue reliance on such statements.
Analyst Certification
I, Felix Nikolas Prehn at The Prehn Institute, certify that the views expressed in this report accurately reflect my analysis of the companies discussed. I have not received, and will not receive, direct or indirect compensation in exchange for expressing specific views in this report.
Copyright ©2026 The Prehn Institute. For educational purposes only. Not financial advice.
Distribution
This report is intended for general educational distribution. It is made available to subscribers and readers of The Prehn Institute's educational platforms. It is not directed at institutional investors and does not constitute a research communication under MiFID II or equivalent regulations.
Copyright ©2026 The Prehn Institute. For educational purposes only. Not financial advice.
Felix Prehn
FOUNDER, THE PREHN INSTITUTE • FORMER INVESTMENT BANKER •
Economist
Felix Prehn is a former investment banker. He gained deep insights into the strategies and principles that professional investors use to build and protect wealth.
The Prehn Institute
Felix Prehn is the founder of The Prehn Institute, an educational platform that has taught over 20,000 students the fundamentals of investing and stock market analysis. The Prehn Institute focuses on demystifying Wall Street's investment strategies and making them accessible to regular investors. The academy provides comprehensive training on fundamental analysis, technical analysis, risk management, and portfolio construction—empowering individual investors to make informed decisions about their financial futures.
Tradevision.io
Felix Prehn is also the co-founder of Tradevision.io, a platform dedicated to providing news and data specifically tailored for retail investors. Tradevision.io helps individual investors access the information and tools they need to compete effectively in modern financial markets.
Mission and Dedication
Felix Prehn has dedicated his retirement to teaching regular investors how to protect their wealth and navigate the complexities of the stock market. His approach emphasises understanding the fundamental principles that drive long- term investment success, rather than chasing short-term trends or speculation. By bridging the knowledge gap between Wall Street professionals and individual investors, Felix works to level the playing field and help people take control of their financial destinies.
Connect with Felix Prehn on YouTube youtube.com/felixfriends
About This Report
This report was prepared by Felix Nikolas Prehn at The Prehn Institute, following the Felix Prehn Quality/Growth stock framework. It covers nine equities identified as key beneficiaries of the "Great Rotation" theme — the ongoing structural shift of institutional capital away from consumer-facing, rate-sensitive businesses toward hard-asset
Copyright ©2026 The Prehn Institute. For educational purposes only. Not financial advice. producers, infrastructure builders, AI enablers, and defence contractors. All analysis is fundamental in nature. No technical analysis, buy/sell ratings, or price targets are provided.
Copyright ©2026 The Prehn Institute. For educational purposes only. Not financial advice.
24–25
APPENDIX
Cross-Portfolio Metrics Comparison
Risk Factors & Key Considerations
Learn More from Felix Prehn / CTA
THE GREAT ROTATION: QUALITY STOCKS FOR THE NEW MARKET PARADIGM EXECUTIVE SUMMARY | MAY 2026
Executive Summary
B O T TO M L I N E
The S&P 500 index at all-time highs is not the full story. Our analysis of 152 US industry groups reveals a significant bifurcation: while the headline index trades near record levels, more industries are in confirmed downtrends than uptrends. Capital is rotating — rapidly and structurally — away from consumer- discretionary, advertising, and service sectors toward hard-asset producers, critical infrastructure builders, AI silicon suppliers, and defence contractors. This is not a market crash. It is a rotation, and it has fundamental macro underpinnings: resurgent inflation, negative real wages, near-record institutional equity allocation (NAAIM at 97), and a geopolitical environment unlike any since the Cold War.
This report analyses nine equities positioned on the winning side of that rotation, using the Felix Prehn Quality/Growth framework. We examine gross margins, free cash flow generation, debt structures, return on capital employed, and durable competitive moats. We draw exclusively on the most recent quarterly earnings data available.
Commodity Supercycle: NEM (gold, ~$4,700/oz), CCJ (uranium, structural supply deficit), FCX (copper, EV/AI demand), TTE (energy, #1 S&P sector YTD)
AI & Infrastructure Buildout: AVGO (custom AI silicon, 79% gross margin), FIX (data centre construction, 56% revenue growth), STX (mass data storage, record margins), RKLB (space & defence, 64% revenue growth), PWR (grid infrastructure, record $48.5B backlog)
No ratings, no price targets. We present facts and framework. You decide.
Exhibit 1: Universe Overview — Nine-Stock Coverage
Copyright ©2026 The Prehn Institute. For educational purposes only. Not financial advice.
| Ticker | Company | Sector | Market Cap | Rev Growth (YoY) | Gross Margin | Theme |
|---|---|---|---|---|---|---|
| NEM | Newmont Corp. | Gold Mining | ~$54B | +21% | 67% | Commodity |
| CCJ | Cameco Corp. | Uranium | ~$22B | +25% ~28% Commodity | ||
| FCX | Freeport-McMoRan | Copper Mining | ~$55B | +8.8% |
38.6% Commodity
TTE TotalEnergies SE Integrated Energy +4% prod. ~38% Commodity
AVGO Broadcom Inc. Semiconductors ~$850B +25% 79.1% AI Silicon
FIX Comfort Systems
USA
Eng. & Construction ~$36B +56% 26.3% Infrastructure
STX Seagate Technology Data Storage ~$23B +21% 40.1% AI Storage
RKLB Rocket Lab USA Space & Defence ~$11B +63.5% 43% Defence/Space
PWR Quanta Services Infrastructure ~$46B +26.3% 14.1% Grid/Reshoring
THE GREAT ROTATION: QUALITY STOCKS FOR THE NEW MARKET PARADIGM INVESTMENT THESIS | MAY 2026
The Great Rotation
T H E S I S S TAT E M E N T
A "Great Rotation" is underway in global equity markets. Capital is migrating from consumer-facing, rate- sensitive, and low-growth businesses toward hard-asset producers, physical infrastructure builders, AI enablers, and defence contractors. The S&P 500 headline index, by design, averages the rocketships with the sinking ships. This report identifies nine companies positioned on the winning side of this structural shift.
Copyright ©2026 The Prehn Institute. For educational purposes only. Not financial advice.
What Is the Great Rotation?
The term "Great Rotation" describes a sustained, structural reallocation of institutional capital between sectors of the economy. Unlike cyclical sector rotations driven purely by valuation, the current rotation is being driven by a confluence of macro forces that are unlikely to reverse in the near term: resurgent inflation, a geopolitical reorientation toward hard power and resource security, and the single largest infrastructure investment cycle since the US Interstate Highway System.
Our tracking of 152 US industry groups reveals that while the S&P 500 headline index trades near all-time highs, more industries (64) are in confirmed declining patterns than are in climbing patterns (55). The index's strength is being carried by a concentrated set of industries — predominantly commodities, infrastructure, AI semiconductors, and defence — while the majority of the index quietly deteriorates.
An investor holding a passive index fund "owns" both outcomes simultaneously: the 523% gain in a Micron and the 54% loss in a Nike. The index gives you the average. Selective, fundamental investment gives you the choice of which side you want to be on.
Macro Drivers of the Rotation
Driver 1 — Resurgent Inflation. CPI running at approximately 3.8% — nearly double the Federal Reserve's stated 2% target — provides the structural underpinning for the rotation. Inflation favours real- asset owners and punishes holders of long-duration financial assets. Producers of gold, uranium, copper, and hydrocarbons are the canonical inflation beneficiaries. Energy costs alone were up approximately 18% year-on-year as of early 2026, meaning energy companies are printing cash while consumer-facing businesses absorb margin compression.
Copyright ©2026 The Prehn Institute. For educational purposes only. Not financial advice.
Driver 2 — Negative Real Wages. Real wages — nominal wage growth adjusted for inflation — are negative by approximately 0.3%. This is a silent tax on the consumer. Consumer-facing industries (retail, advertising, leisure, apparel) face structurally weakening demand. The shoe companies, advertising conglomerates, and professional services firms on the wrong side of this rotation are not suffering from bad management; they are suffering from an adverse macro environment. When the consumer is squeezed, discretionary spending contracts first.
Driver — Near-Maximum Institutional
Allocation. The NAAIM Exposure Index — which surveys professional money managers on their equity allocation — recently touched 97 out of 100. Ninety- seven percent of professional capital is already in the market. This does not mean the market falls; it means that the marginal driver of returns is no longer the arrival of new money but the reallocation of existing money. WHERE institutional capital moves matters more than WHETHER it enters equities. That "where" is sectors covered in this report.
Driver 4 — The AI Infrastructure Supercycle. Hyperscaler capital expenditure on AI data centres — from Microsoft, Amazon, Google, and Meta — collectively exceeds $200 billion annually, and this figure is rising. Every data centre requires chips, storage, cooling systems, electrical infrastructure, and physical construction. This creates a multi-year demand chain that flows through every AI-adjacent name in Part II of this report: from custom silicon (AVGO) to storage media (STX) to the physical construction firms that build the facilities (FIX, PWR).
Driver 5 — The Defence and Reshoring
Supercycle. Global defence budgets are at multi- decade highs. Europe is rearming for the first time since the Cold War. The US CHIPS Act and Inflation Reduction Act have seeded a multi-decade domestic manufacturing revival. America is rebuilding its industrial base — semiconductor fabs, battery plants, EV factories — and the companies that install the electrical infrastructure, wiring, and mechanical systems for these facilities are growing faster than any period since the post-WWII industrial boom.
WHY
FELIX
Prehn's
Framework
Applies Here
The Felix Prehn Quality/Growth framework screens for companies with expanding gross margins, robust free cash flow generation, manageable debt, rising return on capital, and durable competitive moats — all while avoiding speculative names whose valuations are detached from fundamentals. This framework is specifically well-suited to the current environment because inflation rewards operational efficiency: companies with high gross margins can absorb input cost pressures that would be fatal to commodity- margin businesses.
Each stock in this report is evaluated against these five dimensions. The analysis draws on the most recent quarterly earnings data, investor relations filings, and earnings call transcripts available as of publication date. All data has been cross-referenced against a minimum of two independent sources.
THE GREAT ROTATION: QUALITY STOCKS FOR THE NEW MARKET PARADIGM PART I — COMMODITY SUPERCYCLE
Copyright ©2026 The Prehn Institute. For educational purposes only. Not financial advice.

P a R T I O F I I
The Commodity Supercycle
Inflation Playbook
Inflation at 3.8% — nearly double the Federal Reserve's 2% target — is not merely a macroeconomic statistic. It is a transfer of wealth from holders of financial assets and fiat currency to owners of real, physical assets: precious metals, energy resources, and industrial metals. The Commodity Supercycle thesis holds that this inflationary regime is structural, not transitory, and that the companies extracting and refining these commodities will continue to generate superior economics for an extended period.
Gold has crossed trillion in the US alone) that incentivise diversification into hard assets. Uranium trades at 10,800 per metric tonne as the structural backbone of the energy transition: every EV requires four times more copper than a combustion vehicle; every AI data centre, solar installation, and wind farm requires significant copper wiring. Energy leads all S&P 500 sectors year-to-date, up approximately 28%.
The four companies in Part I are positioned to capture this structural commodity tailwind through large, low- cost, long-lived production assets with established reserve bases and significant operating leverage to commodity prices. They are not speculative junior miners making promises; they are the blue-chip operators of the most strategically important resource extraction businesses on Earth.
Exhibit 2: Commodity Price Performance — 12-Month Summary
| Commodity | Current Price | 12-Month Change | Key Demand Driver | Supply Dynamic |
|---|---|---|---|---|
| Gold | ~$4,700/oz | +47% | Central bank buying, inflation hedge | Fixed; mines slow to respond |
| Uranium | ||||
| (LT) |
$87/lb +21% Nuclear renaissance, AI data centres Structural deficit; 98% US import dependency
Copper ~$10,800/t +43% EVs, renewables, AI infrastructure 1M tonne deficit forecast; supply constraints
Oil (Brent) ~$85/bbl +18% energy costs
Geopolitical tension, demand resilience OPEC+ production management
4, 700perounce—up47
87/lbonlong − termcontracts, supportedbyaglobalnuclearrenaissanceanda98
Copyright ©2026 The Prehn Institute. For educational purposes only. Not financial advice.
Copyright ©2026 The Prehn Institute. For educational purposes only. Not financial advice.

NEW MARKET PARADIGM
NEM
G O L D M I N I N G | N Y S E : N E M | S & P 5 0 0
Newmont Corporation
Market Capitalisation
~$54 Billion
67% Gross Margin
$7.3B
FCF (FY2025E)
0.16 Debt/Equity
25.9% ROCE
+21% Rev. Growth
$13.5B
EBITDA (FY2025E)
A N A LY S T T H E S I S
Newmont is the world's largest gold miner and the blue-chip expression of a gold price at all-time highs above 7.3 billion in FCF for FY2025 (a near-doubling from the prior year), carries a net cash position of $3.5 billion, and trades on a gross margin of approximately 67%. With gold's structural tailwinds intact — central bank buying, inflation, and sovereign debt concerns — Newmont offers the most liquid and highest-quality vehicle for gold exposure in global equity markets. Its ROCE of 25.9% confirms that capital is being deployed productively, not simply riding commodity prices passively.
Exhibit 3: NEM — Key Financial Metrics Summary
| Metric | FY2024 | FY2025E | Change | Quality Assessment |
|---|---|---|---|---|
| Revenue | $18.7B | $22.7B | +21.4% | Strong; driven by gold price + volume |
| Gross Margin | 52.0% | 67.4% |
+1,540 bps Exceptional expansion; operating leverage
EBITDA $7.1B $13.5B +90% Near-doubling; record for the company
Free Cash Flow ~$3.8B $7.3B +92% Record; strong capital return capacity
Net Debt/Cash Net Debt +$3.5B Cash Improved Net cash position; D/E only 0.16
ROCE — 25.85% — High; significantly above cost of capital
4, 700/oz.ThecompanyreportedrecordfreecashflowinQ12026, isprojecting
Copyright ©2026 The Prehn Institute. For educational purposes only. Not financial advice.
Gross Margin Analysis
Newmont's gross margin trajectory is perhaps the most striking aspect of the investment case. The company expanded from 52.0% in FY2024 to a projected 67.4% in FY2025 — a 1,540 basis point improvement. The most recent data point shows margins at 67.4%, confirming that this is not a forecast artefact but a demonstrated operational outcome.
The driver is straightforward: gold price leverage. Newmont's cost structure (All-In Sustaining Costs) is relatively fixed in the near term, while its revenue tracks the gold price directly. With gold up 47% year- on-year, the incremental revenue flows almost entirely to the gross profit line. This is the definition of operating leverage in a commodity business, and it is working in Newmont's favour with maximum effectiveness at current gold price levels.
Critically, this margin expansion is durable so long as gold prices remain elevated — and the structural factors driving gold (central bank demand, inflation, dollar debasement concerns) are not short-term phenomena. Central banks purchased 755 tonnes of gold in 2025 alone, nearly double pre-2022 averages.
Free Cash Flow Trends
Newmont reported record free cash flow in Q1 2026, with full-year FY2025 FCF projected at
3.8 billion in
FY2024. This FCF generation is extraordinary by any measure and reflects both the gold price tailwind and the company's successful integration of Newcrest Mining assets (acquired in 2023), which meaningfully expanded its production base.
Free cash flow of
54 billion implies an FCF yield of approximately 13.5% — a figure that would be remarkable in any
7.3billion—anear − doublingfromapproximately
7.3billiononamarketcapofapproximately
Copyright ©2026 The Prehn Institute. For educational purposes only. Not financial advice. sector, and is particularly notable for a business with the quality characteristics Newmont exhibits. Management maintained full-year 2026 guidance on the Q1 2026 call, signalling continued confidence in cash generation.
Debt Ratios & Balance Sheet Health
Newmont's balance sheet has transformed. The company now carries a net cash position of
1.00/share annually) while funding capital investment from operating cash flows.
A debt-to-equity of 0.16 in a capital-intensive mining business is a quality signal. It means that in a gold price downturn, Newmont has the financial resilience to maintain production and wait out the cycle rather than being forced into dilutive equity issuances or asset sales. This is the balance sheet of a quality company, not a leveraged commodity bet.
Roce — Return on Capital Employed
Newmont's ROCE stands at 25.85% — substantially above any reasonable estimate of its cost of capital. A ROCE materially above the cost of capital is the definitive signal that a company is creating — not destroying — economic value. For a mining company operating large, capital-intensive physical assets, this level of ROCE is exceptional and reflects the combination of gold price tailwinds and operational improvements following the Newcrest integration.
Competitive Moat
Moat Classification: Scale + Asset Quality + Reserves Depth. Newmont's competitive advantages are structural. The company operates the largest and most geographically diversified portfolio of gold mining assets in the world, with significant reserves across North America, South America, Australia, and West Africa. Scale in mining translates directly to cost efficiency: larger operations spread fixed costs over more ounces, resulting in lower All-In Sustaining Costs per ounce than smaller competitors. The company's reserve life index — how many years of production are covered by current reserves — provides a long- duration visibility that most businesses cannot match. New entrants face 10-15 year lead times from discovery to production, creating a formidable barrier to entry.
Recent Earnings Highlights
Q1 2026: Management reported record free cash flow for the quarter, maintained full-year 2026 guidance, and highlighted strong operational performance across its portfolio of tier-one mines. The company demonstrated disciplined cost management while capturing the full benefit of record gold prices. No material operational disruptions were reported. The dividend was maintained, consistent with Newmont's capital allocation framework.
FY2025 Full Year: Revenue grew 21.4% to
13.5 billion. Gross margin expanded by over 1,500 basis points. The company completed the integration of Newcrest assets, achieving synergies ahead of schedule.
ETF Alternative
For investors seeking sector exposure with reduced single-stock risk, the VanEck Gold Miners ETF (GDX) provides diversified exposure across global gold producers. GDX holds Newmont as its largest position. The GDX has significantly outperformed the
3.5billionandadebt −to − equityratioofjust0.16.Thisisasignificantimprovementfromthepost − Newcrestacquisitionleverageprofile, anditpositionsthecompanytosustain—andgrow—i
22.7billion.EBITDAnearlydoubledto
Copyright ©2026 The Prehn Institute. For educational purposes only. Not financial advice. underlying gold commodity on the upswing, consistent with the operating leverage dynamic described above.
Key Risk Factors
Gold Price Reversal: The primary risk to Newmont is a sustained decline in the gold price. While structural factors support gold, a rapid shift in monetary policy toward aggressive tightening could pressure the metal. Operational Risk: Mining operations in politically complex jurisdictions carry permit, labour, and regulatory risk. ESG: Large-scale open-pit mining carries environmental obligations and community relations requirements that add operational complexity and potential future liabilities.
Copyright ©2026 The Prehn Institute. For educational purposes only. Not financial advice.

NEW MARKET PARADIGM
CCJ
W E S T E R N U R a N I U M P R O D U C E R
Cameco Corporation
U R A N I U M P R O D U C T I O N | N Y S E : C C J | W O R L D ' S L A R G E S T Market
Capitalisation
~$22 Billion
CANADA
~28% Gross Margin
Ca$789m
Q1 2025 Revenue
0.36 Cash/Debt Ratio
23.5% Fwd ROE (3yr)
+25% Rev. Growth (Q1)
$1.9B
Adj. EBITDA (FY2025E)
A N A LY S T T H E S I S
Cameco is the largest uranium producer in the Western world, and we believe it is positioned at the intersection of two of the most powerful macro forces of this decade: the global nuclear renaissance and the energy demands of the AI economy. Uranium is no longer a fringe energy debate — it has been classified as a US national security asset under Section 232, and the US produces only approximately 1 million pounds domestically against an annual demand of 50 million pounds. This structural supply deficit, combined with growing reactor demand (China has 60 reactors running and 38 under construction), creates a multi-year pricing tailwind. Cameco's vertically integrated position — now including a stake in Westinghouse — means it captures value across the entire nuclear fuel cycle.
Exhibit 4: CCJ — Key Financial Metrics Summary
| Metric | Q1 2024 | Q1 2025 | Change | FY2025E |
|---|---|---|---|---|
| Revenue (CA$) | ~$631M | $789M | +25% | +11% FY est. |
| Net Income Margin | Net Loss |
8.8% Turnaround Expanding
Adj. EBITDA — — — ~$1.9B (+26%)
Cash/Debt Ratio — 0.36 — Healthy
Uranium Production — — — Up to 20Mlbs (2025)
Forward ROE (3yr) — — — 23.5%
Copyright ©2026 The Prehn Institute. For educational purposes only. Not financial advice.
Gross Margin Analysis
Cameco's gross margin profile is evolving through a structural shift. The company's cost of production is relatively fixed under its long-term contracts with utilities, while realised uranium prices are rising — a dynamic that compresses margins in falling price environments but creates powerful expansion as prices rise. The net income margin in Q1 2025 was reported at 8.8%, representing a return to profitability from a net loss in the prior-year comparable period. This turnaround reflects Cameco's long-term contract book coming into alignment with the higher pricing environment.
The key distinction in Cameco's margin profile is the split between spot and long-term contract pricing. The long-term contract price reached
1.9 billion, an acceleration that demonstrates the operating leverage inherent in the business model.
Free Cash Flow Trends
Cameco's free cash flow is supported by the stability of its long-term contract book with major nuclear utility companies globally. The company's dividend is described by management as "well supported by cash flows," indicating that dividend coverage is not a concern at current production and pricing levels. The company expects to produce up to 20 million pounds of uranium in 2025 from its own operations, providing a clear baseline for cash generation.
Importantly, Cameco's FCF profile will improve materially as its Westinghouse stake (held through its Westinghouse joint venture with Brookfield) begins to contribute more substantially to consolidated financials. Westinghouse is the world's leading nuclear services company — it services approximately 50% of the world's reactor fleet — and adds a high-margin, recurring revenue stream to Cameco's traditionally volume-and-price-driven mining revenue.
As of March 2025, Cameco maintained a healthy cash- to-debt ratio of 0.36, indicating that while the company does carry debt (primarily associated with the Westinghouse acquisition financing), it is not in a position of financial stress. The balance sheet is more leveraged than Newmont but is appropriate for a company of Cameco's scale and cash flow profile. Management's dividend maintenance through periods of uranium price volatility signals confidence in balance sheet resilience.
Roce & Return Metrics
While specific historical ROCE data was not available for recent quarters, forward return metrics are compelling: consensus forecasts project a 23.5% return on equity over the next three years. This reflects the combination of improving margins, a growing asset base (post-Westinghouse), and increasing uranium production volumes. For a capital-intensive mining and processing business, a 23.5% forward ROE is a strong quality signal.
Competitive Moat
Moat Classification: Tier-One Asset Ownership + Vertical Integration + Strategic Government
Designation. Cameco's McArthur River and Cigar Lake operations in Saskatchewan, Canada, are among the highest-grade uranium deposits on the planet. High ore grades translate directly to lower production costs and larger cash flow per tonne of ore processed — a permanent structural advantage over lower-grade competitors. The classification of uranium as a US national security asset under Section 232 effectively creates a government- backed demand floor, particularly for Western- sourced supply. Russia's Rosatom — historically a significant supplier — faces geopolitical restrictions, redirecting demand to Cameco specifically.
87/lbbyend −
2025, andasoldercontractsrolloffandarereplacedatcurrentmarketrates, marginexpansi
Copyright ©2026 The Prehn Institute. For educational purposes only. Not financial advice.
Recent Earnings Highlights
Q1 2025: Revenue grew 25% year-on-year to CA$789.4 million. EPS and revenue came in slightly below analyst consensus but still represented a meaningful year-over-year improvement and a return to profitability. Management maintained consolidated earnings guidance for the full year 2025. Production guidance confirmed at up to 20 million pounds for the year.
Long-Term Contract Book: Cameco's contract book with global utilities provides revenue visibility stretching years into the future. This is not a spot-price- dependent business; it is a contracted utility supplier with predictable volumes and increasing price floors.
ETF Alternative
The Global X Uranium ETF (URA) and the Sprott Uranium Miners ETF (URNM) provide broader exposure to the uranium sector. URA and URNM have significantly outperformed broader markets as uranium prices have risen. Both hold Cameco as a top position.
Key Risk Factors
Uranium Price Volatility: Spot prices between
83/lb in Q1 2025 showed meaningful volatility; a sustained decline to below production costs would impair economics. Regulatory/Political Risk: Nuclear policy shifts in key markets (Germany's reactor closures, for example) could dampen demand. Production Risk: Underground mining operations at Cigar Lake and McArthur River carry operational risk from flooding and geological challenges. Westinghouse Integration: The Westinghouse acquisition introduced significant new complexity and debt into the corporate structure.
63–
Copyright ©2026 The Prehn Institute. For educational purposes only. Not financial advice.

NEW MARKET PARADIGM
FCX
C O M P O N E N T
Freeport-McMoRan Inc.
C O P P E R & G O L D M I N I N G | N Y S E : F C X | S & P 5 0 0 Market Capitalisation
~$55 Billion
38.6% Gross Margin
$1.75B
FCF (LTM)
$6.7B
Net Debt
13.3% ROCE
+8.8% Rev. Growth (Q1)
$9.7B
LTM EBITDA
A N A LY S T T H E S I S
Freeport-McMoRan is the purest large-cap expression of the copper demand mega-trend. Copper is not a speculative commodity; it is the physical backbone of electrification. Every EV uses four times more copper than a conventional vehicle. Every solar panel, wind turbine, AI data centre, and power grid upgrade requires copper wiring. BloombergNEF forecasts a 1 million metric tonne supply deficit in global copper markets, and supply is deteriorating: production problems in Indonesia, disruptions in Chile, and China curtailing critical chemical exports used in copper processing are structural — not short-term — constraints. When supply shrinks and demand from multiple structural megatrends grows simultaneously, the economics for the world's dominant copper producer are highly compelling. FCX reported Q1 2026 results that beat both revenue and EPS estimates, and analyst consensus expects earnings to grow more than 34% over the next twelve months.
Exhibit 5: FCX — Key Financial Metrics Summary (LTM & Q1 2026)
| Metric | LTM / Most Recent | Q1 2026 YoY | Quality Assessment |
|---|---|---|---|
| Revenue | LTM: $26.3B | +8.8% to $6.23B | Beat consensus estimates |
| Gross Margin |
38.6% — Strong for a mining company
EBITDA $9.69B — Robust; high copper price leverage
Free Cash Flow $1.75B — Positive; reinvestment phase ongoing
Net Debt $6.66B — Manageable at current EBITDA; D/EBITDA
~0.7x
ROCE 13.3% — Above cost of capital; value-creating
Fwd. Earnings Growth — +34%+
(consensus)
Strong growth ahead at current copper prices
Copyright ©2026 The Prehn Institute. For educational purposes only. Not financial advice.
Copyright ©2026 The Prehn Institute. For educational purposes only. Not financial advice.
Gross Margin Analysis
FCX's gross margin of 38.6% (LTM) is strong for a mining company and reflects the combination of the company's scale, operational excellence, and high copper price realisation. Mining gross margins are inherently lower than technology or pharmaceutical businesses because the cost of ore extraction, processing, and logistics is significant — but FCX's margin is at the high end of its peer group, reflecting the quality of its asset base.
The Grasberg mine in Indonesia — one of the largest copper and gold deposits in the world — produces copper at a cost that makes FCX one of the lowest-cost producers globally when gold by-product credits are factored in. By-product credits from gold and molybdenum materially improve FCX's net copper cost per pound, which is a key differentiator from single-metal miners. In a high gold price environment (gold at ~$4,700/oz), these credits become extremely valuable.
FCX generated $1.75 billion in free cash flow over the last twelve months. This is somewhat below what the commodity price environment might suggest, and the explanation is deliberate reinvestment: the company is in an active capital expenditure cycle to expand smelting capacity in Indonesia and ramp up underground mining at Grasberg. These investments should begin delivering higher throughput and lower unit costs over the next 18-36 months.
Critically, FCF at current copper prices of
3.50-$4.00/lb, well below current levels). This creates a significant latent FCF buffer: if management had modelled current prices when planning capex, they would project substantially higher free cash flow going forward.
10, 800/tonneismeaningfullyhigherthana
Copyright ©2026 The Prehn Institute. For educational purposes only. Not financial advice.
Debt Ratios & Balance Sheet Health
Net debt of
9.69 billion, implying a net debt/EBITDA of approximately 0.7x. This is a conservative leverage ratio for a mining company with FCX's asset quality and cash generation. The debt is comfortably serviceable from operating cash flows and does not represent a material financial risk at current commodity prices. FCX has demonstrated disciplined capital allocation, using commodity windfalls to reduce debt rather than overextend on acquisitions.
ROCE
ROCE of 13.3% for the last twelve months confirms that FCX is creating economic value above its cost of capital. For a business with significant physical capital deployed in large mining operations, maintaining ROCE above 10% is a quality signal. With copper prices elevated and production volumes growing, we expect ROCE to expand materially over the next two years.
Competitive Moat
Moat Classification: Asset Scale + Resource
Quality + Cost Position. The Grasberg mine in Indonesia is one of the largest copper and gold deposits ever discovered. Its scale — and the multi- decade reserve life still ahead of it — makes it almost impossible to replicate. New copper mines require 10-15 years and billions in development capital before producing a single pound. FCX's existing production infrastructure, established relationships with the Indonesian government, and decades of operational experience at the world's most significant copper mines constitute a moat that no new entrant can meaningfully challenge within a relevant investment time horizon.
Q1 2026: Both revenue ($6.23 billion, +8.8% YoY) and EPS beat analyst estimates. Management cited strong operational execution and a favourable commodity price environment. No material guidance revisions were made. Analyst consensus upgrades followed the beat, with expectations for 34%+ earnings growth in the next twelve months — a reflection of how leveraged FCX's earnings are to the copper price.
ETF Alternative
The Global X Copper Miners ETF (COPX) provides diversified exposure to global copper miners. FCX is typically a top holding. For broader base metals exposure, the iShares MSCI Global Metals & Mining Producers ETF (PICK) also provides relevant exposure.
Key Risk Factors
Copper Price Decline: FCX's earnings are highly leveraged to copper. A reversal driven by global economic slowdown could materially impair results. Indonesian Jurisdiction Risk: Grasberg operates under government-negotiated contract terms. Any renegotiation of those terms represents a business risk. Indonesia Smelting Ramp: The new domestic smelting requirement imposed by the Indonesian government adds capital and execution risk. China Demand: Approximately 55% of global copper consumption is in China; any material Chinese economic slowdown would weaken prices.
6.66billioncomparestoLTMEBITDAof
Copyright ©2026 The Prehn Institute. For educational purposes only. Not financial advice.

NEW MARKET PARADIGM
TTE
S U P E R M a J O R
TotalEnergies SE
I N T E G R AT E D E N E R G Y | N Y S E : T T E | E U R O P E A N Market Capitalisation
~$128 Billion
~38% Gross Margin
$7.0B
CFFO (Q1 2025)
14.3% Gearing Ratio
13.2% ROCE
+19% EBITDA Growth (Q1)
$12.6B
Adj. EBITDA (Q1 2026)
A N A LY S T T H E S I S
TotalEnergies is the energy sector's most diversified supermajor, straddling the traditional hydrocarbon business and a rapidly growing integrated power and renewables division. Energy is the number one performing S&P 500 sector year-to-date, up approximately 28%, and TotalEnergies is capturing this performance at the production level while building the next energy infrastructure for LNG, solar, and power trading. The company delivered Q1 2025 adjusted net income of 2 billion quarterly buyback, and increased its interim dividend — all while keeping gearing (net debt/equity) at a conservative 14.3%. With ROCE at 13.2% and production growing (oil and gas up 4% YoY, electricity production up 18% YoY), TotalEnergies is executing a dual mandate that most energy companies are not: harvest oil and gas cash flows while building the next-generation energy platform.
Exhibit 6: TTE — Key Financial Metrics Summary
| Metric | Q1 2025 | Q1 2026 | Change | Quality Assessment |
|---|---|---|---|---|
| Adj. Net Income | $4.2B | — | — | Strong; robust oil price environment |
| Adj. EBITDA |
— $12.6B +19% YoY Record quarter; all segments contributing
Cash Flow from Ops. $7.0B — — Excellent cash conversion
Gearing (Net D/E) 14.3% — — Conservative; industry best-in-class
ROCE 13.2% — — Above cost of capital; value-accretive
Oil & Gas Production — +4% YoY — Growing volumes; LNG focus
Electricity Production — +18% YoY — Renewables + gas power expanding rapidly 4.2billion, maintaineda
Copyright ©2026 The Prehn Institute. For educational purposes only. Not financial advice.
Copyright ©2026 The Prehn Institute. For educational purposes only. Not financial advice.
Gross Margin Analysis
TotalEnergies operates across the full energy value chain — exploration, production, refining, marketing, power generation, and renewable energy — making a simple gross margin calculation less meaningful than for pure-play producers. The company's approximately 38% blended gross margin reflects the mix of high- margin upstream production (where oil and gas are extracted at low per-barrel costs) and lower-margin downstream refining and marketing activities.
The upstream division is the primary margin engine. TotalEnergies' production portfolio — heavily weighted toward LNG (liquefied natural gas), which commands premium pricing in constrained global markets — generates excellent upstream margins. The growing integrated power division (solar, wind, storage, and power trading) is lower margin on a percentage basis but provides volume growth and strategic positioning. The combination is more resilient than a pure hydrocarbon producer and arguably better positioned for the next decade of energy economics.
Free Cash Flow Trends
TotalEnergies generated
28 billion. This figure illustrates why the company is able to simultaneously maintain a
17-18 billion in annual capital expenditure, and maintain conservative leverage. The cash machine at TotalEnergies is running at full capacity.
Management has guided for "growing cash flow" on a per-share basis as its primary financial objective, which aligns management incentives with shareholder returns. Capital discipline has been a consistent feature of TotalEnergies' management approach — capex guidance was maintained at full-year levels despite the attractive commodity environment, reflecting a deliberate choice to return cash to shareholders rather
7.0billionincashflowfromoperationsinQ1
2billionquarterlybuybackprogramme, incr
Copyright ©2026 The Prehn Institute. For educational purposes only. Not financial advice. than over-invest at peak cycle.
Debt Ratios & Balance Sheet Health
A gearing ratio of 14.3% (net debt to equity) is exceptionally conservative for a supermajor. Peer comparison: BP typically operates at 25-30% gearing; Shell at 15-20%. TotalEnergies is at the lower end of the peer group, providing significant financial flexibility. This low leverage is not an accident — it is the result of deliberate capital allocation choices made over the commodity price cycles of the past decade, building a balance sheet capable of withstanding a prolonged oil price downturn without operational constraint.
ROCE
ROCE of 13.2% for the twelve months ending March 2025 confirms that TotalEnergies is generating returns above its estimated cost of capital. For an integrated energy business deploying capital across both high- return upstream assets and longer-payback renewable infrastructure, 13.2% is a strong result. It indicates that management's capital allocation across its diversified portfolio — not just the commodity-price-driven upstream — is generating economic value.
Competitive Moat
Moat Classification: Integrated Value Chain + LNG Positioning + Scale and Diversification. TotalEnergies' moat is multi-dimensional. In upstream, it holds significant, long-lived production assets in Africa, the Middle East, and the North Sea that cost-effectively produce hydrocarbons over multi-decade lifespans. Its LNG business — TotalEnergies is one of the world's largest LNG traders — benefits from proprietary liquefaction capacity, long-term supply contracts, and a global shipping and trading infrastructure that smaller competitors cannot replicate. Its growing integrated power division (renewables, gas power, electricity trading) is building a moat in the energy of the
Copyright ©2026 The Prehn Institute. For educational purposes only. Not financial advice.

future alongside monetising the energy of the present.
Recent Earnings Highlights
Q1
2025: Adjusted net income of
7.0 billion. $2 billion Q2 2025 share buyback maintained. Interim dividend increased, signalling management confidence in cash flow sustainability. Full-year 2025 guidance reiterated for both production growth and capex. Electricity production grew 18% year-on-year, reflecting the accelerating buildout of the integrated power business.
Q1 2026: Adjusted EBITDA reached $12.6 billion, a 19% year-on-year increase, with contributions from all major business segments.
ETF Alternative
The Energy Select Sector SPDR Fund (XLE) and the iShares Global Energy ETF (IXC) provide exposure to the broader energy sector. TotalEnergies is a significant holding in both. For European energy supermajor exposure specifically, IXC is the more relevant vehicle.
Key Risk Factors
Oil Price Risk: Approximately 50% of TotalEnergies' earnings are sensitive to the oil price. A sustained move below $60/bbl would materially impair returns. Energy Transition Risk: Long- term hydrocarbon demand uncertainty creates asset stranding risk for older, higher-cost production assets. Geopolitical Risk: Operations in Africa, the Middle East, and Russia-adjacent LNG projects carry geopolitical complexity. Currency Risk: As a French-listed company reporting in USD for ADR holders, EUR/USD moves affect reported returns.
THE GREAT ROTATION: QUALITY STOCKS FOR THE NEW MARKET PARADIGM PART II — AI, INFRASTRUCTURE & DEFENCE
P a R T I I O F I I
AI, Infrastructure & Defence
AI Age
4.2billion.Cashflowfromoperationsof
Copyright ©2026 The Prehn Institute. For educational purposes only. Not financial advice.
The second leg of the Great Rotation is defined by the physical infrastructure buildout required to support the economy, the reshoring of American manufacturing, and the largest global defence spending cycle since the Cold War. These are not software businesses trading on narrative; they are companies with multi-billion-dollar backlogs, long-term government and hyperscaler contracts, and demonstrated earnings growth measured in hundreds of percent over recent years.
Every AI data centre requires chips, storage, cooling systems, electrical infrastructure, physical construction, and a connection to the power grid. The hyperscalers — Microsoft, Amazon, Google, Meta — are collectively investing over $200 billion per year in this buildout. That capital flows through precisely the five companies in Part II. Broadcom supplies custom AI silicon. Seagate supplies mass data storage. Comfort Systems builds the mechanical and electrical systems. Quanta Services connects the facilities to the grid. Rocket Lab provides the space-based component of the defence and communications infrastructure that increasingly underpins national security.
These are the companies that are, quite literally, building the next decade of American infrastructure. They were largely invisible to retail investors five years ago. They are now among the highest-performing stocks in the entire US equity market — not because of hype, but because of earnings growth that validates their position in the economy.
Copyright ©2026 The Prehn Institute. For educational purposes only. Not financial advice.

NEW MARKET PARADIGM
AVGO
Av G O | S & P 5 0 0 / N a S D a Q - 1 0 0
Broadcom Inc.
S E M I C O N D U C T O R S & I N F R A S T R U C T U R E S O F T WA R E | N A S D A Q :
Market Capitalisation
~$850 Billion
79.1% Gross Margin
$6.01B
FCF (Q1 FY2025)
$51.9B
Net Debt
18.7% ROCE
+25% Revenue Growth
$10.1B
Adj. EBITDA (Q1)
A N A LY S T T H E S I S
Broadcom is a generational AI infrastructure investment operating at institutional scale. The company produces custom AI accelerator chips (XPUs) for hyperscalers — Google, Meta, ByteDance — that represent the fastest-growing segment in the semiconductor industry. Its Q1 FY2025 results were exceptional by any measure: revenue of 6.01 billion (40% of revenue), and AI-specific revenue growing 77% year-on-year. The company's infrastructure software segment — anchored by the VMware acquisition — adds a complementary, recurring revenue stream with high switching costs. A gross margin of 79.1% is not just remarkable for a semiconductor company; it is remarkable by any standard, and it reflects the pricing power that comes from providing irreplaceable custom silicon to the most valuable companies on Earth.
Exhibit 7: AVGO — Key Financial Metrics Summary (Q1 FY2025) 14.9billion(+25
Copyright ©2026 The Prehn Institute. For educational purposes only. Not financial advice.
| Metric | Q1 FY2024 | Q1 FY2025 | Change | Quality Assessment |
|---|---|---|---|---|
| Revenue | $11.9B | $14.9B | +25% | Record; beat consensus |
| AI Revenue |
— Significant +77%
YoY
Fastest-growing segment in semis
Gross Margin (Non- 76.4% 79.1% +270 bps World-class; exceptional pricing power
Adj. EBITDA $7.9B $10.1B +28% 68% EBITDA margin; near-unique
Free Cash Flow $4.8B $6.01B +25% 40% FCF margin; cash conversion excellent
Net Debt — $51.9B — Elevated; VMware acquisition legacy; well- managed
ROCE — 18.7% — Strong; FCF yield rapidly deleveraging balance sheet
Copyright ©2026 The Prehn Institute. For educational purposes only. Not financial advice.
Gross Margin Analysis
A non-GAAP gross margin of 79.1% places Broadcom in an elite category of businesses globally. To contextualise: Apple operates at approximately 45% gross margin; NVIDIA at approximately 74%; Intel at approximately 42%. Broadcom's 79.1% reflects a business where the intellectual property embedded in its custom silicon commands premiums that dwarf its production costs.
The margin trajectory is also positive — expanding 270 basis points year-on-year from 76.4% to 79.1%. This is being driven by the mix shift toward higher- margin AI products (custom XPUs) and the integration of VMware's software revenue (which carries very high gross margins typical of enterprise software). As AI revenue becomes a larger share of the total, we expect this margin to continue expanding.
The adjusted EBITDA margin of 68% of revenue is, frankly, near-extraordinary. For every
0.68 of
EBITDA before interest and taxes. This is the economics of a business with durable pricing power and high operating leverage.
Free Cash Flow Trends
24 billion in FCF, which the company is deploying toward debt reduction (priority following the VMware acquisition) and the dividend. The FCF conversion rate of 40% is superior to most technology peers and reflects the asset-light nature of fabless semiconductor design combined with high-margin software revenue.
Management guided Q2 FY2025 revenue of approximately $14.9 billion — consistent with Q1 — suggesting that the elevated run rate is sustainable, not a one-quarter anomaly. The AI revenue growth trajectory of 77% year-on-year provides strong forward visibility for continued FCF expansion.
6.01billioninfreecashflowinasinglequart
Copyright ©2026 The Prehn Institute. For educational purposes only. Not financial advice.
Debt Ratios & Balance Sheet Health
Net debt of
69 billion deal completed in November 2023. However, context is essential: against
40 billion), net debt/EBITDA is approximately 1.3x and declining rapidly. At $24 billion in annual FCF, Broadcom can theoretically retire its entire net debt in approximately two years. The debt is real but the cash flow is also real — and the cash flow wins this comparison. ROCE of 18.7% confirms that the VMware acquisition capital is generating returns above cost.
ROCE
ROCE of 18.7% is strong for a company of Broadcom's scale and reflects the returns generated by its semiconductor and software businesses relative to the total capital employed (including the significant goodwill and intangible assets from acquisitions). As VMware integration synergies materialise and the debt balance is reduced, we would expect ROCE to expand further.
Competitive Moat
Moat Classification: Custom Silicon Relationships + Switching Costs + Technology Leadership. Broadcom's primary competitive advantage in AI is its decade-long relationships with hyperscalers for custom silicon design. Google's TPUs, Meta's MTIA chips, and ByteDance's custom AI processors are all Broadcom-designed. These relationships are not transactional — they involve multi-year development cycles, deep co-engineering, and proprietary IP. Switching away from Broadcom would require a hyperscaler to rebuild years of silicon design work, recruit scarce custom silicon talent, and accept years of development delay. In
51.9billionistheelephantintheroomforBroadcom sbalancesheet, anditmeritsdirectackno ′
10.1billioninquarterlyEBITDA(annualisedatapproximately
Copyright ©2026 The Prehn Institute. For educational purposes only. Not financial advice. the software segment (VMware), the switching cost moat is equally formidable: enterprise virtualisation infrastructure is embedded in the operational DNA of global corporations.
Recent Earnings Highlights
Q1 FY2025: Record revenue of 6.01 billion (40% of revenue). of
14.9 billion. Dividend maintained consistent with capital allocation framework. Management tone on the earnings call was highly positive regarding the AI demand environment, citing hyperscaler investment cycle as multi-year and showing no signs of deceleration.
ETF Alternative
The iShares Semiconductor ETF (SOXX) and the VanEck Semiconductor ETF (SMH) provide diversified semiconductor exposure. AVGO is a significant holding in both. For broader technology infrastructure exposure, the Invesco QQQ (QQQ) or the Technology Select Sector SPDR (XLK) also hold AVGO as a significant position.
Key Risk Factors
Hyperscaler Concentration Risk: A significant share of AI revenue comes from a small number of hyperscaler customers; loss or reduction of any one relationship would be material. In-House Silicon: The risk that hyperscalers develop their AI silicon entirely in-house (as Google has been doing for years) rather than relying on Broadcom is real and ongoing. VMware Integration: Large acquisitions carry execution risk; VMware's revenue growth post-acquisition will be closely watched. Export Controls: US restrictions on advanced semiconductor exports to China could impair revenue from that market.
14.9billion(+25
10.1billion(68
Copyright ©2026 The Prehn Institute. For educational purposes only. Not financial advice.

THE NEW MARKET PARADIGM
FIX
1ofrevenue, Broadcomgenerates
Comfort Systems USA
E N G I N E E R I N G & C O N S T R U C T I O N | N Y S E : F I X | D ATA C E N T R E & Market Capitalisation
~$36 Billion
26.3% Gross Margin (Q1)
- $242M
- FCF (Q1 2026)
Low Leverage Balance Sheet
17.0% Operating Margin
+56% Revenue Growth
$12.5B
Record Backlog
A N A LY S T T H E S I S
Comfort Systems USA is the defining example of an "invisible champion" — a company that barely registers in casual investor conversation yet has delivered performance that most celebrated technology stocks would envy. FIX builds the mechanical, electrical, and plumbing (MEP) systems that make data centres, factories, and advanced industrial facilities function. You cannot run an AI data centre without the cooling, electrical distribution, and mechanical systems that Comfort Systems designs, installs, and maintains. Q1 2026 results were extraordinary: revenue of 242 million, and a record backlog of $12.5 billion. Data centre and advanced technology work now constitutes 56% of total revenue. The company's EPS more than doubled year-on-year.
Exhibit 8: FIX — Key Financial Metrics Summary (Q1 2026)
| Metric | Q1 2025 | Q1 2026 | Change | Quality Assessment |
|---|---|---|---|---|
| Revenue | ~$1.86B | $2.9B | +56% | Exceptional; data centre demand acceleration |
| Gross Profit |
$403M $754M +87% Margin + volume expansion simultaneously
Gross Margin 22.0% 26.3% +430 bps Structural improvement; modular advantage
Operating Margin 11.4% 17.0% +560 bps Strong operating leverage demonstrated
EBITDA $243M $524M +116% More than doubled; TTM EBITDA $1.74B
Free Cash Flow ($109M) $242M Positive Significantly positive in growth quarter
Backlog ~$7.2B $12.5B +74% Record; multi-year revenue visibility
Diluted EPS $4.75 $10.51 +121% More than doubled; track record of execution 2.9billion(+56
Copyright ©2026 The Prehn Institute. For educational purposes only. Not financial advice.
Copyright ©2026 The Prehn Institute. For educational purposes only. Not financial advice.
Gross Margin Analysis
Comfort Systems' gross margin expansion from 22.0% to 26.3% in a single year — a 430 basis point improvement — is exceptional for an engineering and construction business. The construction sector typically operates on gross margins of 15-20%; FIX is now operating at the upper end of industrial services companies globally. The driver is a structural shift in business mix toward higher-complexity, higher-margin data centre and advanced technology projects, which require the specialised expertise that Comfort Systems has systematically built.
The modular construction capability is a key margin driver. Modular work — building prefabricated MEP modules in a controlled factory environment rather than purely on-site — carries higher margins than traditional field construction because of better quality control, reduced rework costs, and the ability to deploy skilled labour more efficiently. Modular revenue constituted 17% of Q1 2026 total revenue, and management is targeting 4 million square feet of modular capacity by year-end 2026.
Free Cash Flow Trends
2026 free cash flow of
109 million in Q1 2025, demonstrating the company's improved working capital management as revenue scales. Construction businesses typically require working capital investment ahead of revenue recognition, so positive FCF in a quarter of 56% revenue growth is a particularly impressive outcome. The trailing 12-month EBITDA of
12.5 billion, provides high confidence in forward cash flow generation.
Debt Ratios & Balance Sheet Health
Management has consistently characterised the balance
242millionstandsinsharpcontrasttothene
1.74billion, combinedwiththerecordbacklog
Copyright ©2026 The Prehn Institute. For educational purposes only. Not financial advice. sheet as having "robust backlog, low leverage, and sustained free cash flow and dividends." While precise net debt figures require reference to the full balance sheet, the company's low-leverage characterisation is consistent with its financial profile — it has grown organically and through disciplined bolt-on acquisitions rather than large debt-financed transformational deals. Capital expenditure for Q1 2026 was $147 million (5.1% of revenue), primarily driven by modular facility investments, and full-year capex is guided at approximately 5% of revenue — a manageable level for a business growing at 56%.
Roce & Return Metrics
With operating margin of 17.0% and a capital-light business model (most work is performed using skilled labour and project-specific materials rather than heavy proprietary capital), Comfort Systems' ROCE is structurally high. The business model — construction services with long-term maintenance contracts — is inherently asset-light relative to the capital employed in a mining or energy company, which means ROCE naturally runs higher. The EPS doubling to $10.51 in a single year is the most direct illustration of the return being generated for shareholders.
Competitive Moat
Moat Classification: Skilled Workforce + Modular Technology + Long-Term Customer
Relationships. Comfort Systems' moat lies in its irreplaceable skilled workforce — licensed mechanical and electrical contractors, engineers, and project managers who take years to develop and certify. The company's modular construction capability represents proprietary manufacturing technology that competitors cannot quickly replicate. Long-term service contracts with data centre operators and industrial clients create recurring revenue streams and switching cost advantages. The record backlog of 5.3 billion higher than the same period last year — represents contracted work that the company's 12.5billion—
Copyright ©2026 The Prehn Institute. For educational purposes only. Not financial advice. workforce is uniquely positioned to execute.
Recent Earnings Highlights
Q1 2026: Revenue 524 million
12.5 billion (record).
Data centre and advanced technology revenue = 56% of total. Service revenue grew 8% YoY. Quarterly dividend increased 0.80/share. New electrical contractor acquisition signed. Management guided same-store revenue growth in the "mid-to-high 20% range" for FY2026.
ETF Alternative
The iShares US Infrastructure ETF (IFRA) and the First Trust US Industrials AlphaDEX Fund (FXR) provide exposure to US industrial and construction companies. For more targeted data centre infrastructure exposure, the Global X Data Center REITs & Digital Infrastructure ETF (VPN) provides related exposure.
Key Risk Factors
Data Centre Demand Concentration: 56% of revenue now comes from advanced technology (predominantly data centres). A slowdown in hyperscaler capex would directly impact FIX's growth trajectory. Labour Constraints: Skilled MEP tradespeople are in short supply nationally; inability to hire could limit growth despite strong backlog. Project Execution Risk: Large, complex construction projects carry cost overrun and delay risk. Modular Capacity Investment: The heavy capex in modular facilities represents execution risk if utilisation does not materialise as expected.
2.9billion(+56
10.51(+121
0.10to
Copyright ©2026 The Prehn Institute. For educational purposes only. Not financial advice.

NEW MARKET PARADIGM
STX
1ofrevenue, Broadcomgenerates
Seagate Technology Holdings plc
Market Capitalisation
~$23 Billion
40.1% Gross Margin (Record)
- $427M
- FCF (Q1 FY2026)
1.5x Net Leverage
29% Op. Margin (Non-GAAP) +21% Revenue Growth
$2.63B
Q1 FY2026 Revenue
A N A LY S T T H E S I S
Seagate Technology is the overlooked backbone of the AI data economy. Every AI training run, every model weight, every inference log, and every enterprise backup requires mass data storage — and Seagate's high- capacity nearline hard disk drives are the most cost-effective storage medium for this use case by a wide margin. Cloud service providers cannot train AI models in flash memory; the economics of HDD storage at scale are unmatched. Seagate's fiscal Q1 2026 results confirmed this thesis: record non-GAAP gross margin of 40.1%, revenue growth of 21%, operating margin of 29%, and FCF of $427 million. The company is successfully ramping its next-generation HAMR (Heat-Assisted Magnetic Recording) Mozaic drive platform, which provides a multi-generational roadmap for areal density expansion — meaning more storage per disk, lower cost per terabyte, wider margins.
Exhibit 9: STX — Key Financial Metrics Summary (Fiscal Q1 2026)
Copyright ©2026 The Prehn Institute. For educational purposes only. Not financial advice.
| Metric | Q1 FY2025 | Q1 FY2026 | Change | Quality Assessment |
|---|---|---|---|---|
| Revenue | ~$2.17B | $2.63B | +21% | Exceeded guidance; CSP demand robust |
| Non-GAAP Gross | ||||
| Margin |
~35% 40.1% Record Record; HAMR mix-up and operating leverage
Non-GAAP Op. Margin ~22% 29% Multi-year high
Significant expansion; sustained uptrend
Free Cash Flow — $427M — Strong generation; dividend raise follows
Net Leverage — 1.5x — Moderate; rapidly improving with FCF
Gross Debt / Cash — ~ 1.1B — Well-managed; FCF supports deleveraging
5B/
Copyright ©2026 The Prehn Institute. For educational purposes only. Not financial advice.
Gross Margin Analysis
Seagate's record non-GAAP gross margin of 40.1% represents a step-change improvement and is the most important financial development in the company's recent history. To understand why, it is necessary to understand the economics of hard disk drives: HDD manufacturing has high fixed costs (precision engineering, cleanroom fabrication) but low variable costs once at scale. As volume increases and product mix shifts toward higher-capacity drives (which command higher prices with relatively modest incremental cost), gross margins expand rapidly.
The HAMR-based Mozaic platform is the technology driver. HAMR (Heat-Assisted Magnetic Recording) uses a laser to heat the magnetic media during the write process, enabling data to be recorded at much higher densities than conventional perpendicular magnetic recording. Each Mozaic drive packs more terabytes into the same physical footprint, generating significantly higher revenue per drive with only modest incremental manufacturing cost — a textbook margin expansion dynamic.
Free Cash Flow Trends
1.7 billion in FCF, the company's debt servicing, dividend obligations, and growth investments are well- covered. The recovery from the COVID-era inventory correction cycle (which temporarily depressed FCF) is now complete, and Seagate is entering a phase of structurally higher profitability supported by AI-driven nearline HDD demand.
Debt Ratios & Balance Sheet Health
Net leverage of 1.5x EBITDA is moderate and declining. With approximately
1.1 billion in cash,
Seagate's net debt is approximately $3.9 billion. At current FCF run rates, this represents a well-managed
427millioninfreecashflowinasinglequart
5billioningrossdebtand
Copyright ©2026 The Prehn Institute. For educational purposes only. Not financial advice. debt burden that gives management flexibility without creating financial risk. The company's decision to raise its dividend rather than aggressively pay down debt reflects confidence in the FCF outlook — management is comfortable that leverage will continue declining organically.
ROCE
While a specific ROCE figure was not available in our most recent data, the operating characteristics of the business — high gross margins expanding toward 40%, strong FCF conversion, and moderate capital intensity — are consistent with a ROCE profile significantly above the company's cost of capital. The multi-year high in operating margin of 29% confirms that the business is generating excellent returns on the capital invested in its manufacturing and technology operations.
Competitive Moat
Moat Classification: Technology Leadership + Long-Term CSP Contracts + Duopoly Position. Seagate competes primarily with Western Digital in the nearline HDD market — effectively a duopoly supplying the world's largest cloud service providers. Duopoly economics are favourable by definition: rational pricing behaviour, barriers to new entry (HAMR technology represents years of R&D investment and manufacturing expertise that cannot be quickly replicated), and captive customers who depend on consistent, high-quality supply of drives at scale. Long-term supply agreements with global CSPs provide multi-year revenue visibility and switching cost protection.
Recent Earnings Highlights
Fiscal Q1 2026 (October 2025): Revenue of
427 million. Dividend raised, signalling FCF confidence. HAMR-based Mozaic drive ramp proceeding as expected. CSP demand for high-capacity nearline drives cited as robust and expected to continue. Management characterised the AI-driven storage demand environment as multi-year and structural.
ETF Alternative
The iShares Semiconductor ETF (SOXX) includes storage companies alongside pure semiconductor names. For more targeted exposure, technology- focused ETFs such as the Invesco QQQ or Technology Select Sector SPDR (XLK) both include STX. Investors seeking dedicated electronic components exposure can consider the iShares US Technology ETF (IYW).
Key Risk Factors
NAND Competition: If flash memory (NAND) prices decline sufficiently, CSPs could shift from HDD to SSD for nearline storage, eroding Seagate's market. Current economics heavily favour HDD for mass cold storage, but this equilibrium could shift over a 5-10 year horizon. Inventory Cycles: The HDD industry is prone to inventory build-and-burn cycles that can temporarily impair revenue and margins, as seen in 2022-2023. Customer
Concentration: A meaningful share of revenue comes from a small number of large CSPs; loss of a major contract would be material. HAMR
Execution: The HAMR technology ramp must continue as planned; any yield or reliability issues at scale could delay the roadmap.
Copyright ©2026 The Prehn Institute. For educational purposes only. Not financial advice.

THE NEW MARKET PARADIGM
RKLB
2.63billion(+21
Rocket Lab USA, Inc.
S PA C E L A U N C H & D E F E N C E T E C H N O L O G Y | N A S D A Q : R K L B | Market Capitalisation
~$11 Billion
43% Gross Margin (Non-GAAP)
- $200.3M
- Q1 2026 Revenue
- $186M
- Net Debt
$2.2B+
Backlog
+63.5% Revenue Growth
First $200M+ Quarter
A N A LY S T T H E S I S
Rocket Lab is an early-stage but fundamentally differentiated space economy company that has evolved into a serious defence technology contractor. It occupies a unique position as the only company other than SpaceX with a consistent, commercially successful small satellite launch track record — and unlike SpaceX, it is publicly traded. Its vertically integrated model — designing and manufacturing everything from rocket engines to satellite buses to mission software in-house — gives it cost and capability advantages that pure "launch-only" competitors cannot match. Q1 2026 marked its first-ever quarter above
2.2 billion provides multi-year revenue visibility. We note this is a growth company still investing heavily in its future — FCF is currently negative — and the investment thesis is premised on the rate of revenue growth, margin expansion trajectory, and the transformational potential of Neutron.
Exhibit 10: RKLB — Key Financial Metrics Summary (Q1 2026)
200millioninrevenue(+63.5
Copyright ©2026 The Prehn Institute. For educational purposes only. Not financial advice.
| Metric | Q1 2025 | Q1 2026 | Change | Quality Assessment |
|---|---|---|---|---|
| Revenue | $122.6M | $200.3M | +63.5% | First $200M+ quarter; beat estimates |
| Non-GAAP Gross | ||||
| Margin |
~36% 43% Above guidance Expanding as scale improves economics
Adj. EBITDA ($11.8M) Significant improvement
Better than analyst expectations
Non-GAAP FCF — ($77.4M) — Negative; Neutron investment phase
Net Debt $186.5M — — Low; manageable for company stage
Backlog — $2.2B+ Record Multi-year visibility; quality government/defence mix
Q2 2026 Guidance —
240M
+~20% QoQ Sustained acceleration guided
225M –
Copyright ©2026 The Prehn Institute. For educational purposes only. Not financial advice.
Gross Margin Analysis
Rocket Lab's non-GAAP gross margin of 43% for Q1 2026 — exceeding the company's own guidance — demonstrates an encouraging expansion trajectory. At its current scale, gross margins in this range for a space launch and satellite systems company are impressive and reflect the value-add nature of its vertically integrated model.
The structural margin driver is the mix shift toward Space Systems revenue (satellite manufacturing and components) versus Launch revenue. Space Systems carries inherently higher margins than launch (where rocket propellant, vehicle amortisation, and range fees consume a larger share of revenue). As the Space Systems business grows — driven by government satellite constellation contracts and commercial customers — gross margin expansion is a natural outcome. The pathway to EBITDA breakeven and eventually positive FCF is built on this margin expansion combined with revenue scale.
Non-GAAP FCF of negative $77.4 million in Q1 2026 reflects the company's deliberate, heavy investment in Neutron rocket development. Rocket Lab is building an entirely new medium-lift launch vehicle from scratch — a programme that requires hundreds of millions of dollars in capital before generating revenue. This is a choice, not a sign of business model weakness: the company's Electron rocket programme was also deeply FCF-negative during development and is now a commercially operational launch vehicle.
Investors in RKLB are, in part, purchasing the option on Neutron. The first launch is targeted for late 2026, and the company recently signed its largest launch contract in history for the new vehicle. If Neutron launches successfully, it will transform Rocket Lab from a small satellite launch company into a full- spectrum launch competitor capable of winning
Copyright ©2026 The Prehn Institute. For educational purposes only. Not financial advice. government and commercial contracts that are currently inaccessible to Electron. The risk is real (new rocket programmes are inherently uncertain); so is the potential.
Debt Ratios & Balance Sheet Health
Net debt of approximately $186.5 million is relatively modest for a company of Rocket Lab's scale and ambition. The balance sheet provides sufficient runway to fund Neutron development and ongoing operations without near-term capital raise risk, particularly given the strong revenue growth trajectory and the backlog providing forward revenue visibility. The company has been thoughtful about capital structure, having raised equity at appropriate market conditions rather than loading up on debt.
Roce & Investment Returns
Conventional ROCE metrics are not the appropriate framework for evaluating a growth-phase space company. The more relevant metrics are: revenue growth rate (63.5% YoY), gross margin trajectory (expanding toward 43%), backlog quality ($2.2B+ with government defence mix), and the potential economic value of the Neutron platform if successfully commercialised. These are the dimensions on which the long-term investment case should be assessed. The current EBITDA loss is a function of investment, not of a broken business model — the Electron programme is profitable; the loss reflects the Neutron build.
Competitive Moat
Moat Classification: Vertical Integration + Proven Track Record + Backordered Demand. Rocket Lab's moat is built on demonstrated operational credibility in a sector where most competitors are PowerPoint presentations. The company has successfully completed over 50 Electron launches — a track record that takes years and many failures to build. Its vertically integrated model (Rocket Lab manufactures its own rocket
Copyright ©2026 The Prehn Institute. For educational purposes only. Not financial advice. engines, satellite buses, avionics, solar cells, and mission software) creates cost advantages and supply chain independence that "rocket-as-a- service" companies relying on third-party components cannot match. The $2.2 billion backlog includes significant US government and defence contracts, providing a stable base from which commercial revenue can be grown.
Recent Earnings Highlights
Q1
2026 (May 2026): Record revenue of
200 million in company history. Non-GAAP gross margin of 43% (above guidance). Adjusted EBITDA loss of
225–
2.2 billion.
ETF Alternative
The ARK Space Exploration & Innovation ETF (ARKX) provides exposure to the space economy, including Rocket Lab. For broader defence sector exposure, the iShares US Aerospace & Defense ETF (ITA) and the SPDR S&P Aerospace & Defense ETF (XAR) are relevant, though RKLB's weight in these is modest given its market cap relative to large-cap defence primes.
Key Risk Factors
Neutron Development Risk: Rocket development is inherently uncertain; cost overruns, delays, or launch failures could materially impair the investment thesis and require additional capital.
SpaceX Competition: SpaceX dominates the launch market and could choose to compete aggressively in the small/medium satellite segment.
Government Contract Dependency: A significant portion of the backlog is government-related; sequestration or policy changes could affect award timing. FCF Duration: The timeline to positive FCF depends on Neutron success and continued Electron ramp; extended FCF negativity could require equity dilution.
200.3million(+63.5
11.8million(significantlybetterthananalystexpectations).Q22026revenueguidedat
240million.LargestlaunchcontractincompanyhistorysignedforNeutron.Neutrondevelop
Copyright ©2026 The Prehn Institute. For educational purposes only. Not financial advice.

THE NEW MARKET PARADIGM
PWR
2.63billion(+21
Quanta Services, Inc.
I N F R A S T R U C T U R E C O N S T R U C T I O N | N Y S E : P W R | E L E C T R I C Market Capitalisation
~$46 Billion
14.1% Gross Margin
- $172M
- FCF (Q1 2026)
1.9x Net Debt/EBITDA
8.7% ROIC (LTM)
+26.3% Revenue Growth
$48.5B
Record Backlog
A N A LY S T T H E S I S
Quanta Services is America's most important infrastructure contractor, and it is growing at a rate that belies its 46billionmarketcap.Thecompanybuildsandmaintainstheelectricalgrid, pipelines, telecommun
Copyright ©2026 The Prehn Institute. For educational purposes only. Not financial advice.
7.87 billion. The backlog reached a record $48.5 billion — implying approximately 1.5 years of forward revenue visibility at the current run rate. Management raised full-year 2026 guidance for both revenue and EPS in response. With net debt/EBITDA of 1.9x and ROIC of 8.67%, the company is financially sound and generating above-cost returns on invested capital.
Exhibit 11: PWR — Key Financial Metrics Summary (Q1 2026)
| Metric | Q1 2025 | Q1 2026 | Change | Quality Assessment |
|---|---|---|---|---|
| Revenue | $6.23B | $7.87B | +26.3% | Beat estimates; well ahead of guidance |
| Gross Margin | 14.1% | 14.1% Stable Consistent; volume the primary driver | ||
| Adj. EBITDA | ~$544M | $686M |
+26% 8.7% EBITDA margin; typical for sector
Free Cash Flow — $171.7M — Positive in strong growth quarter
Net Debt — ~$5.95B — 1.9x EBITDA; manageable for a service business
ROIC (LTM) — 8.67% — Above cost of capital; value-creating
Backlog ~$37B $48.5B +31% Record; FY2026 revenue guidance raised voltageelectricalinfrastructure.QuantaServicesbuildsallofit.Q12026resultsexceededanalyste
Copyright ©2026 The Prehn Institute. For educational purposes only. Not financial advice.
Gross Margin Analysis
Quanta's gross margin of 14.1% is stable and characteristic of the infrastructure services sector. This is not a business model with 70% software margins — it is a company that physically installs infrastructure, and the economics reflect the labour, equipment, and materials intensity of that work. The appropriate comparison is not to technology companies but to specialty contractors, where 14% gross margins represent a good business with significant operating leverage potential as volume scales.
The important margin story at Quanta is operating leverage: as revenue grows (26.3% in Q1 2026), fixed overhead is spread over a larger base, and the adjusted EBITDA margin (8.7%) benefits even when gross margin is stable. The company's strategic focus on higher-value, higher-complexity work (grid modernisation, offshore wind electrical infrastructure, data centre connections) is designed to gradually improve the gross margin profile over time, though the near-term story is primarily about volume.
Free Cash Flow Trends
of
48.5 billion is the most important forward indicator: it represents contracted work that will convert to revenue and ultimately FCF over the next 18-24 months.
Debt Ratios & Balance Sheet Health
Net debt of approximately
3.1 billion (annualised from Q1 at ~$686 million) implies net debt/EBITDA of approximately 1.9x. This is a moderate leverage ratio for a company with Quanta's backlog visibility and cash generation profile. Infrastructure services companies typically operate at higher leverage than manufacturers because their
171.7millioninQ12026isahealthyresultfo growthphase.Constructionbusinessestypi
5.95billionagainsttrailingEBITDAofapp
Copyright ©2026 The Prehn Institute. For educational purposes only. Not financial advice. business is underpinned by contracted backlog — a form of revenue assurance that justifies moderate debt. Management has been deliberate about using debt for strategic acquisitions (particularly in renewable energy infrastructure) that expand the addressable market.
ROIC & Return Metrics
ROIC of 8.67% for the last twelve months confirms that Quanta is generating returns above its estimated cost of capital of approximately 7-8%. For a services business deploying capital into working capital, equipment, and acquisition goodwill, an ROIC meaningfully above the cost of capital is the relevant quality signal. The guidance raise following Q1 2026 results — management increased both revenue and EPS guidance for the full year — suggests that ROIC should improve further as the higher-margin work in the backlog converts to revenue.
Competitive Moat
Moat Classification: Unmatched Scale + Workforce Depth + Regulatory & Safety
Expertise. Quanta is the largest contractor in the specialised utility and infrastructure services sector in North America, and scale in this business creates self-reinforcing advantages. Large utilities and government agencies prefer Quanta because it can simultaneously deploy thousands of field workers across multiple states, has the equipment fleet to handle projects of any size, and has the safety record and regulatory relationships to obtain permits and rights-of-way efficiently. The specialised skills required — licensed journeymen electricians, high-voltage transmission specialists, directional drilling operators — take years to train and certify, creating a workforce moat that cannot be rapidly replicated. Competitors cannot match Quanta's capacity on large, time-critical projects, which is why it consistently captures the most important contracts in the sector.
Q1 2026: Revenue of 48.5 billion —
686.4 million (8.7% margin). FCF of $171.7 million. Full- year 2026 guidance raised for both revenue and adjusted EPS. Management cited electric power infrastructure, grid hardening, renewable energy connections, and large industrial projects (including data centres) as the primary demand drivers. The book- to-bill ratio exceeded 1.0, confirming that new work awards are outpacing revenue recognition.
ETF Alternative
The iShares US Infrastructure ETF (IFRA) and the Global Infrastructure ETF (IGF) provide direct infrastructure sector exposure. Quanta is among the largest holdings in IFRA. For broader utility infrastructure exposure, the Utilities Select Sector SPDR (XLU) provides complementary coverage.
Key Risk Factors
Labour Availability: The specialised workforce required for Quanta's work is in short supply nationally. Inability to staff projects at the rate the backlog demands could limit revenue conversion.
Policy Risk: The renewable energy and grid modernisation work in the backlog depends on sustained government policy support (IRA, CHIPS Act). Changes in administration could affect new awards. Acquisition Integration: Quanta's growth- through-acquisition strategy requires successful integration of acquired businesses; poor integration would impair returns. Project Cycle Risk: Large infrastructure projects carry completion timeline and cost risk; overruns impair margins.
5billionhigherY oY onasame − storebasis.AdjustedEBITDAof
Copyright ©2026 The Prehn Institute. For educational purposes only. Not financial advice.
THE NEW MARKET PARADIGM
Cross-Portfolio Metrics Comparison
H O W TO R E A D T H I S TA B L E
The table below summarises the key fundamental metrics for all nine stocks in a single view. No stock is universally "best" across every metric — the appropriate weighting depends on each investor's framework and time horizon. Commodity producers will naturally have lower gross margins but high leverage to commodity prices. Growth-phase companies (RKLB) will have negative FCF but the highest revenue growth. The Felix Prehn Quality/Growth framework emphasises the combination of gross margin trend, FCF generation, debt discipline, and moat durability — not any single metric in isolation.
Exhibit 12: Nine-Stock Cross-Portfolio Fundamental Comparison
| Ticker | Rev. Growth (YoY) | Gross Margin | FCF (Quarter) | Net Debt | ROCE / ROIC | Backlog / Moat |
|---|---|---|---|---|---|---|
| NEM | +21% (FY) | 67.4% | $7.3B (FY) | Net Cash $3.5B | 25.9% ROCE | Reserves depth / Scale |
| CCJ | +25% (Q1) | ~28% | Div. supported | 0.36 Cash/Debt 23.5% | ||
| ROE (3yr) | ||||||
| Tier-1 U assets / Govt | ||||||
| designation | ||||||
| FCX | +8.8% (Q1) | 38.6% | $1.75B (LTM) | $6.7B net debt 13.3% | ||
| ROCE | ||||||
| Grasberg scale / 0.7x | ||||||
| D/EBITDA | ||||||
| TTE | +4% prod. / |
+19% EBITDA
~38% $7.0B CFFO
(Q1)
14.3% gearing 13.2%
ROCE
LNG integration / Div. + Buyback
AVGO +25% (+77% AI) 79.1% $6.0B (40% margin)
$51.9B (1.3x
EBITDA)
18.7% ROCE
Custom silicon / VMware switching costs
FIX +56% (Q1) 26.3% $242M (Q1) Low leverage Op. Margin
17%
$12.5B backlog / MEP workforce
STX +21% (Q1) 40.1%
(record)
$427M (Q1) 1.5x leverage 29% Op.
Margin
HDD duopoly / CSP contracts
RKLB +63.5% (Q1) 43% (non-
GAAP)
($77M) investing
$186M net debt
Growth phase
$2.2B backlog / Neutron option
PWR +26.3% (Q1) 14.1% $172M (Q1) 1.9x EBITDA 8.67%
ROIC
$48.5B backlog (record) / Scale moat
Copyright ©2026 The Prehn Institute. For educational purposes only. Not financial advice.
Exhibit 13: Backlog & Revenue Visibility — Infrastructure Names
| Company | Backlog ($B) | Q1 Revenue ($B) | Implied Coverage (Qtrs) | YoY Backlog Change |
|---|---|---|---|---|
| PWR — Quanta Services | $48.5B | $7.87B | ~6.2 qtrs | +31% |
| FIX — Comfort Systems | $12.5B | $2.9B ~4.3 qtrs +74% | ||
| RKLB — Rocket Lab | $2.2B+ | $0.20B ~11 qtrs |
Record
Exhibit 14: Gross Margin Ranking — Nine-Stock Universe
| Rank | Ticker | Company | Gross Margin | Trend | Primary Driver |
|---|---|---|---|---|---|
| 1 | AVGO | Broadcom | 79.1% | Expanding | Custom AI silicon + VMware software |
| NEM | Newmont | 67.4% +1,540 bps Gold price leverage | |||
| RKLB | Rocket Lab |
43% (non-
GAAP)
Expanding Space Systems mix shift
STX Seagate 40.1% (record) Record; +500 bps HAMR Mozaic drives; CSP mix
FCX Freeport-
McMoRan 38.6% Stable/improving Copper price + gold credits
TTE TotalEnergies ~38% Stable LNG upstream + integrated power
CCJ Cameco ~28% Improving Contract repricing at higher uranium price
FIX Comfort Systems 26.3% +430 bps; expanding
High-margin data centre MEP work
PWR Quanta Services 14.1% Stable Infrastructure services (volume play)
THE GREAT ROTATION: QUALITY STOCKS FOR THE NEW MARKET PARADIGM APPENDIX II — RISK FACTORS & KEY CONSIDERATIONS
Risk Factors & Key Considerations
Copyright ©2026 The Prehn Institute. For educational purposes only. Not financial advice.
I M P O R TA N T N O T E O N R I S K
Every investment involves risk. The stocks in this report have been selected because our analysis suggests their fundamental characteristics are superior — but that does not make them risk-free. The risks below apply at the portfolio level, in addition to the company-specific risks discussed in each individual stock section. Readers are strongly encouraged to consider these risks before making any investment decision and to consult a qualified financial advisor.
Copyright ©2026 The Prehn Institute. For educational purposes only. Not financial advice.
Macro & Systemic Risks
RECESSION RISK: A global economic recession would impair earnings across most of the stocks in this report. Commodity prices typically fall in recessions, reducing margins for NEM, CCJ, FCX, and TTE. Infrastructure spending can be deferred, impacting PWR and FIX backlogs. Technology capex by hyperscalers could be reduced, impacting AVGO and STX.
INTEREST RATE RISK: Higher interest rates increase the cost of capital for all companies, potentially compressing valuation multiples even when earnings remain strong. Companies with elevated debt levels (AVGO, FCX, PWR) are more sensitive to rate changes.
CHINA ECONOMIC SLOWDOWN: China is the world's largest consumer of copper, a significant consumer of energy, and the largest growth market for semiconductors and storage. A material Chinese economic slowdown would negatively affect FCX, TTE, AVGO, and STX.
INFLATION REVERSAL: The Great Rotation thesis is partially built on a sustained inflationary environment. A rapid return to low inflation would remove the commodity tailwind for NEM, CCJ, FCX, and TTE, though it would benefit consumers and consumer-facing sectors that are currently on the losing side of the rotation.
GEOPOLITICAL RISK: Escalation of geopolitical tensions can disrupt supply chains, restrict commodity exports, and create operational risk for companies with international assets. This is a double-edged risk: it supports defence spending (RKLB) and gold prices (NEM) while creating operational risk for commodity producers in emerging markets.
Sector-level Risks
COMMODITY PRICE CYCLES: Gold, uranium, copper, and energy prices are inherently cyclical. The current upswing has structural drivers, but all commodities eventually cycle. A reversal from current elevated levels would materially impair the financial performance of NEM, CCJ, FCX, and TTE simultaneously — reducing the diversification benefit of owning all four.
AI CAPEX CYCLE: The AI infrastructure buildout is real, but it is also a capital expenditure cycle — and capital expenditure cycles eventually moderate. A slowdown in hyperscaler AI investment would simultaneously impact AVGO, FIX (data centre construction), STX (AI storage), and PWR (data centre grid connections). The portfolio has meaningful concentration in this theme.
POLICY RISK: US domestic infrastructure spending
(IRA, CHIPS Act, grid modernisation) is a significant driver for FIX and PWR. Political changes that reduce or redirect this spending could impair their growth trajectories.
DEFENCE BUDGET RISK: While global defence budgets are growing, any significant reduction in US defence spending (sequestration) could affect RKLB's government contract awards.
Valuation & Market Risks
VALUATION MULTIPLES: Several stocks in this report trade at elevated multiples reflecting their growth trajectories. If growth disappoints or the market re-rates growth stocks to lower multiples, prices could fall even if earnings are maintained.
SECTOR ROTATION REVERSAL: The Great
Rotation could itself rotate. If macro conditions normalise (inflation returns to 2%, rates decline, consumer spending recovers), capital could flow back to consumer-facing and rate-sensitive sectors, potentially at the expense of the stocks in this report.
Copyright ©2026 The Prehn Institute. For educational purposes only. Not financial advice.
This portfolio has deliberate thematic concentration in commodities, AI infrastructure, and defence. Diversified investors should consider how these positions interact with their existing portfolio exposures.
Company-specific Risk Summary
In addition to the portfolio-level risks above, each company faces specific risks discussed in detail in its individual section. Key highlights:
NEM: Gold price reversal, mining jurisdiction risk
CCJ: Uranium price volatility, Westinghouse integration
FCX: China copper demand, Indonesian jurisdiction
TTE: Oil price, energy transition, geopolitics
AVGO: Hyperscaler concentration, in-house silicon risk
FIX: Data centre demand concentration, labour supply
STX: NAND competition, inventory cycles
RKLB: Neutron development, SpaceX competition,
FCF duration
PWR: Labour availability, policy risk, acquisition integration
Copyright ©2026 The Prehn Institute. For educational purposes only. Not financial advice.

MARKET PARADIGM
Why Buy & Hold Is Dead in 2026 — What
Wall Street Does Instead
Free resource. No credit card required. Educational content only.
About Felix Prehn & The Prehn Institute
Felix Prehn is a former investment banker. He gained deep insights into the strategies and principles that professional investors use to build and protect wealth.
The Prehn Institute
Felix Prehn is the founder of The Prehn Institute, an educational platform that has taught over 20,000 students the fundamentals of investing and stock market analysis. The Prehn Institute focuses on demystifying Wall Street's investment strategies and making them accessible to regular investors. The academy provides comprehensive training on fundamental analysis, technical analysis, risk management, and portfolio construction — empowering individual investors to make informed decisions about their financial futures.
Tradevision.io
Felix Prehn is also the co-founder of Tradevision.io, a platform dedicated to providing news and data specifically tailored for retail investors. Tradevision.io helps individual investors access the information and tools they need to compete effectively in modern financial markets.
Mission and Dedication
Copyright ©2026 The Prehn Institute. For educational purposes only. Not financial advice.
Felix Prehn has dedicated his retirement to teaching regular investors how to protect their wealth and navigate the complexities of the stock market. His approach emphasises understanding the fundamental principles that drive long- term investment success, rather than chasing short-term trends or speculation. By bridging the knowledge gap between Wall Street professionals and individual investors, Felix works to level the playing field and help people take control of their financial destinies.
Connect with Felix Prehn on YouTube youtube.com/felixfriends
Copyright ©2026 The Prehn Institute. For educational purposes only. Not financial advice.
MARKET PARADIGM
Disclaimer
Copyright ©2026 The Prehn Institute. For educational purposes only. Not financial advice.
where feasible. Despite best efforts, data accuracy cannot be guaranteed. Past performance is not indicative of future results. All investments involve risk, including the loss of principal. Readers should conduct their own due diligence and consult a qualified financial advisor before making any investment decisions.