
The Last Time THIS Happened the Global Stock Market RESET
CoreWeave, the dotcom parallel, Goldman's trading desk, and what it means for your portfolio
Felix Nikolas Prehn · 17 October 2026 · 21 pages
Bottom line
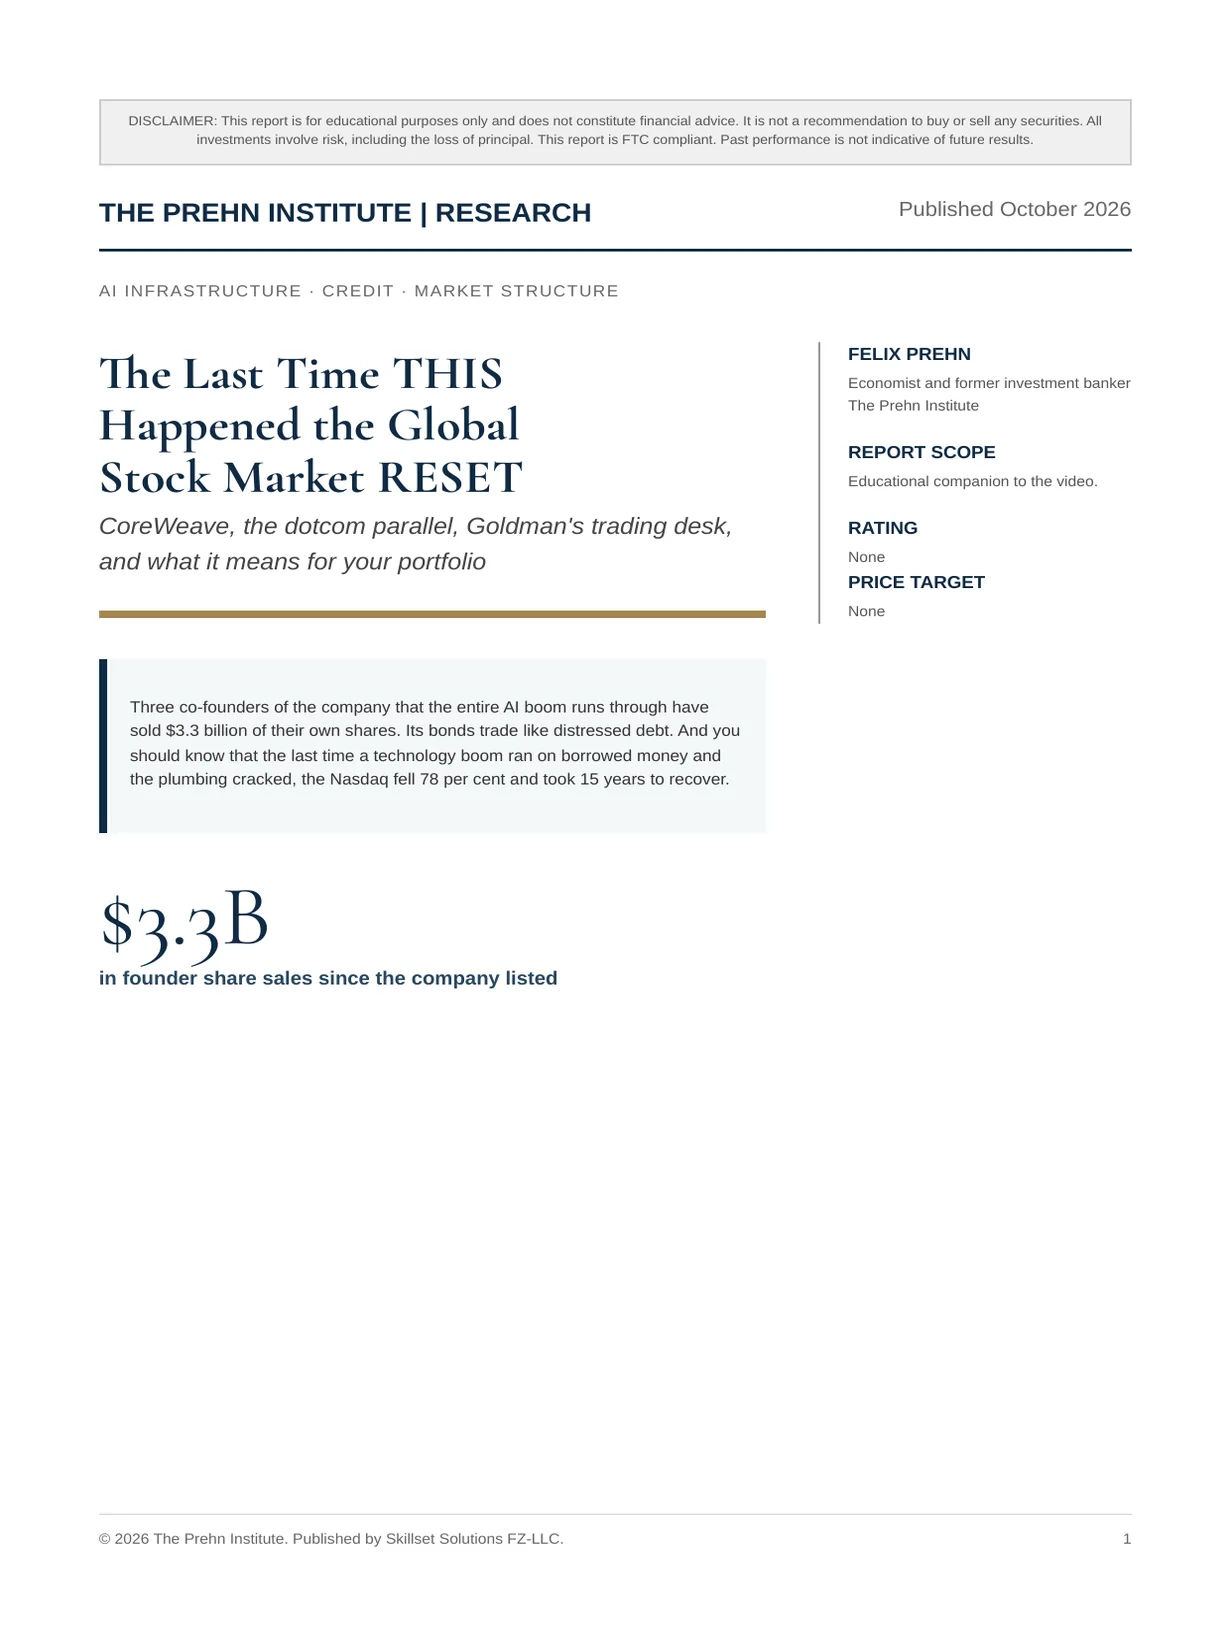
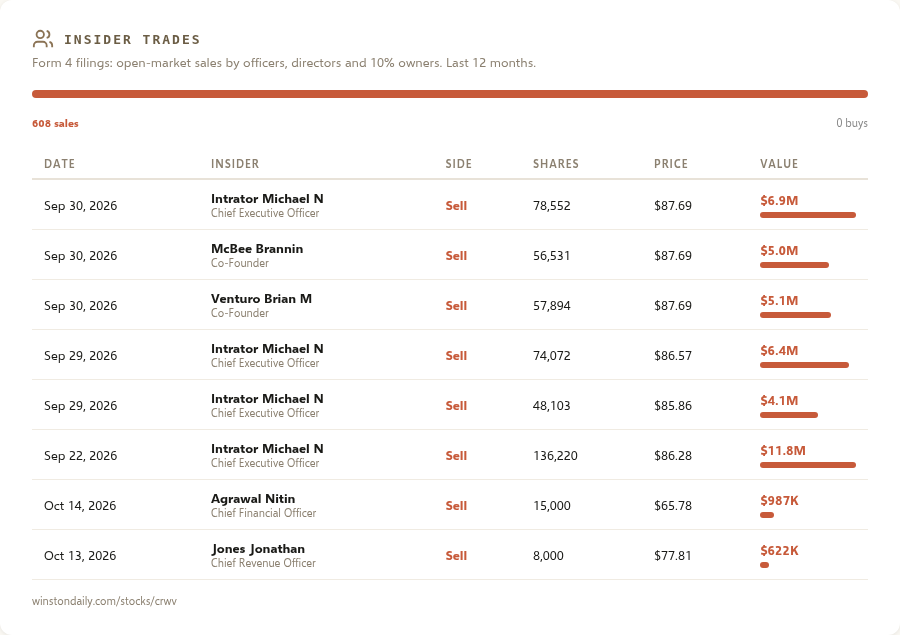
Three co-founders of the company that the entire AI boom runs through have sold $3.3 billion of their own shares. Its bonds trade like distressed debt. And you should know that the last time a technology boom ran on borrowed money and the plumbing cracked, the Nasdaq fell 78 per cent and took 15 years to recover.
$3.3Bin founder share sales since the company listed
Bottom Line
The shape is the same
Bottom line. A technology that really is changing the world, sitting on top of a small group of plumbing companies that everyone feels they have to own. In 2000 the plumbing was routers and fibre-optic cable. Now it is AI chips and data centres. And the companies that borrowed to build it are where you see the stress first.
- A real technology boom
- Built on borrowed money
- Lenders get nervous
- Forced selling spreads
The parallel
2000 and today share a structure. A genuine technological shift attracts enormous capital. So the plumbing companies borrow heavily to build capacity. But when confidence cracks, the most indebted names fall first and fastest.
The difference
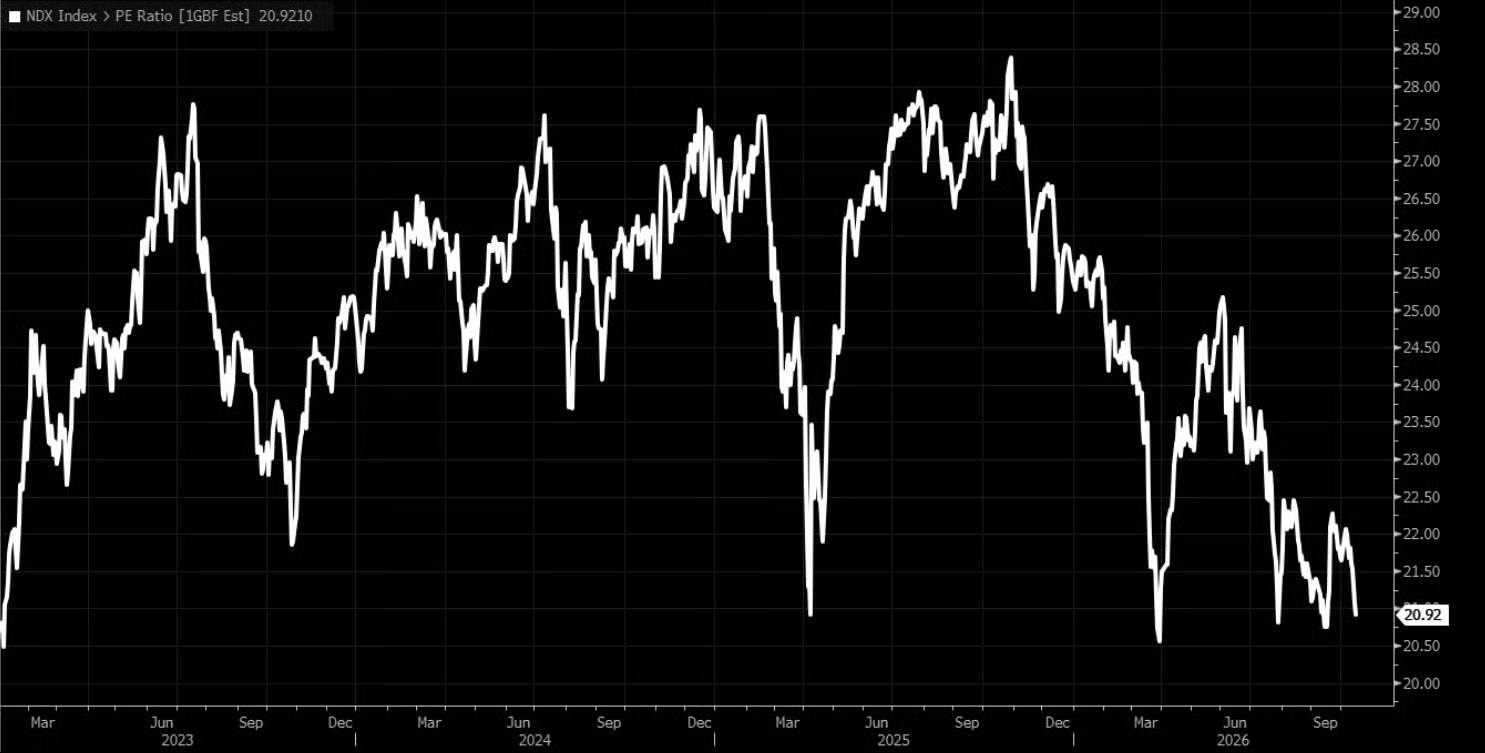
Valuations are lower today. The Nasdaq 100 trades at about 21 times forward earnings (Bloomberg), a long way from the 200 times that Cisco commanded at the peak in 2000. And the demand for AI computing power is real and strong.
The risk
The borrowed layer is enormous. CoreWeave alone carries about $50 billion of debt. Deutsche Bank calculates a $35 billion annual gap between its operating cash and its planned spending. So that gap gets filled with more borrowing.
The lesson
Separate the owners from the borrowers. In the last reset, the companies that could fund themselves had time to wait. But the ones that needed the next loan often did not get it. You want to know which kind you own.
The Company the AI Boom Runs Through
Borrow, buy chips, rent them out
The business
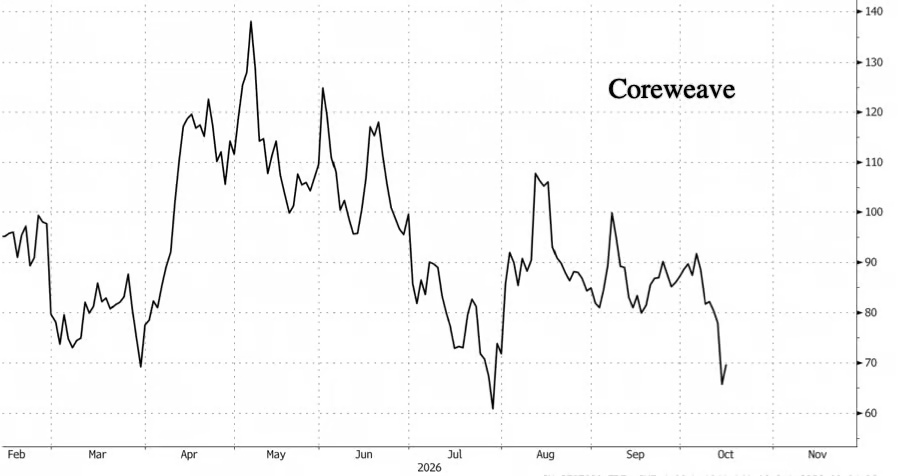
CoreWeave buys Nvidia chips, puts them in data centres and rents them out by the hour. You will hear it called a neocloud: a cloud company built only for AI. And it only listed its shares in March 2025.
The debt
CNBC puts the debt at about $50 billion. That is staggering for a company that only listed last year.
Deutsche Bank calculates about $10 billion a year in operating cash flow against $45 billion in planned capital spending. So the gap of roughly $35 billion gets filled with more borrowing.
The backlog
$104 billion of signed work. About two thirds is with customers that have strong credit ratings. Now, the chief executive called the sell-off irrational.
And he may be right. Deutsche Bank still rates the shares a buy.
Why One Company Matters to the Whole Market
CoreWeave does not sit in a box on its own
- CoreWeave rents data centres from other companies
- Those companies raised money by selling bonds
- CoreWeave's rent pays those bonds
- If CoreWeave struggles, their lenders have a problem too
The chain
The money that lent to CoreWeave comes from the same funds, banks and pension schemes that own the rest of the market. So when one big borrower wobbles, lenders start asking harder questions of everyone else who borrowed to build AI.
Tech credit stress
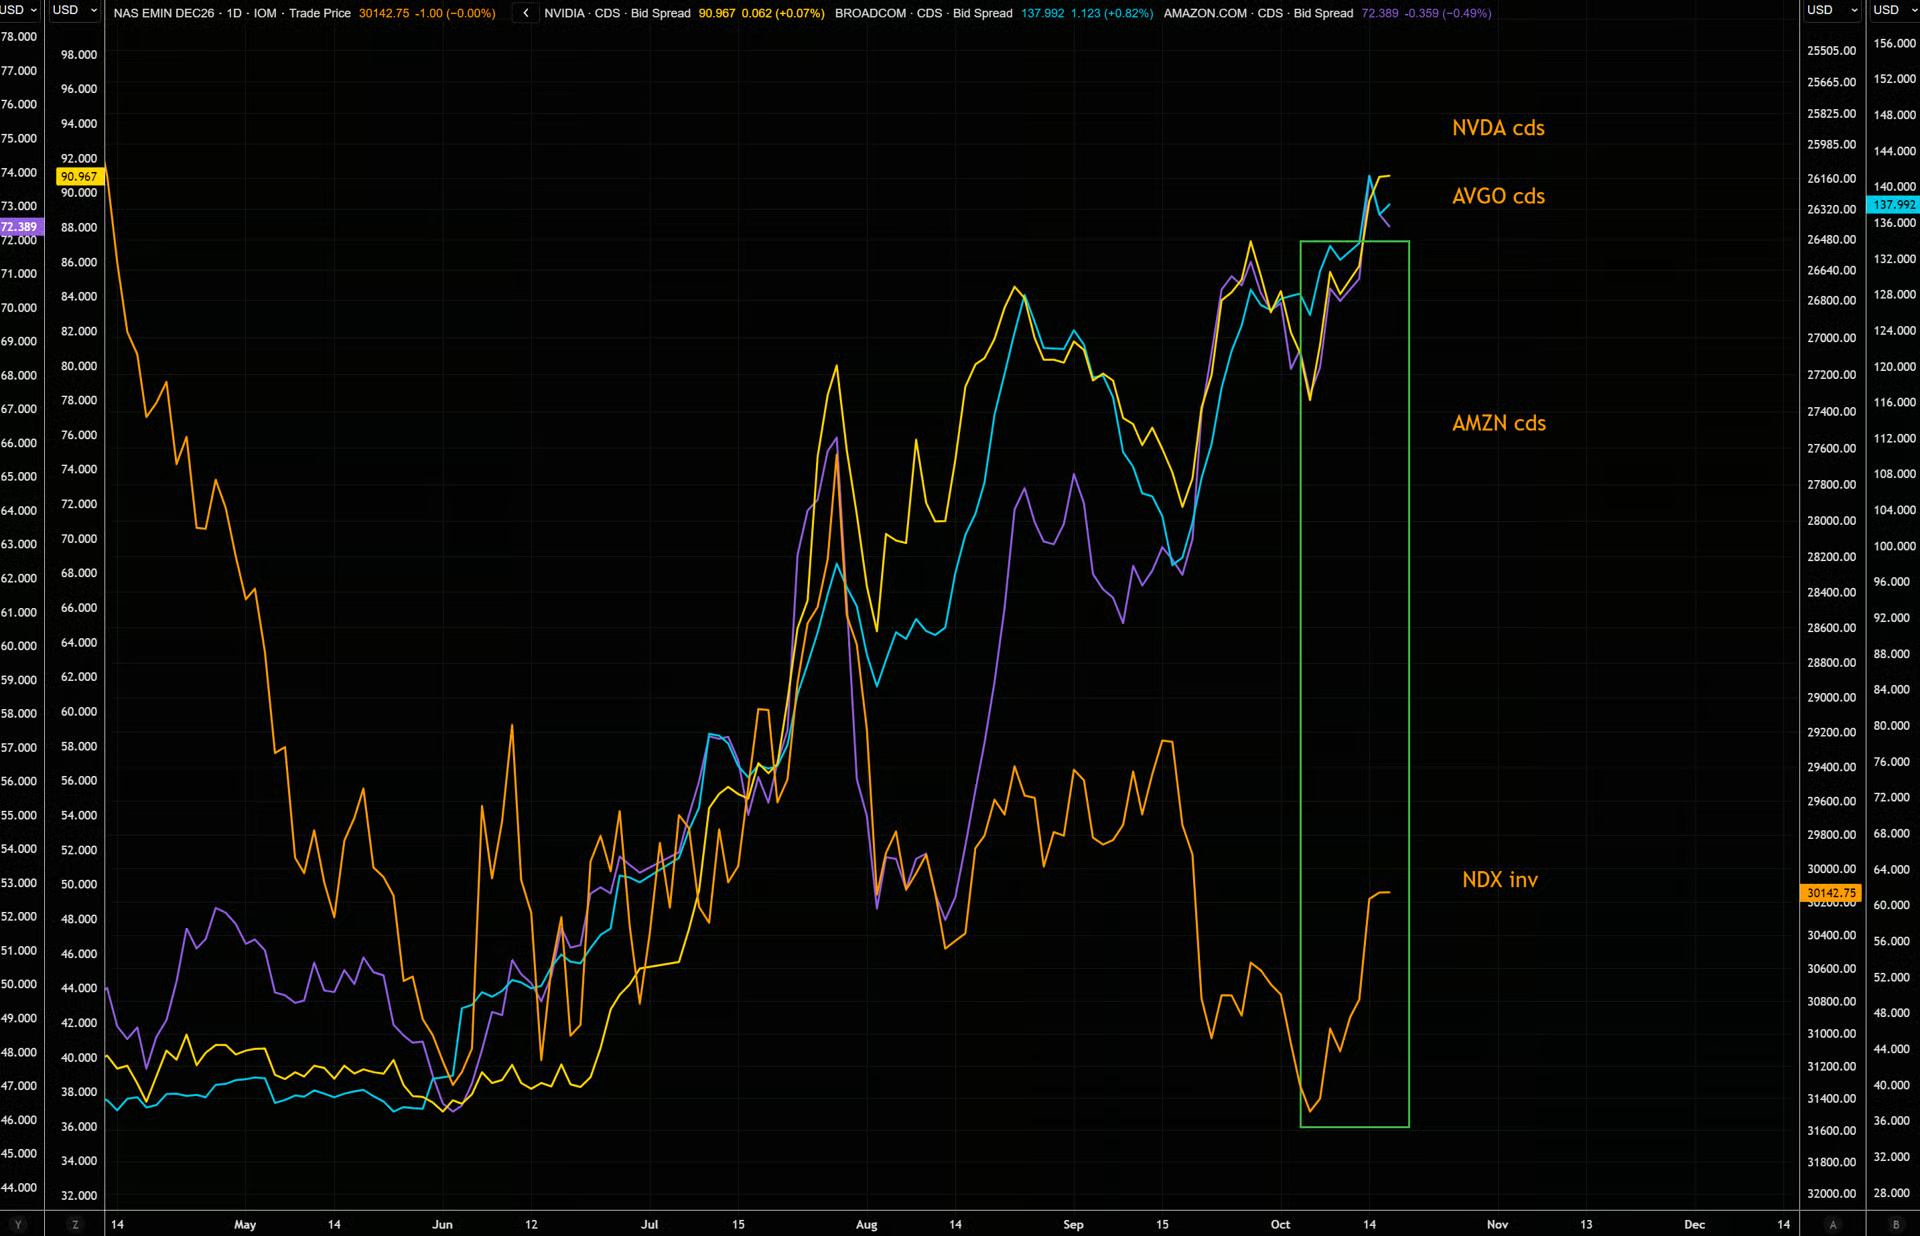
A measure of what it costs to insure the debt of technology companies has been rising. The last time that measure spiked, the Nasdaq shrugged and kept climbing. But this time you can see the Nasdaq falling alongside it.
The signal
When the lenders and the shareholders get nervous at the same moment, pay attention. And that is how a problem in one corner becomes a problem for the whole index you own.
Winston App: CoreWeave Insider Data
The filings, in one place
One sale tells you very little
People sell for tax bills, school fees, a new house. But if you see a cluster of insiders selling while the company's debt cracks, that is a very different picture.
The insider hub
The Winston app also has an insider hub that shows insider buying and selling across the market in one place. And you can switch on alerts for the moment an executive who had been buying turns into a seller.
The Debt Is Cracking
When a $1,000 bond sells for $760
Bond basics
A bond is an IOU. You lend a company $1,000. It pays you interest every year. Then it gives your $1,000 back on a set date.
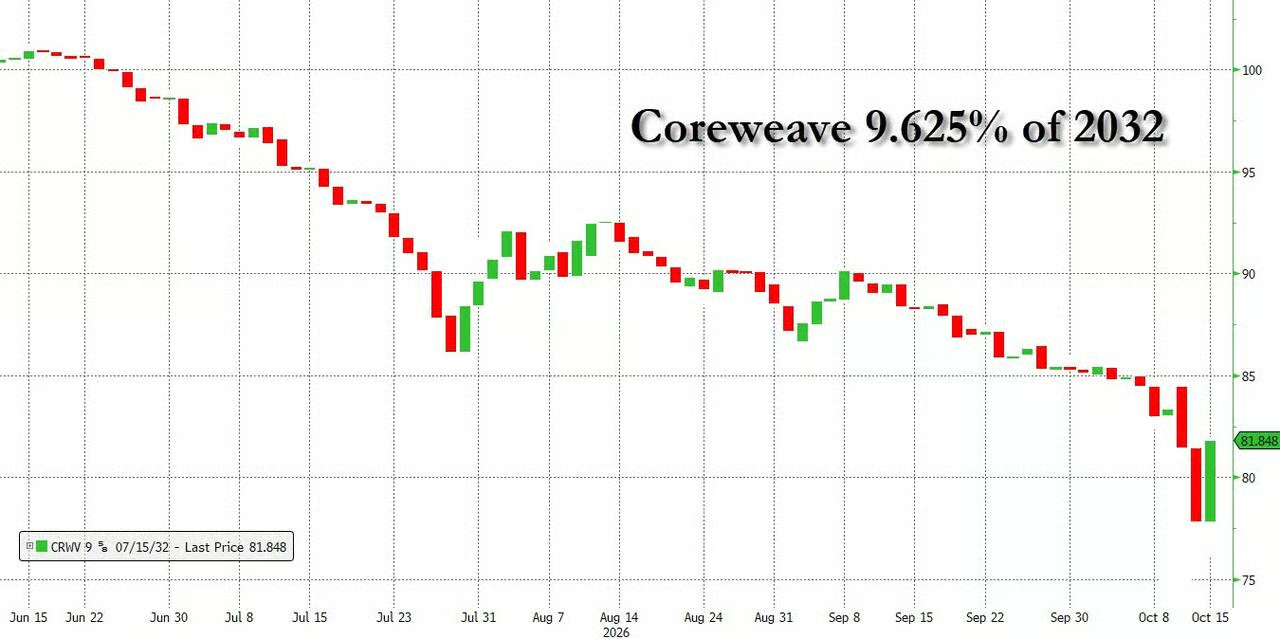
CoreWeave has bonds that pay 9.625 per cent a year and fall due in 2032.
The price
Those bonds have dropped to about 76 cents on the dollar. So a $1,000 bond now sells for about $760. Add the interest and the repayment together and it works out at roughly 15 per cent a year.
That is the return you would demand if you were not sure you would get your money back.
What it means
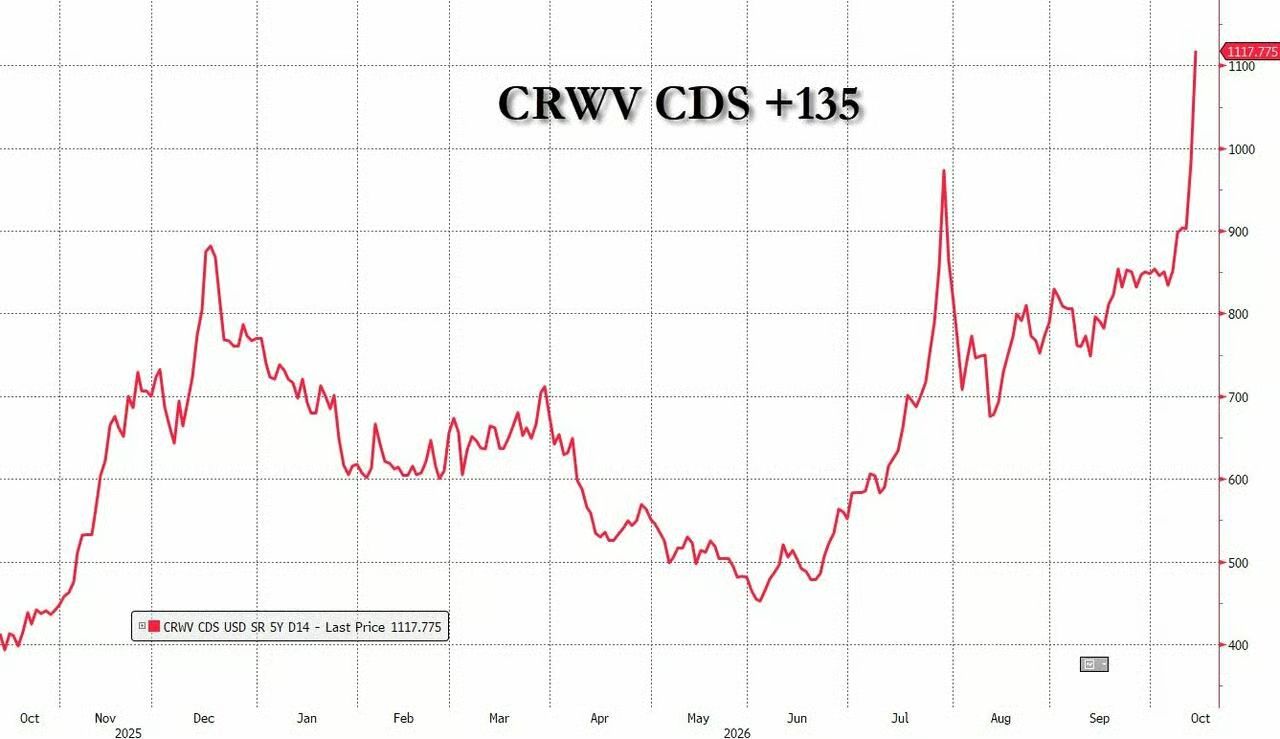
The debt market usually tells you first. And if the cost of insuring a company's debt keeps climbing, lenders are getting more nervous, whatever the share price does.
Insurance on CoreWeave's Debt
Record insurance cost, 60 per cent implied odds of default
- 11%+
- annual cost to insure CoreWeave's debt
- ~60%
- implied odds of default (Bloomberg)
- 15%
- yield on the 2032 bonds
The Last Time This Happened
2000: everyone bought the plumbing
Bottom line. In 2000 the internet was going to change everything. And it did. The company everyone wanted to own was Cisco, which made the routers and switches that carried internet traffic. If you believed in the internet, you bought the plumbing. Sound familiar?
The peak
Cisco became the most valuable company in the world in March 2000, worth about $555 billion. Its shares traded at about 200 times earnings. So for every $1 of profit Cisco made in a year, buyers were paying about $200.
The turn
On the 10th of March 2000 the Nasdaq closed at 5,048. That was the top. A boom like this runs on other people's money. Shareholders buy new shares. Banks and bond buyers lend.
And the companies spend it building things. So as long as the money keeps coming, everything looks fine to you.
The mechanism
What happens when the lenders get nervous? The cost of borrowing goes up. Some companies cannot borrow at all. So they cut spending.
And the companies selling to them suddenly have fewer orders. Now, you will not get one big announcement. You get a lot of quiet decisions to stop lending.
What a Reset Actually Looks Like
78 per cent, 31 months, 15 years
- 78%
- Nasdaq decline, peak to trough
- 31
- months of falling prices
- 15
- years until a new record
The good companies fell too
Amazon's shares fell about 94 per cent from the peak at the end of 1999 to about $6 in late 2001. And it was a real company, with real customers, buying real things every day.
If you had put $10,000 in at the top, you would have had about $600 left.
The plumbing waited 25 years
Cisco's shares did not make a new closing high until December 2025. The company was fine. But the price people paid was the problem.
Hope kept people coming back
The Nasdaq did not fall in a straight line. There were big rallies on the way down. And every one of them convinced people the worst was over. So they bought the dip, and then they bought it again.
What a 78 per cent fall feels like
Say you were 55 in 2000 with $200,000 in technology funds. Two and a half years later it is worth about $44,000. And you are 70 by the time it is back where it started.
The technology carried on. But the prices had to come back to earth.
What the Reset Built
While everyone was selling, the future was being built at bargain prices
| Event | Date | Significance |
|---|---|---|
| Nasdaq bottom | 9 October 2002 | 1,114 (down 78 per cent from the peak) |
| Google IPO | August 2004 | Listed at $85, less than 2 years after the bottom |
| Amazon S3 launch | March 2006 | Start of cloud computing, the same business CoreWeave is in today |
| iPhone launch | January 2007 | Apple redefined mobile computing |
| Amazon above old peak | 2009 | On its way to becoming one of the biggest companies on earth |
What Is Different This Time
Not exactly the same, and you need both sides
| Factor | 2000 | Today |
|---|---|---|
| Valuation | Cisco at about 200x earnings | Nasdaq 100 at about 21x forward earnings |
| Demand | Internet traffic growing but revenue models unproven | GPU rental prices strong, demand real |
| Funding | Heavily reliant on borrowed money and IPO proceeds | Big tech funds much of its AI spending from existing profits |
| Borrowed layer | Widespread | Concentrated in neoclouds like CoreWeave |
What the Trading Desk Told Its Clients
"Too much capital is chasing too little investable, power-ready compute capacity"
Bottom line. A senior Goldman Sachs trader has warned institutional clients. The repricing, he said, "could unfold gradually or through violent dislocations, potentially spilling into broader markets." Broader markets means your index fund, and that means you.
Forced selling
A systematic long-short strategy fell 1.4 per cent in a single day. That was nearly a 4 standard deviation move: statistically, a move you almost never see.
And funds were selling what they owned and buying back what they had bet against, all at once, because they had to rather than because they wanted to.
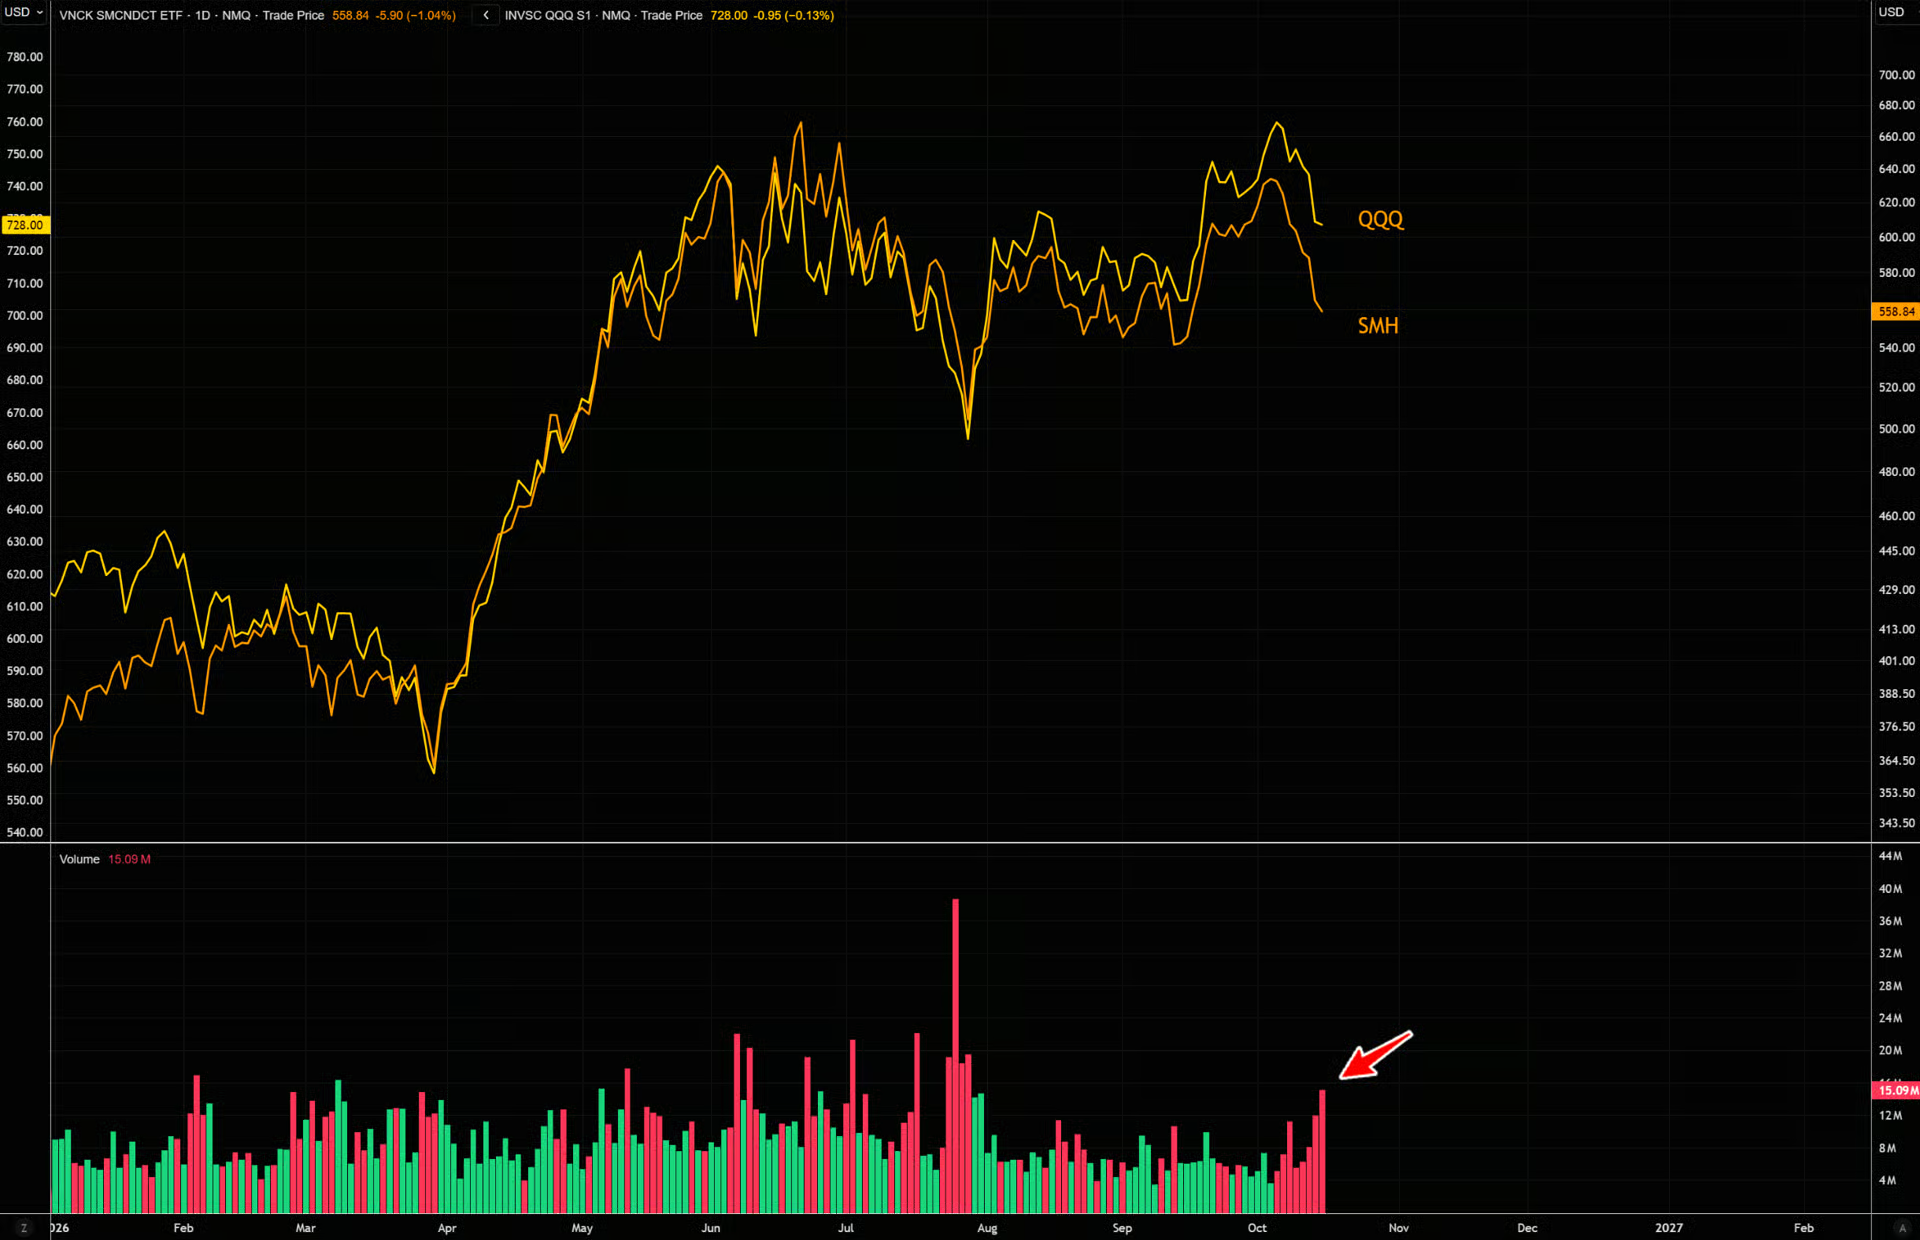
Volume
Funds that track chip companies traded in their biggest volumes for some time. And CoreWeave itself fell roughly 15 per cent in a single day this week.
The other side
The same trader suspects this may have been a local bottom. Not every scare becomes a crash. And plenty of sell-offs in the last few years looked frightening and then simply stopped.
But the debt will still be there when you look again.
What I Am Watching
Four signals and one sorting exercise
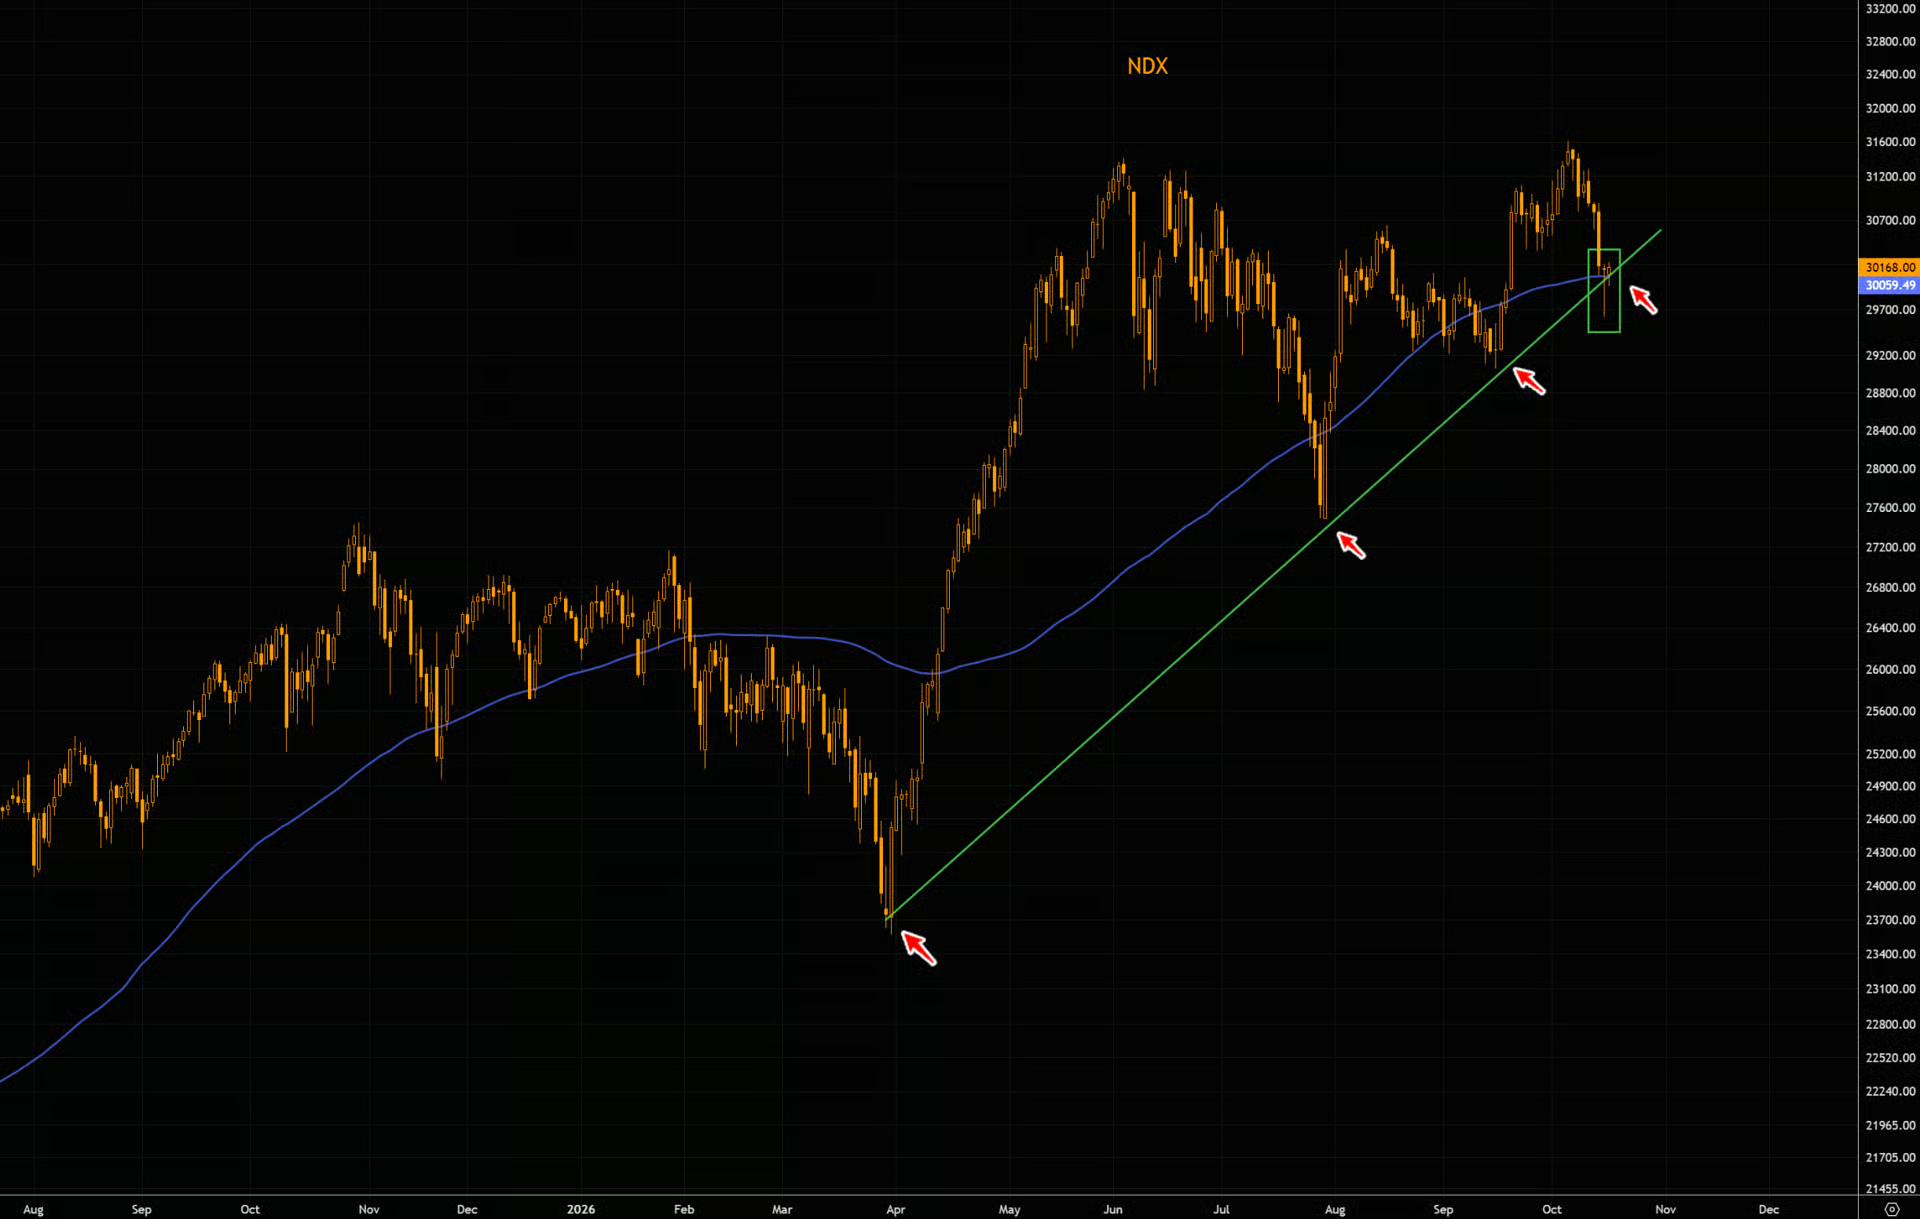
| # | Signal | What it tells you |
|---|---|---|
| 1 | The Nasdaq's trend line | If it holds, short-term relief. If it breaks and stays broken, selling speeds up. |
| 2 | CoreWeave's bonds and CDS | If insurance costs keep climbing, lenders are getting more nervous. If they fall back, the panic is easing. |
| 3 | Profit reports | At 21 times, earnings can do some of the heavy lifting. If profits arrive, 21 times starts to look reasonable. |
| 4 | Who is selling | The Winston insider hub shows buying and selling across the market. A buyer turned seller has changed their mind about something. |
Two Piles
Sort what you own
- Pile 1: Companies that own scarce computing power and pay for it from their own profits
- Pile 2: Companies that borrowed heavily, spend more than they bring in, and need lenders to keep saying yes every year
The test
Check how much debt each company has. Then check whether it brings in more cash than it spends.
You take the cash coming in from the business, minus what it spends on buildings and equipment. Analysts call it free cash flow. So if it is positive, the company can pay its own way. If it is negative year after year, it depends on lenders, and so do you as its owner.
Your index fund
Look at its top 10 holdings. Check what share of the whole fund they make up. You will find it printed on the fund's fact sheet. You might be surprised how much of your money sits in the same handful of AI names.
Two scenarios
If the line holds and profits are good, the shares that fell hardest can bounce quickly, and you may see it fast. But if the line breaks, pile 2 falls furthest and fastest, because its lenders get nervous first.
And pile 1 falls too, at least for a while. The sorting happens later.
What I will not do
I will not buy a share just because it has fallen 65 per cent. Amazon was down 65 per cent at one point and still had a long way to fall.
But I will not sell everything in a blind panic either. And the people who did that in 2002 missed Google, the cloud and the iPhone.
Turn Understanding Into Process
Five questions before the next warning shot
- Do I have three to six months of expenses available without selling investments?
- Am I overexposed to one crowded theme or one source of borrowed money?
- Can I explain why each business I own makes money?
- Do the businesses I own have pricing power, cash generation and manageable debt?
- Would a broad market sell-off force me to act, or give me choices?
Disclaimer
This report is for educational and informational purposes only and does not constitute financial, investment, legal, tax or accounting advice. It is not a recommendation, solicitation or offer to buy or sell any security, currency, commodity or financial product. No buy/sell rating or price target is provided. All investments involve risk, including the possible loss of principal. Market events, relationships and historical comparisons described here may not repeat. Illustrations simplify complex systems and may omit factors. Readers should conduct their own research and consult appropriately qualified professionals before making financial decisions. Past performance is not indicative of future results. The Prehn Institute and Winston make no guarantee regarding outcomes.