
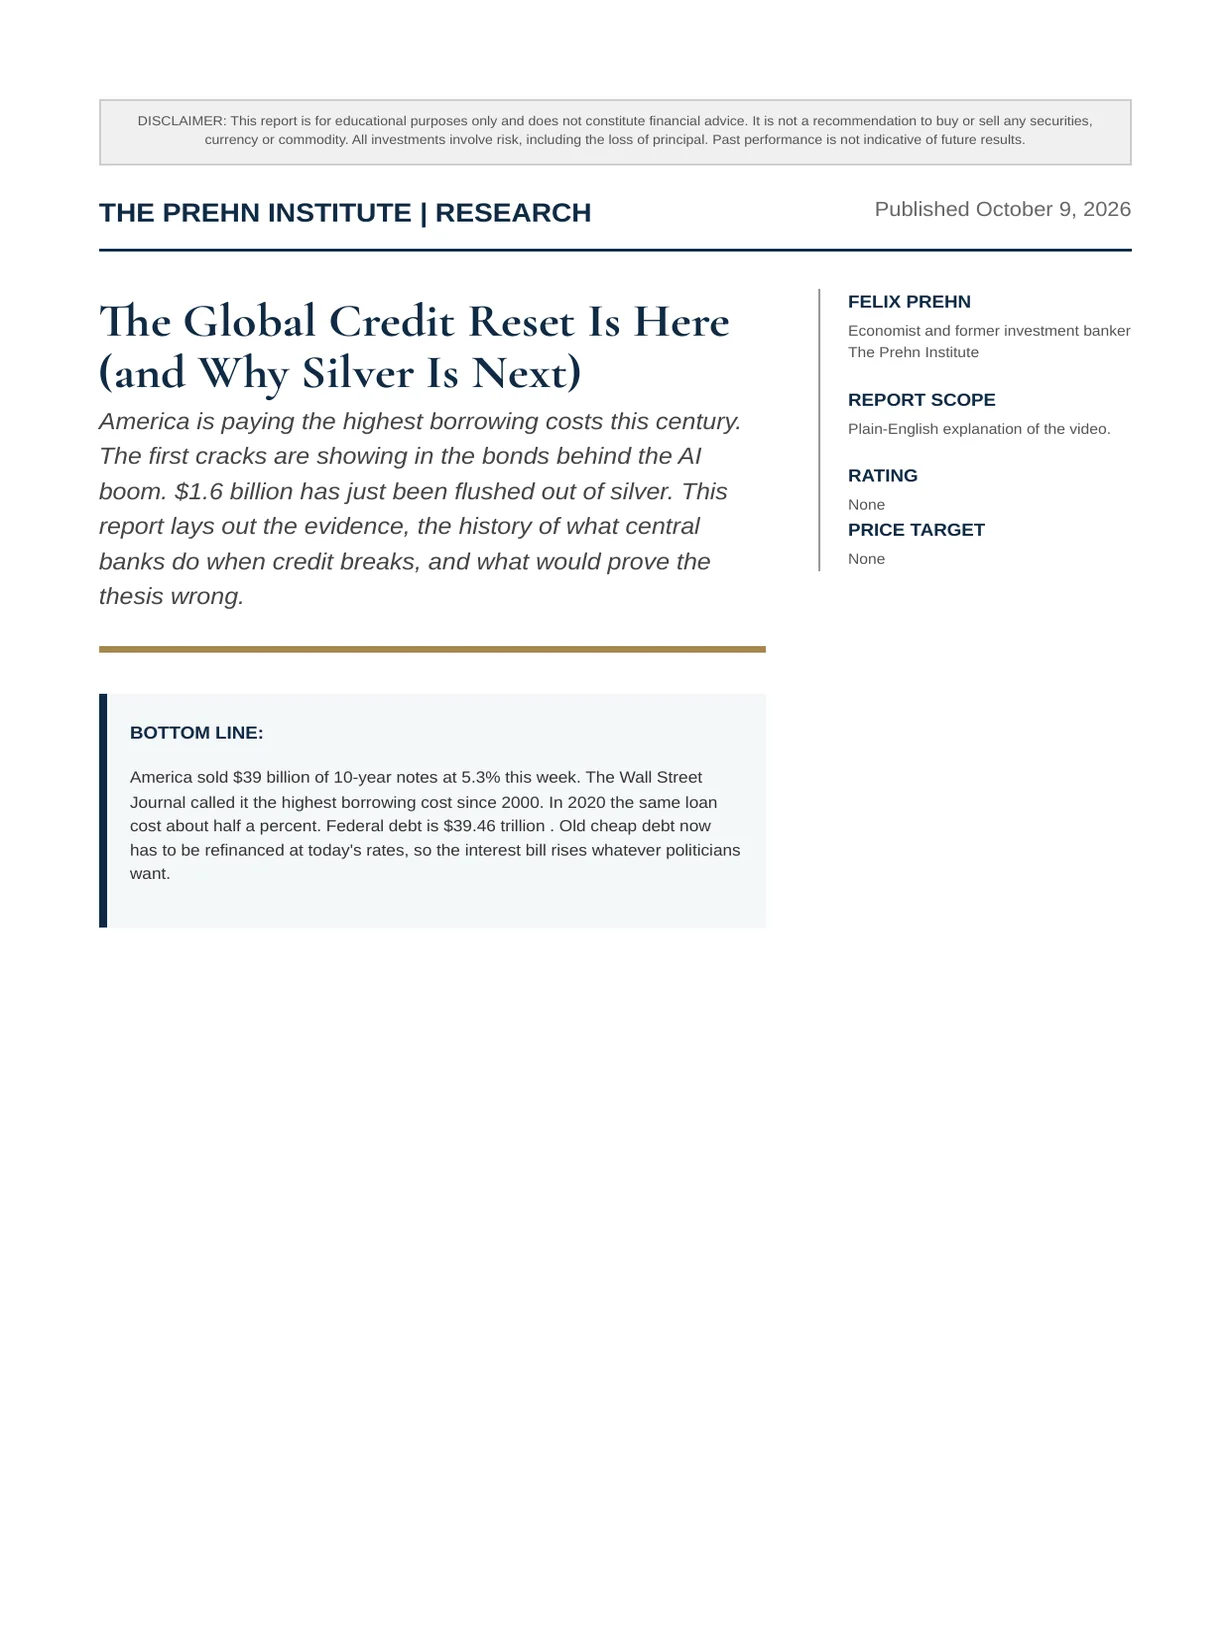
The Global Credit Reset Is Here (and Why Silver Is Next)
America is paying the highest borrowing costs this century. The first cracks are showing in the bonds behind the AI boom. $1.6 billion has just been flushed out of silver. This report lays out the evidence, the history of what central banks do when credit breaks, and what would prove the thesis wrong.
Felix Nikolas Prehn · 9 October 2026 · 23 pages
Bottom line
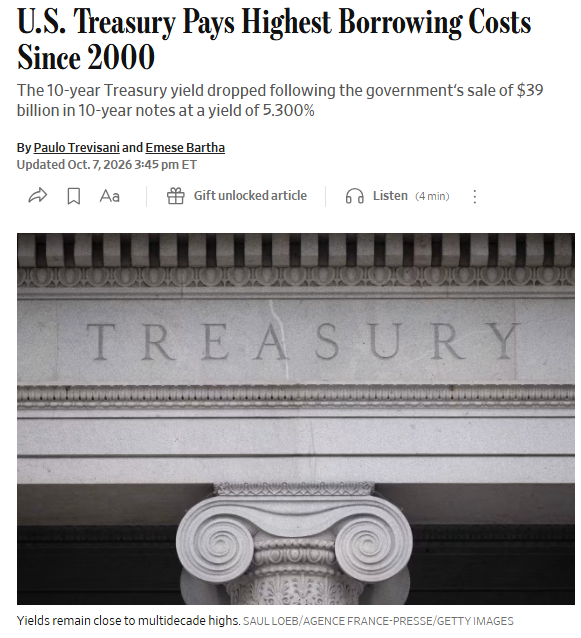
America sold $39 billion of 10-year notes at 5.3% this week. The Wall Street Journal called it the highest borrowing cost since 2000. In 2020 the same loan cost about half a percent. Federal debt is $39.46 trillion . Old cheap debt now has to be refinanced at today's rates, so the interest bill rises whatever politicians want.
Part 1 · What the credit reset is
- America sold $39 billion of 10-year notes at 5.3% this week. The Wall Street Journal called it the highest borrowing cost since 2000. In 2020 the same loan cost about half a percent.
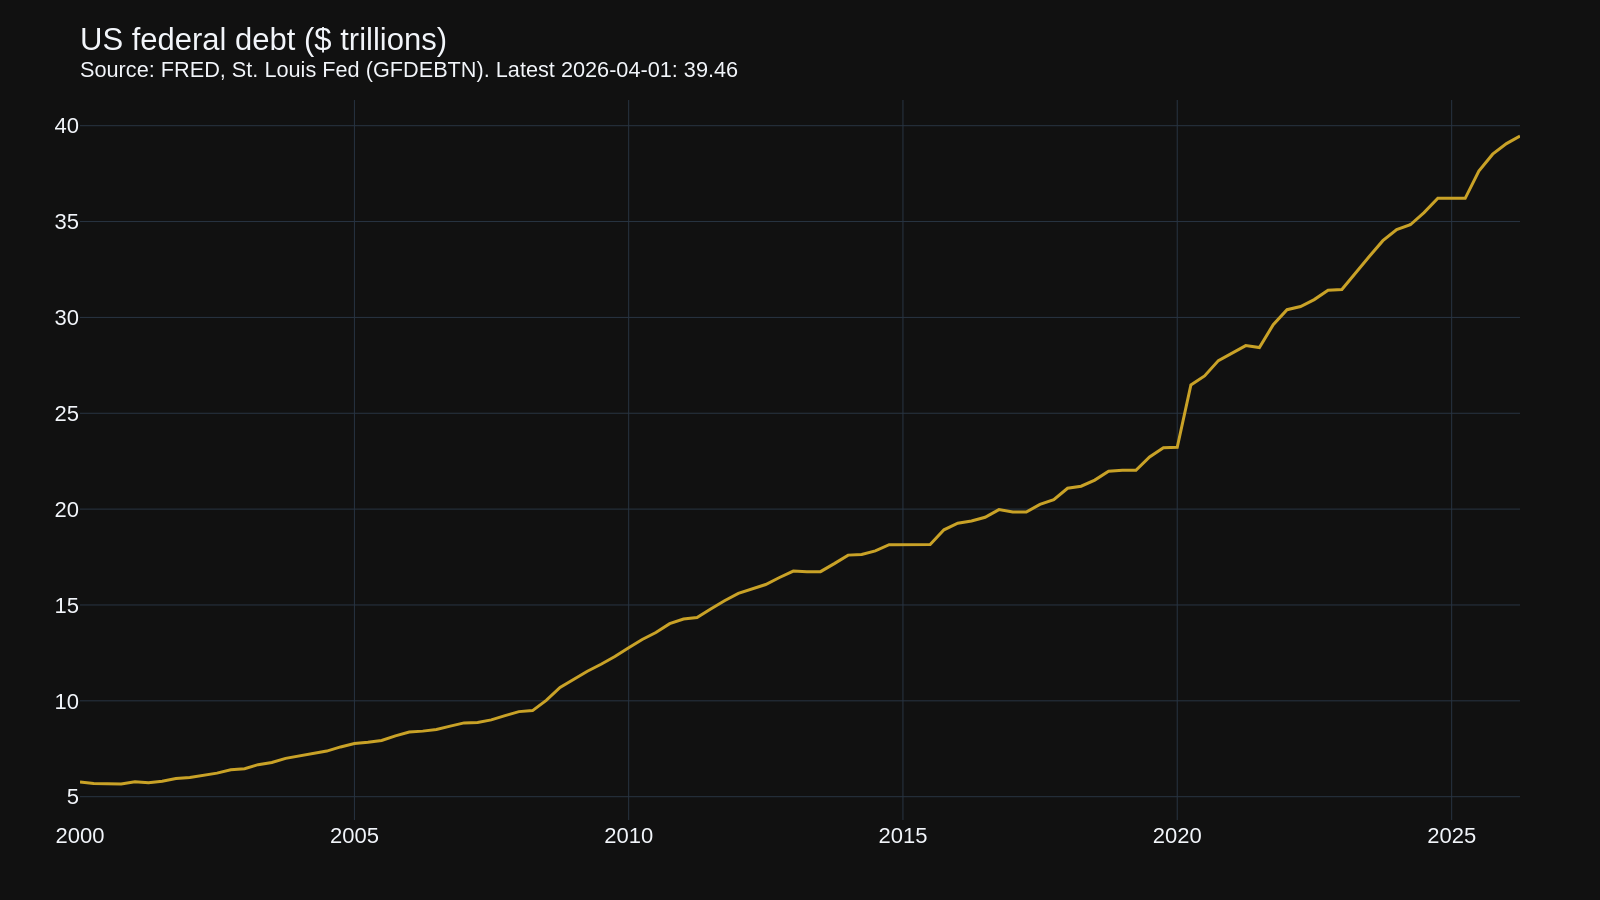
- Federal debt is $39.46 trillion . Old cheap debt now has to be refinanced at today's rates, so the interest bill rises whatever politicians want.
- Stress is showing first in AI-linked debt: Oracle, SpaceX and the bond behind Meta's Hyperion data centre are at or near record lows, and insuring Paramount's debt costs close to 2008 levels.
- AI-related stocks are 49% of the S&P 500 , while Morgan Stanley finds 89% of US stocks have fallen more than 10% from their peak since 1 June.
- Silver has roughly halved from its January peak near $117. A market report puts last week's selling at $1.6 billion , much of it forced or rule-based.
- History says that when credit breaks, the Federal Reserve creates money. That has tended to favour scarce assets such as silver, and lower yields would favour long-dated government bonds.
- 5.3%
- 10-year US auction yield, highest since 2000
- $39.46T
- US federal debt, Q2 2026
- 49%
- AI-related share of the S&P 500
- $1.6B
- Sold out of silver in a single week
The price of money is going back up
Credit is simply the price of borrowing, and almost everything in your financial life is priced off it: mortgages, pensions, company valuations and house prices. For about 15 years that price was held close to zero. Governments, companies and households built their plans around it.
Jim Bianco of Bianco Research summed up the change this week:
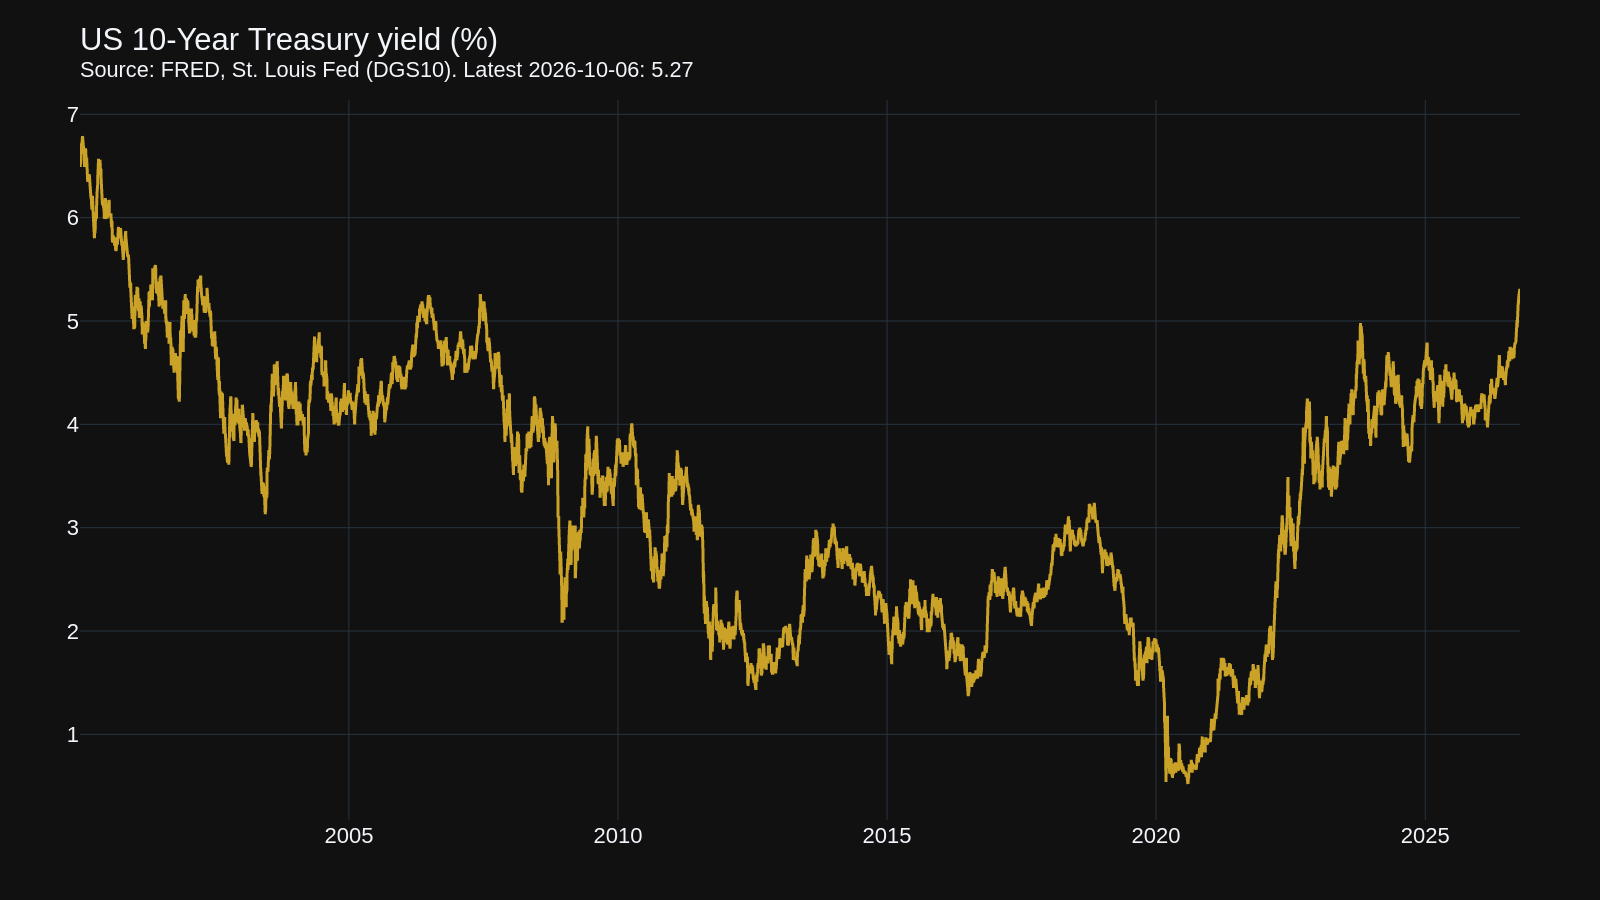
The 30-year yield closed at 5.66% on 5 October, its highest since 2002. That matters because of the size of the bill. Federal debt stood at $23.22 trillion at the start of 2020. It is now $39.46 trillion.
A simple illustration (our own numbers). $1 trillion borrowed at 1% costs $10 billion a year in interest. Governments rarely repay debt; they borrow again to roll it over. Refinance that same $1 trillion at 5% and the bill becomes $50 billion a year. Same debt, 5 times the cost. Repeat that across the trillions maturing every year and the interest bill becomes the story.
The 3 doors
A government whose interest bill is eating its budget has 3 options. Cut spending. Raise taxes. Or let inflation do the work, which in practice means the central bank creates money and holds borrowing costs down while prices rise faster than interest rates. The first 2 lose elections. The third is quiet.
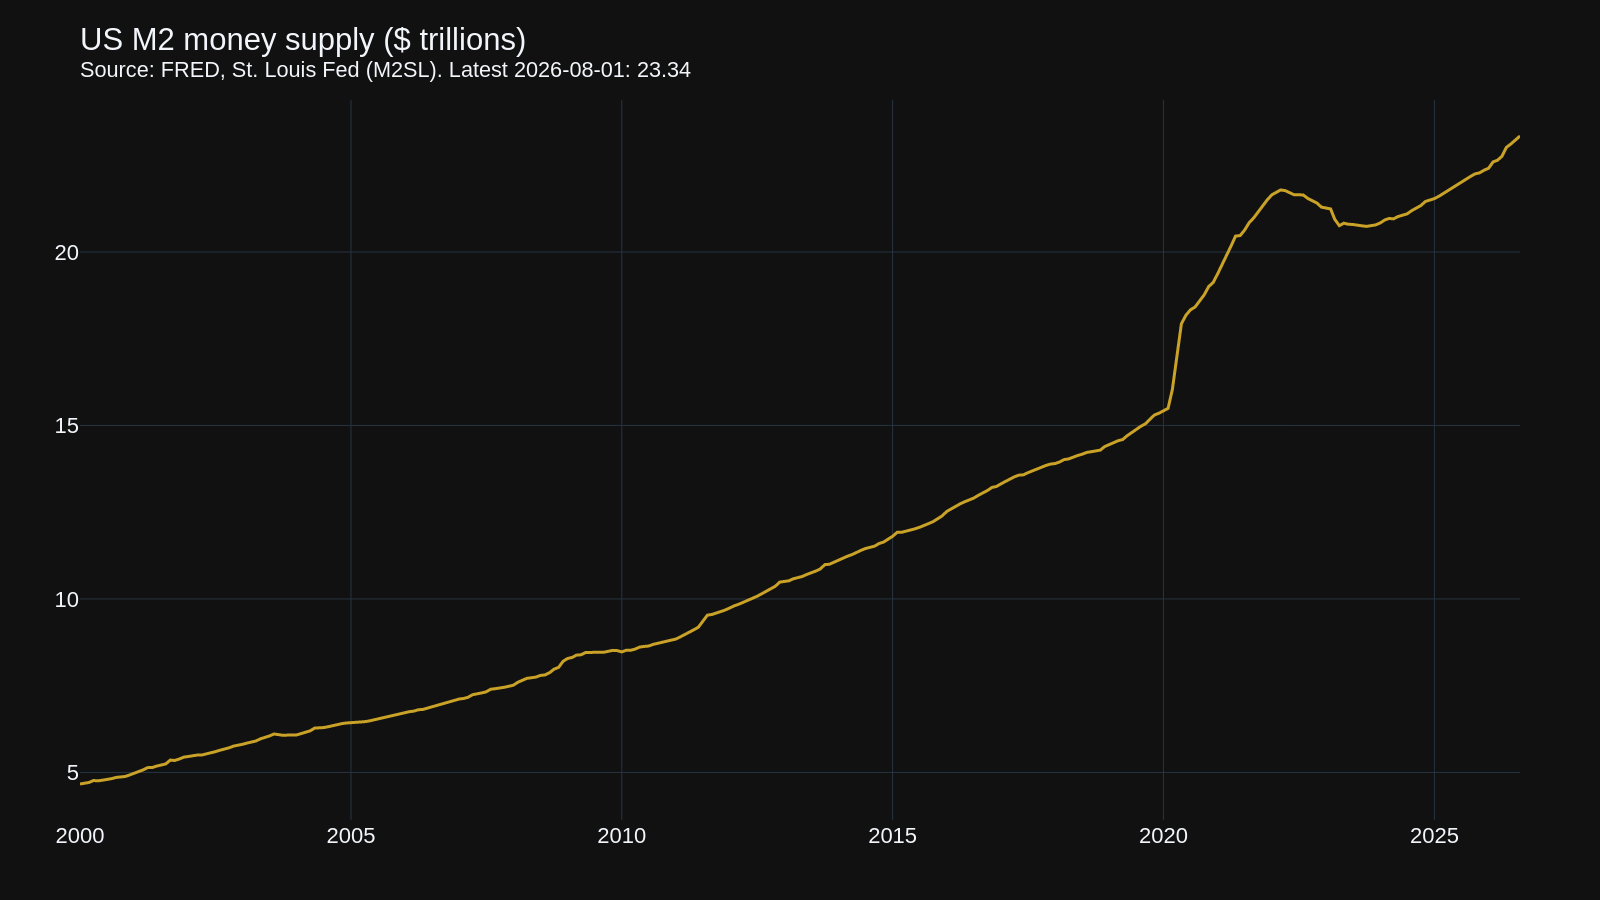
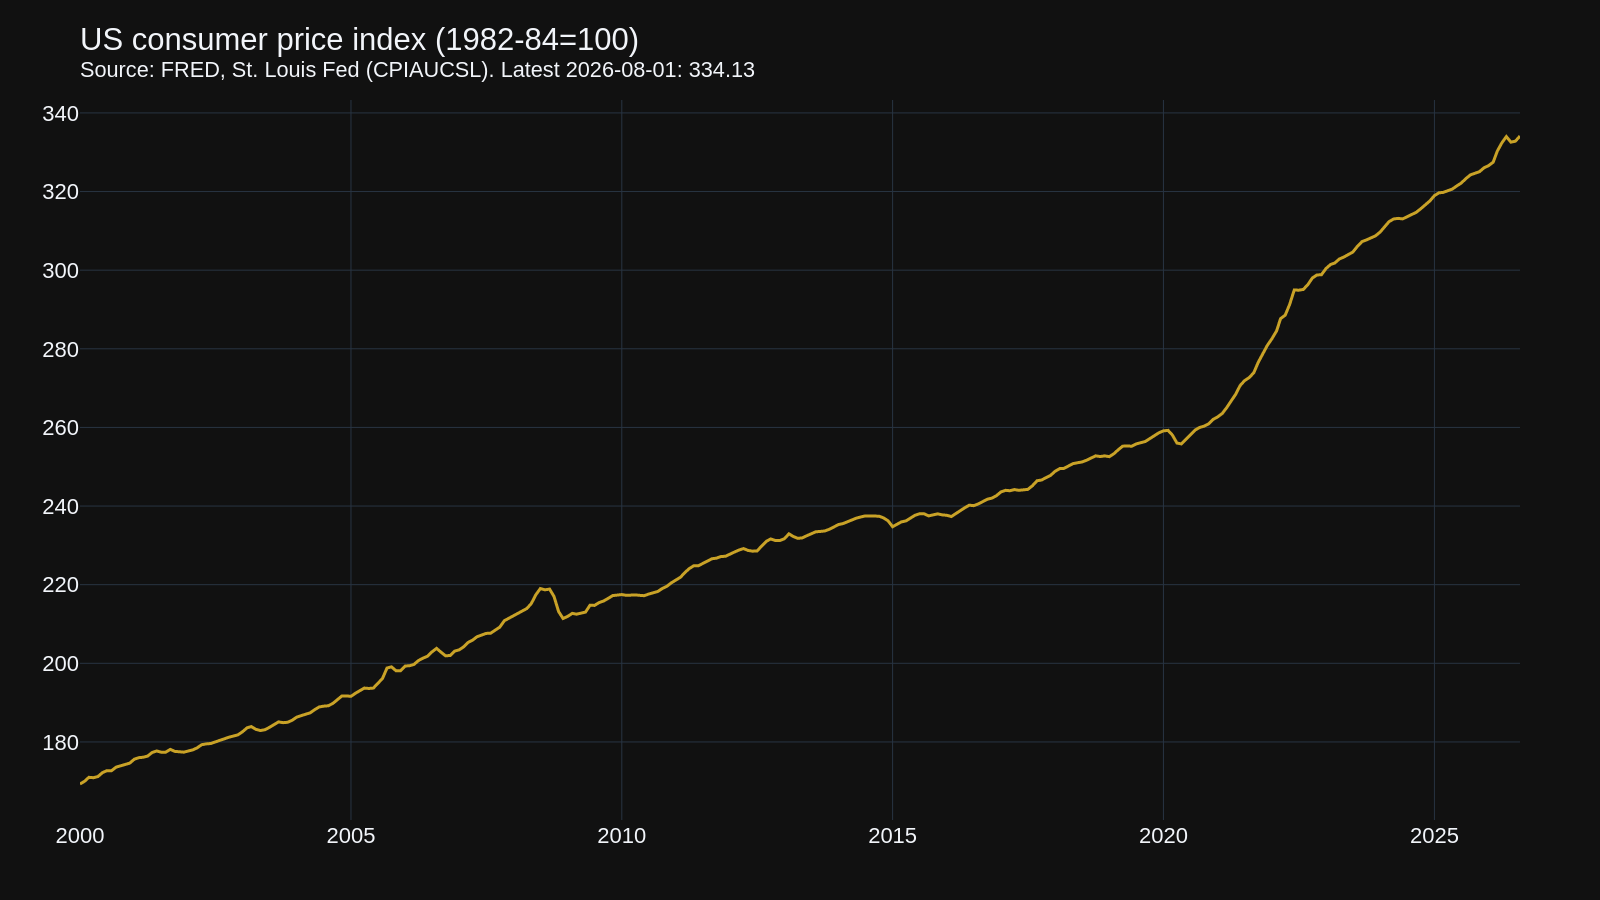
America used the third door very recently. M2 money supply rose from $15.49 trillion in February 2020 to $23.34 trillion in August 2026, an increase of 51%. Consumer prices rose 28.9% over the same period, so a basket that cost $100 then costs about $129 now.
Part 2 · Where the cracks are showing
4 bond charts from the same week
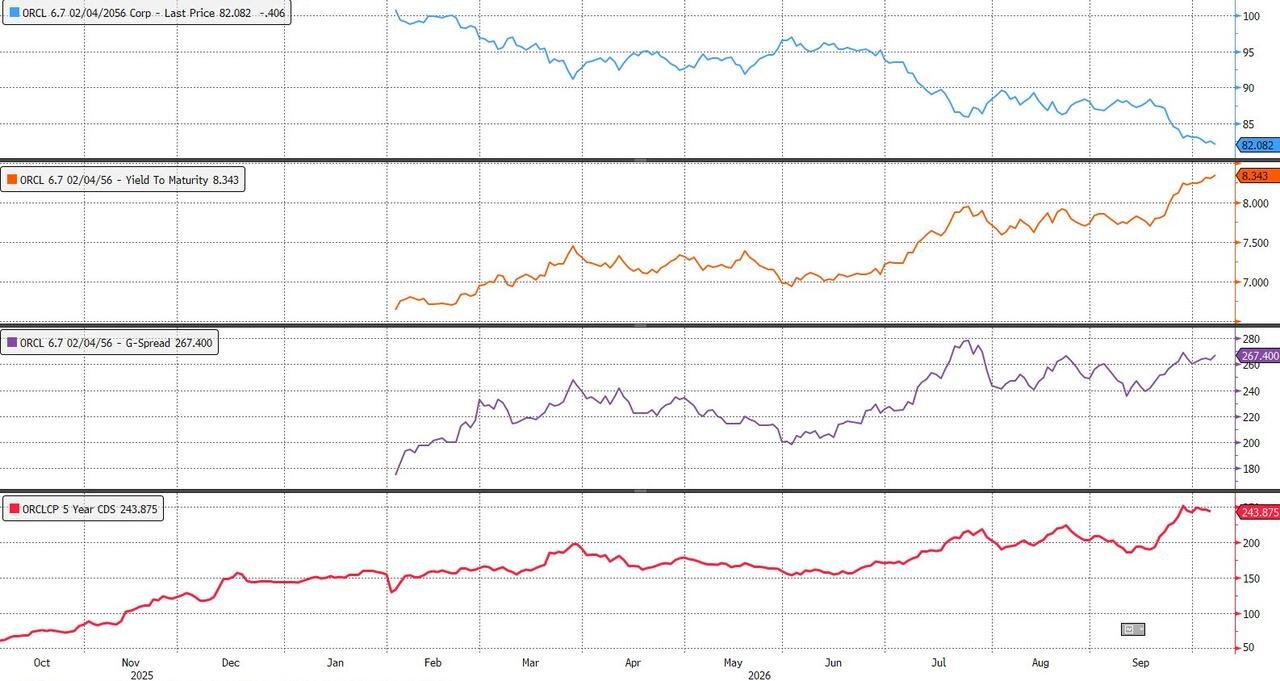
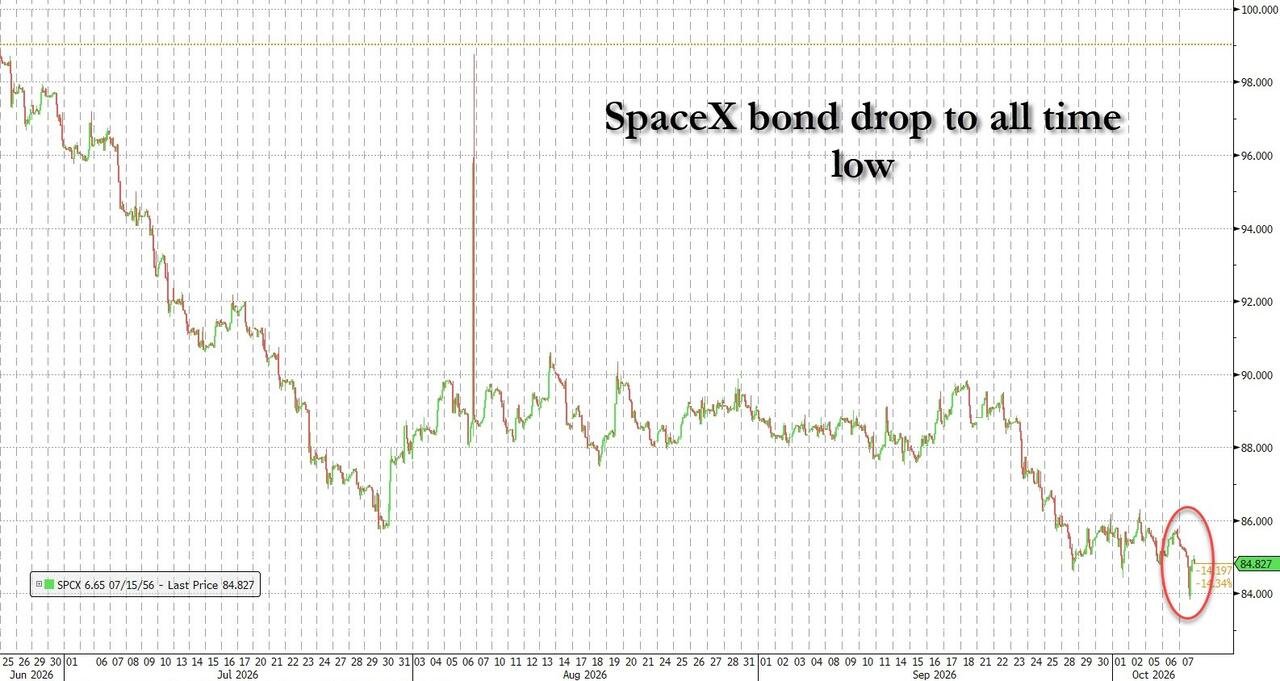
Credit is where trouble tends to show up first; the stock index is where it shows up last. 4 charts circulated together on 7 October. Each one alone is a curiosity. Together they point the same way.
1. Oracle. Oracle has borrowed heavily to build AI data centres. Its 6.7% bond due 2056 was around 100 in February 2026 and now trades at about 82. The yield has risen to 8.34%. The cost of insuring Oracle's debt against default, its 5-year credit default swap, has gone from about 60 in October 2025 to about 244: roughly 4 times as expensive.
2. SpaceX. Its 6.65% bond due 2056 traded at about 99 in late June 2026. It is now 84.8, an all-time low and down about 14%.
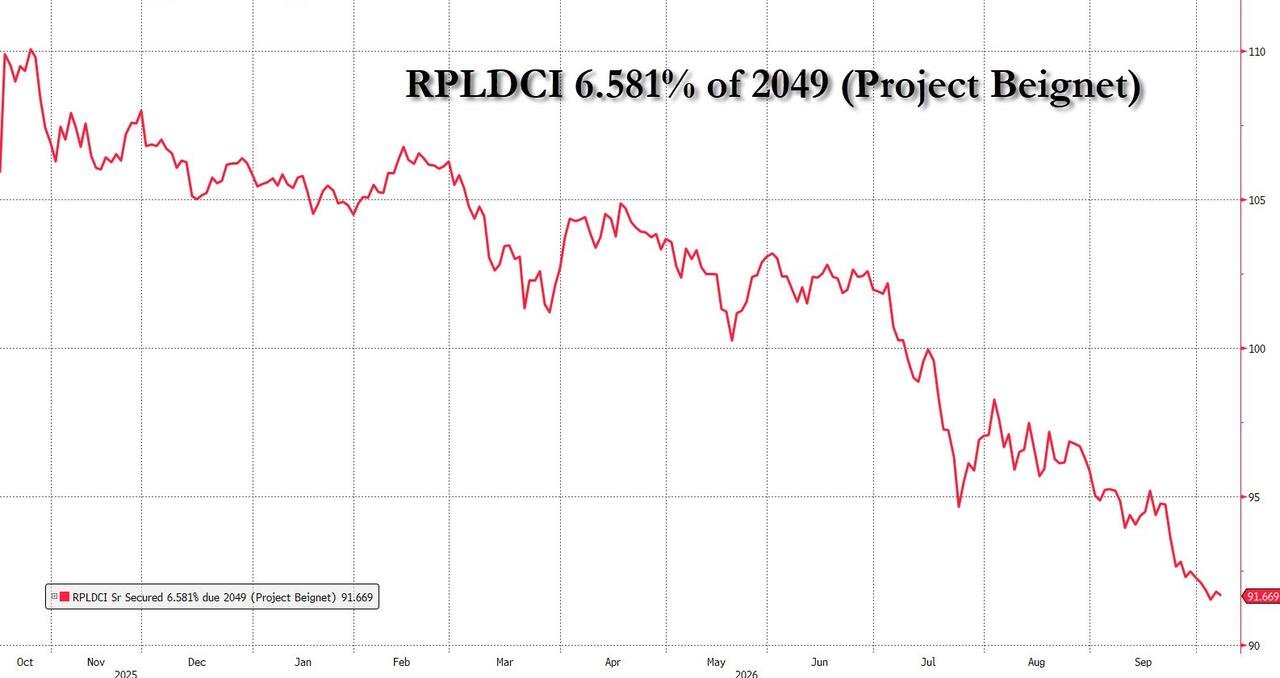
3. Project Beignet. The 6.581% secured bond that financed Meta's Hyperion data centre traded at about 110 in October 2025. It is now 91.7, a record low.
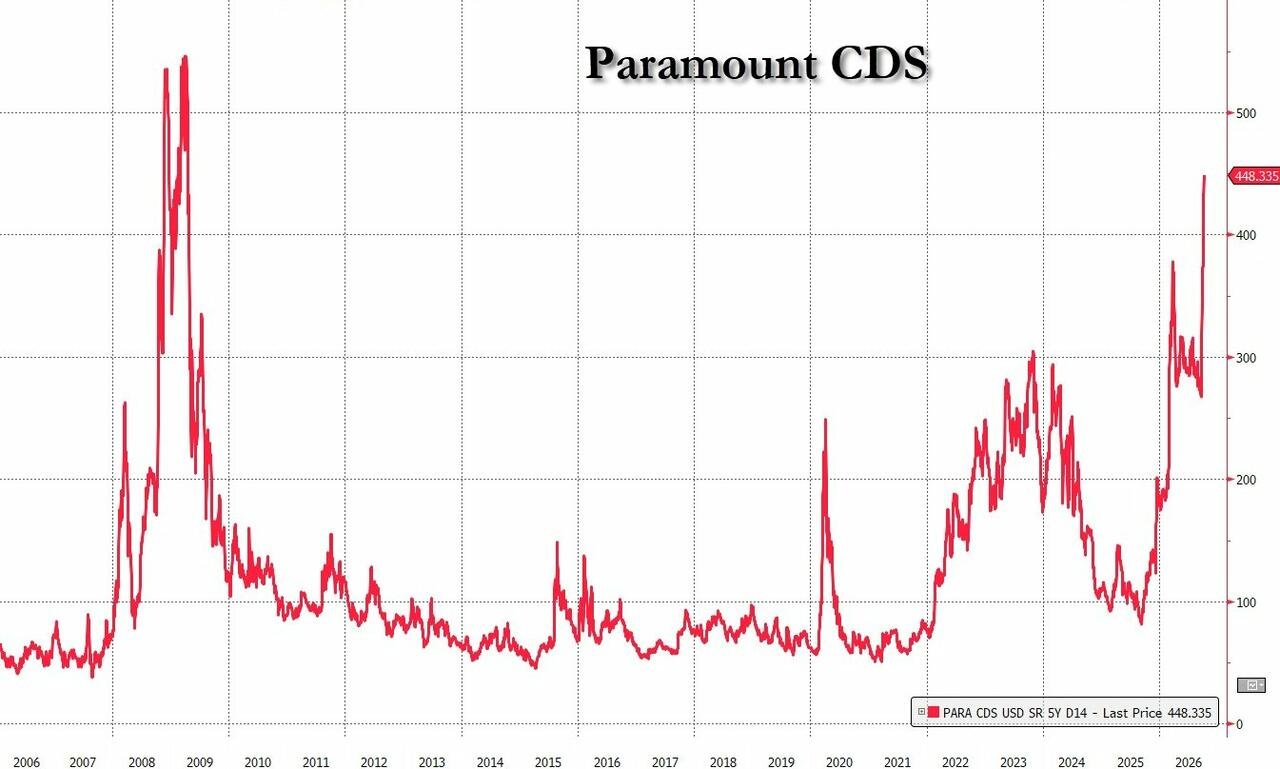
4. Paramount. Its 5-year CDS is about 448. At the worst of the 2008 financial crisis it was about 540; in the 2023 scare it peaked near 300. Paramount is being priced closer to a crisis than to a normal wobble.
Why it matters for your pension
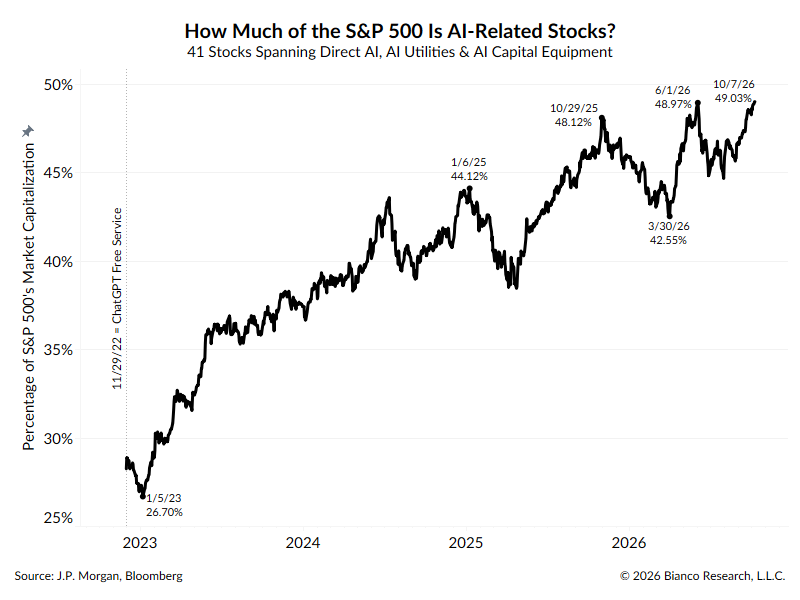
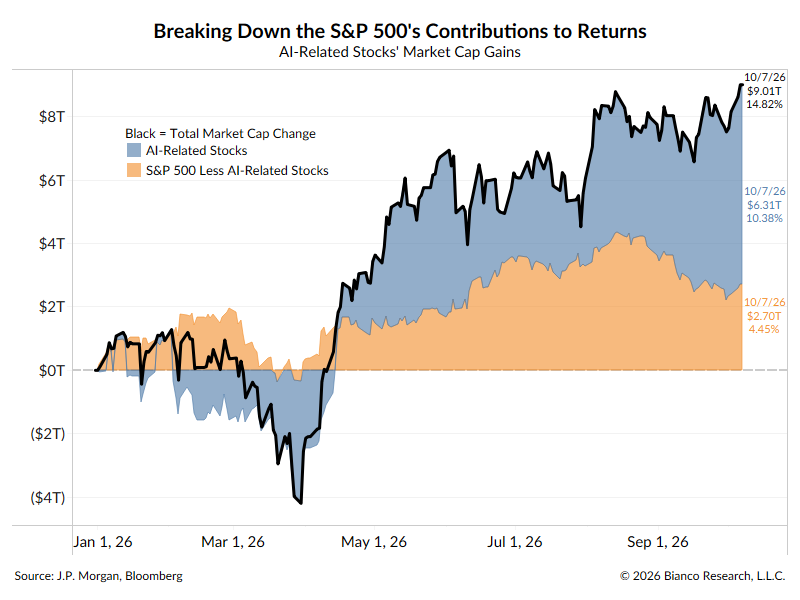
Concentration. On JPMorgan's basket, charted by Bianco Research, AI-related stocks made up 49.03% of the S&P 500 on 7 October 2026, up from 26.70% at the start of 2023. Those 41 companies account for $6.31 trillion of the index's $9.01 trillion gain this year, roughly two thirds. Bianco adds that with SpaceX included, AI would be 51%, and that the last time a single theme was more than half the index was the railways in the 19th century.
3 of the 4 stressed bonds above (Oracle, SpaceX and the Meta data centre) are AI money. And AI is now half of a typical index fund.
The bear market under the surface
Morgan Stanley measured how far each stock in the Russell 3000, effectively the whole US market, has fallen from its peak at any point since 1 June:
| Group | >10% | >20% | >30% | >50% |
|---|---|---|---|---|
| Russell 3000 | 89% | 54% | 29% | 7% |
| Semiconductors | 99% | 96% | 83% | 34% |
| Software | 98% | 77% | 47% | 12% |
| Utilities | 80% | 24% | 13% | 1% |
| Banks | 46% | 5% | 1% | 0% |
Percentage of stocks with a maximum drawdown greater than each threshold since 1 June 2026. Source: Morgan Stanley, via social media reports.
The index looks calm because a handful of giants are holding it up. Most of the market has already been through its own bear market, and the lenders to those giants have started asking for more. That is what a credit reset looks like from the inside.
Part 3 · The great silver flush
$1.6 billion out in one week
A market report published on 8 October puts last week's selling in silver at $1.6 billion . (A figure of $16 billion has also circulated; that appears to be a misreading of the headline.) The report gives 3 reasons: the dollar remains a headwind, speculative positioning has taken a hit, and trend-following funds (known in the industry as CTAs) are adding to the selling. It also says silver is approaching a critical technical juncture. The full report is behind a paywall, so we quote nothing beyond those points.
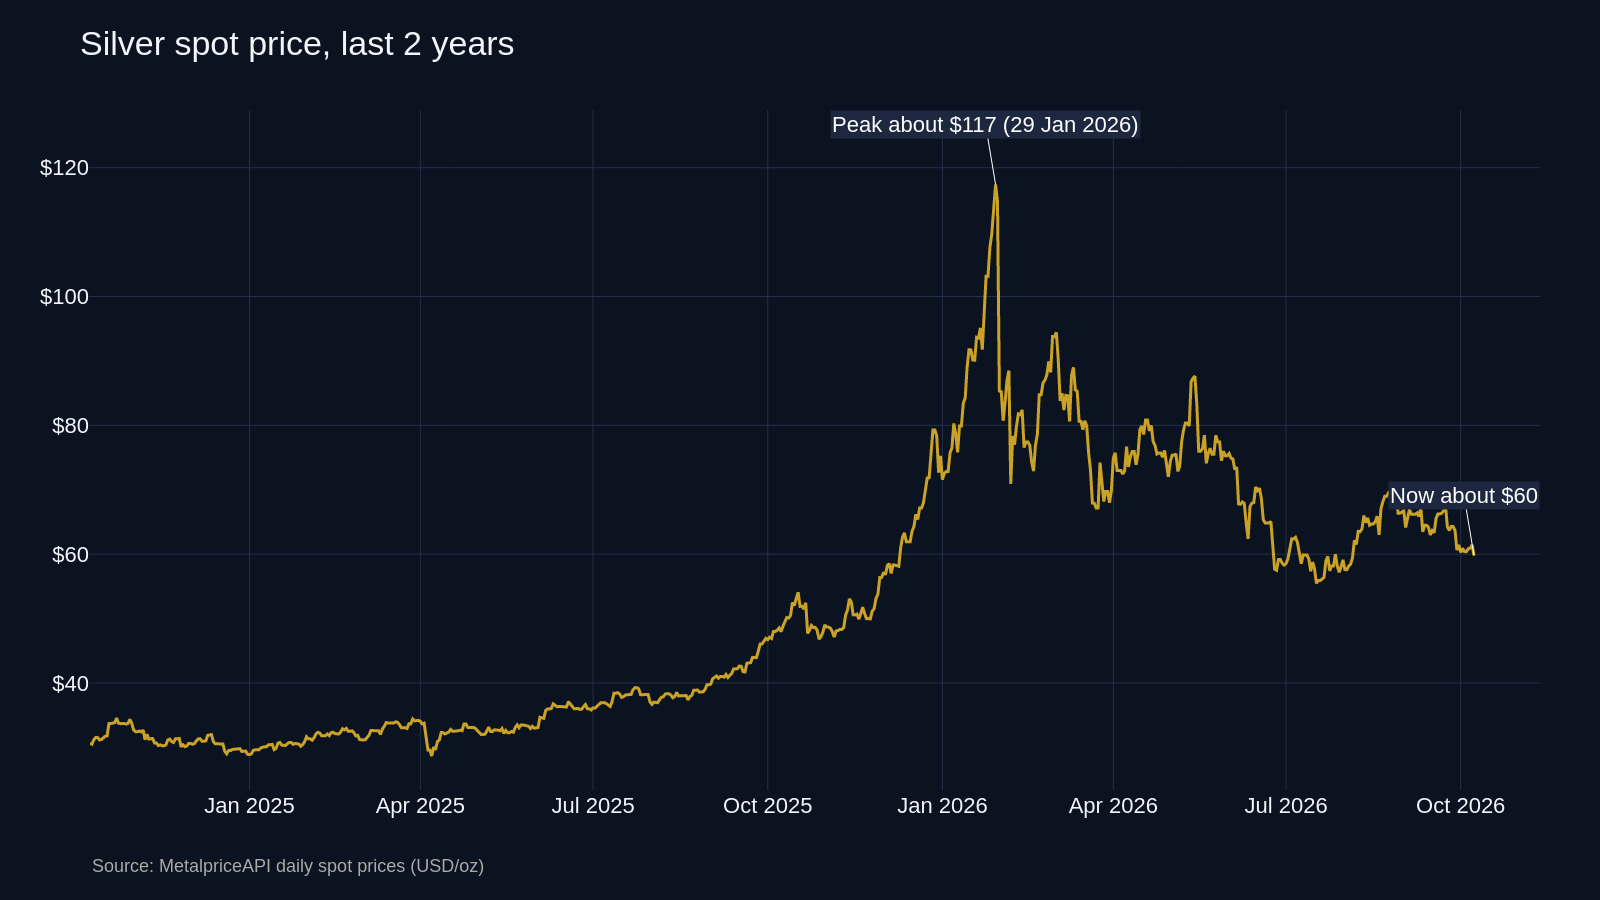
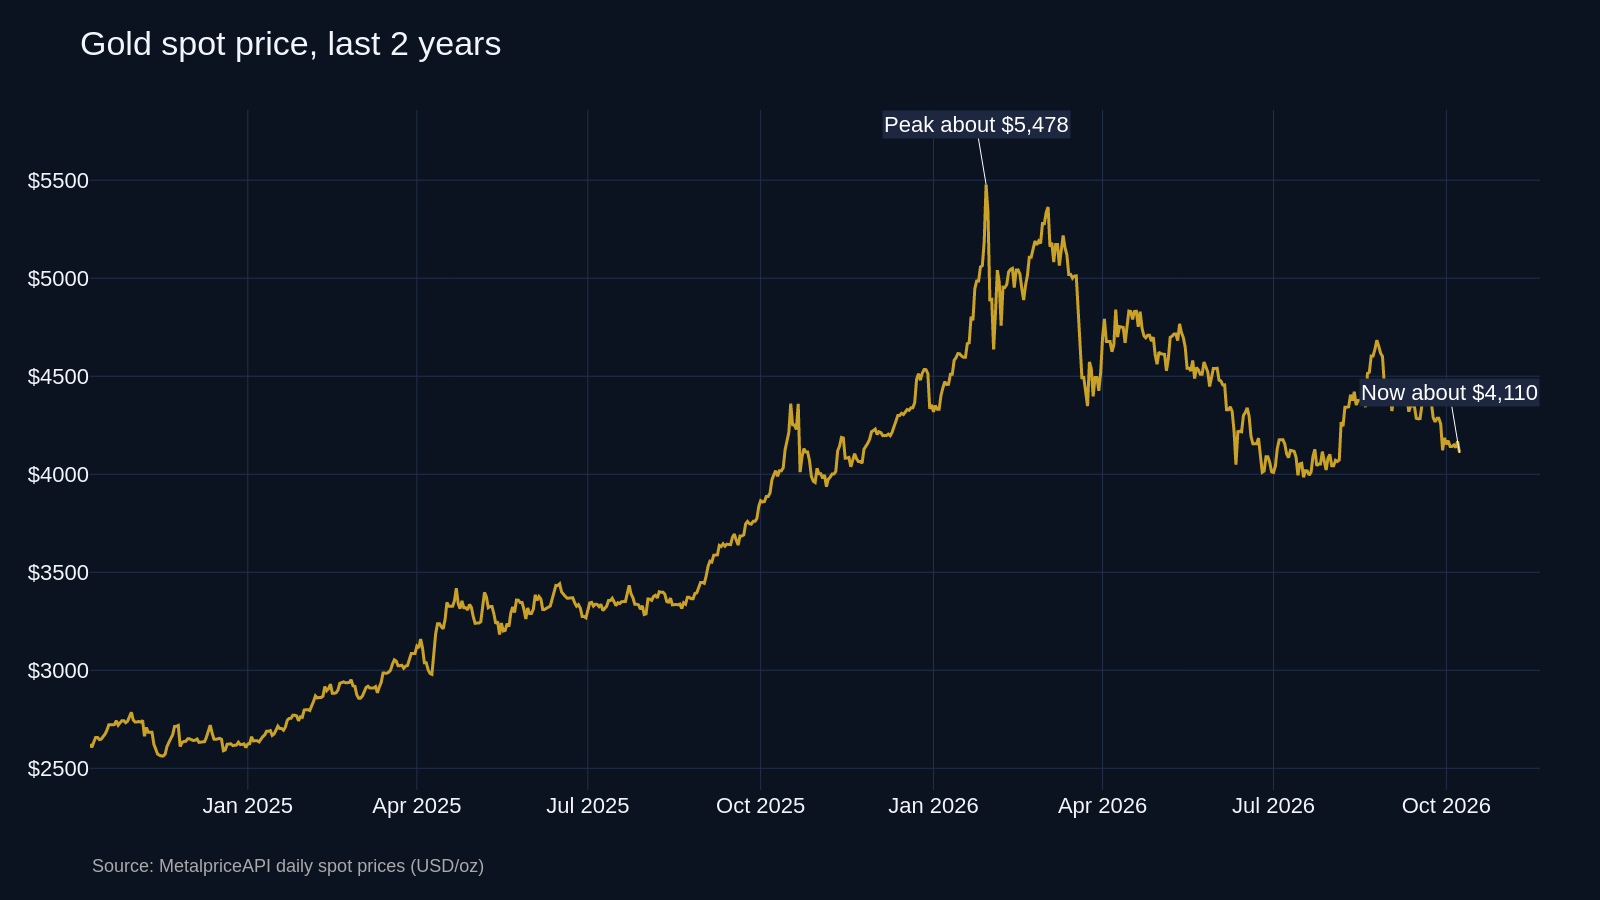
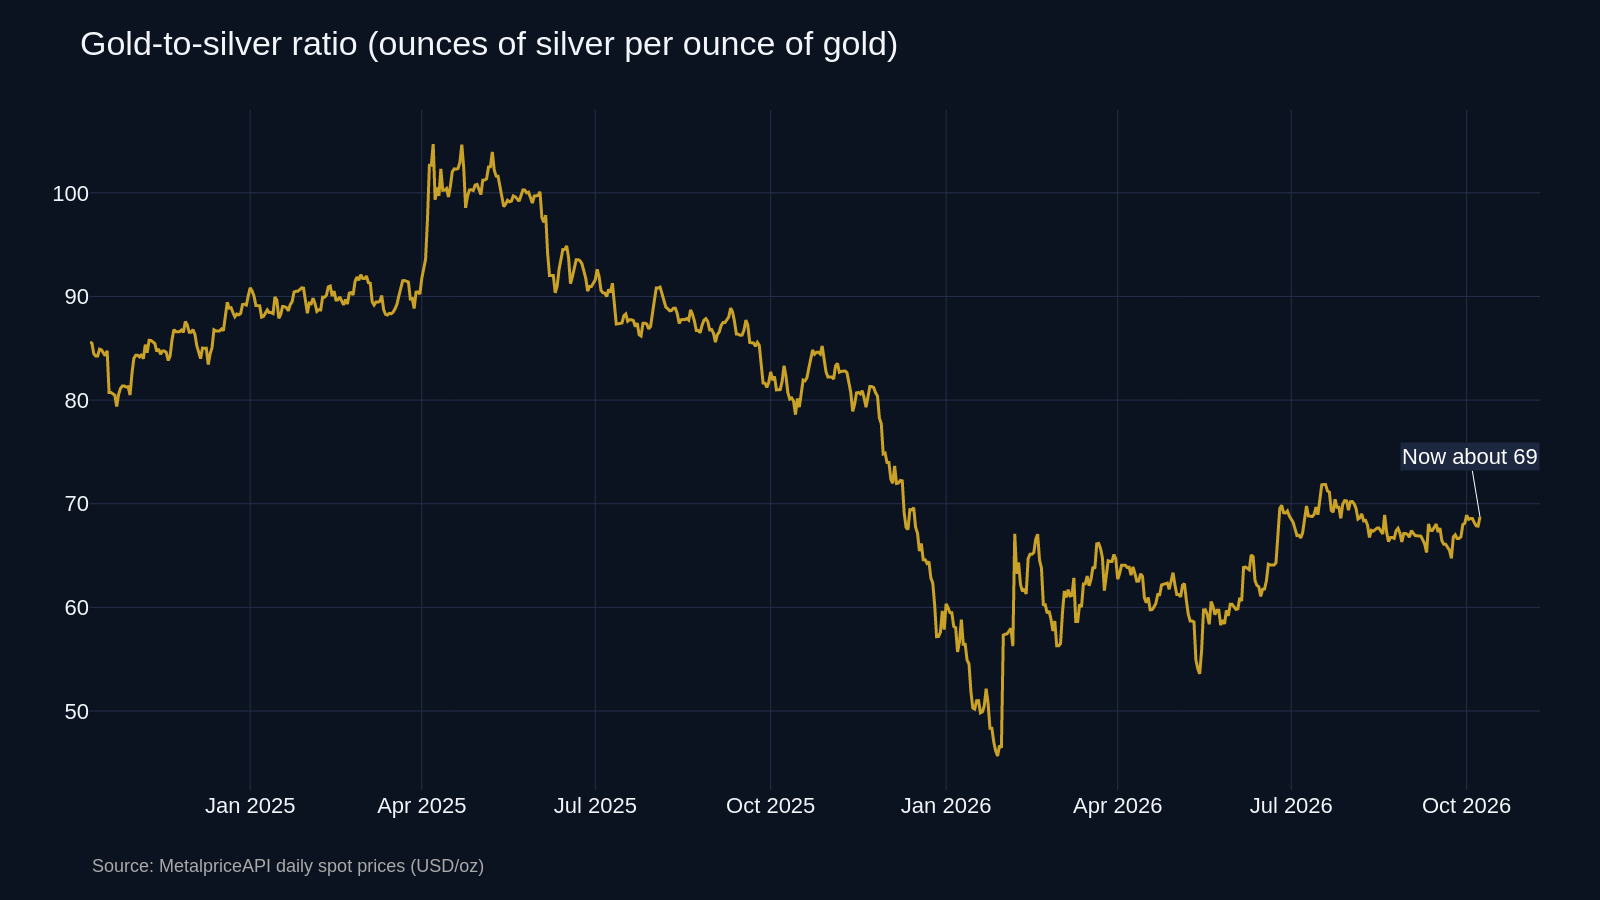
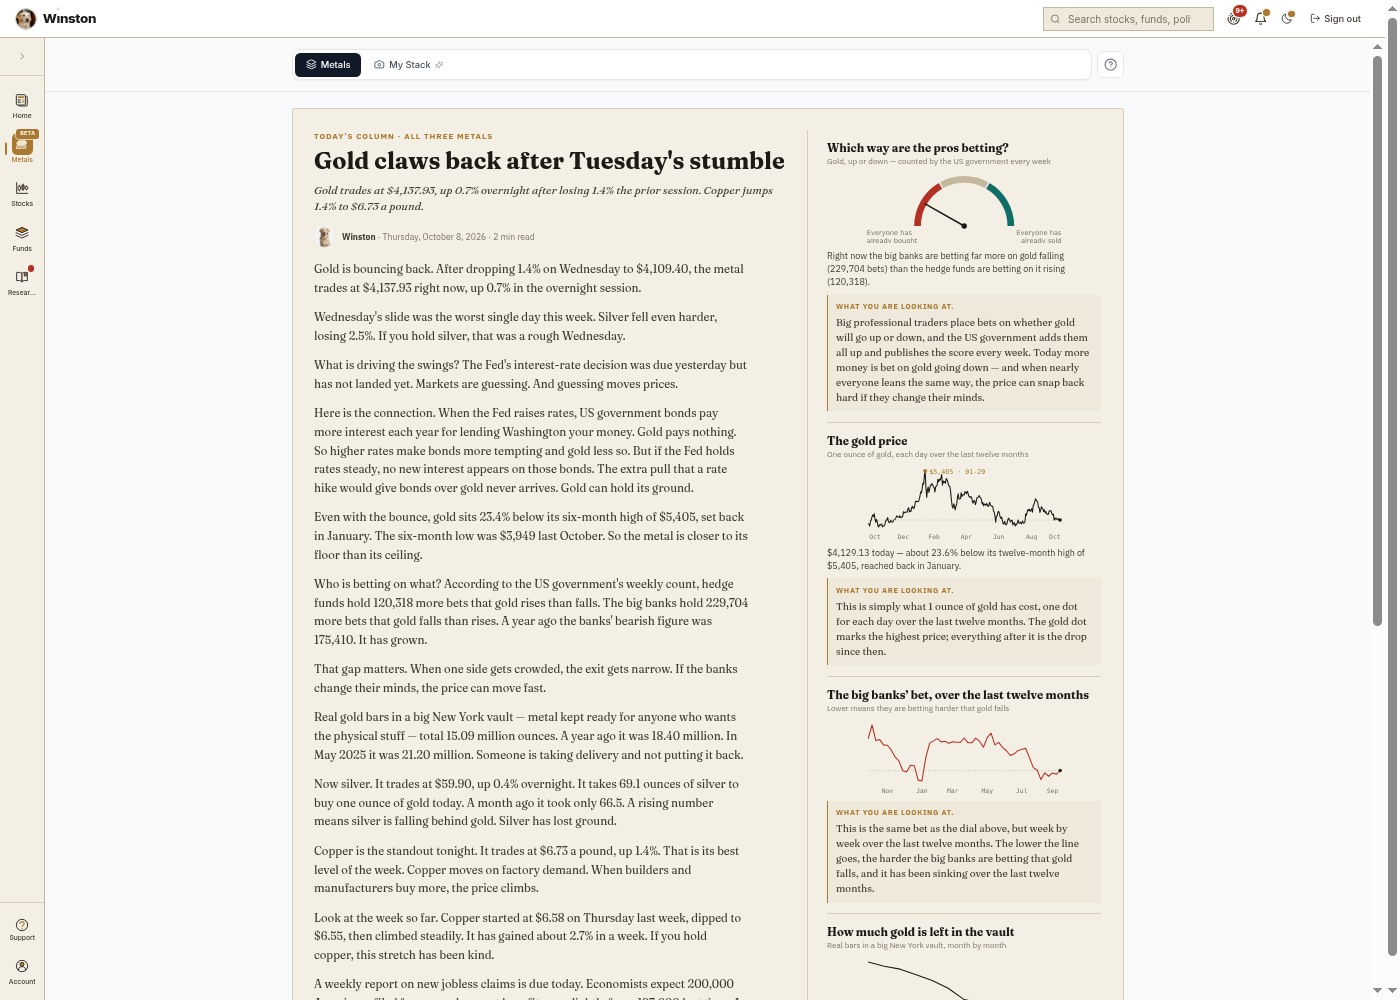
On 8 October spot silver was about $59.09 an ounce and spot gold about $4,127. That puts the gold-to-silver ratio near 70: it takes about 70 ounces of silver to buy 1 ounce of gold. Silver has roughly halved from its January peak.
Who sold matters more than how much
There are 2 kinds of seller. The first has changed their mind about value; that is information and deserves respect. The second sells because a rule says so. A trend-following fund sells because the price fell. A leveraged trader sells because the broker demands more margin. Neither tells you anything about how much silver the world will need next year.
How a margin spiral works (illustrative numbers). A trader controls $100,000 of silver with $10,000 of their own money and $90,000 borrowed. Silver falls 5%. The position is worth $95,000, they still owe $90,000, and half their own money has gone. The broker asks for more cash. If it is not there, the broker sells, which pushes the price down a little more and triggers the next trader's margin call. Nobody in that chain has changed their view. They have run out of room.
Of the 3 reasons in the report, 2 (positioning and trend-fund selling) are the second kind. The dollar is a genuine force and is covered under the risks below.
Silver has been here before. In 1980, 2011 and again at the end of 2025, exchanges raised margin requirements into a rally, leveraged traders were forced out and the price fell hard. What happened next depended on whether real demand was still underneath. In 1980 and 2011 recovery took years. At the end of 2025, with industrial demand strong, it took weeks.
Part 4 · Why silver is next
The lever that gets pulled when credit breaks
The Federal Reserve's balance sheet is a picture of how much money it has created. In September 2008 it was about $0.9 trillion; by December 2008 it was $2.25 trillion, more than double in 3 months. In February 2020 it was about $4.16 trillion; by June 2020 it was $7.17 trillion. It peaked near $9 trillion in 2022 and stood at $6.74 trillion on 30 September 2026.
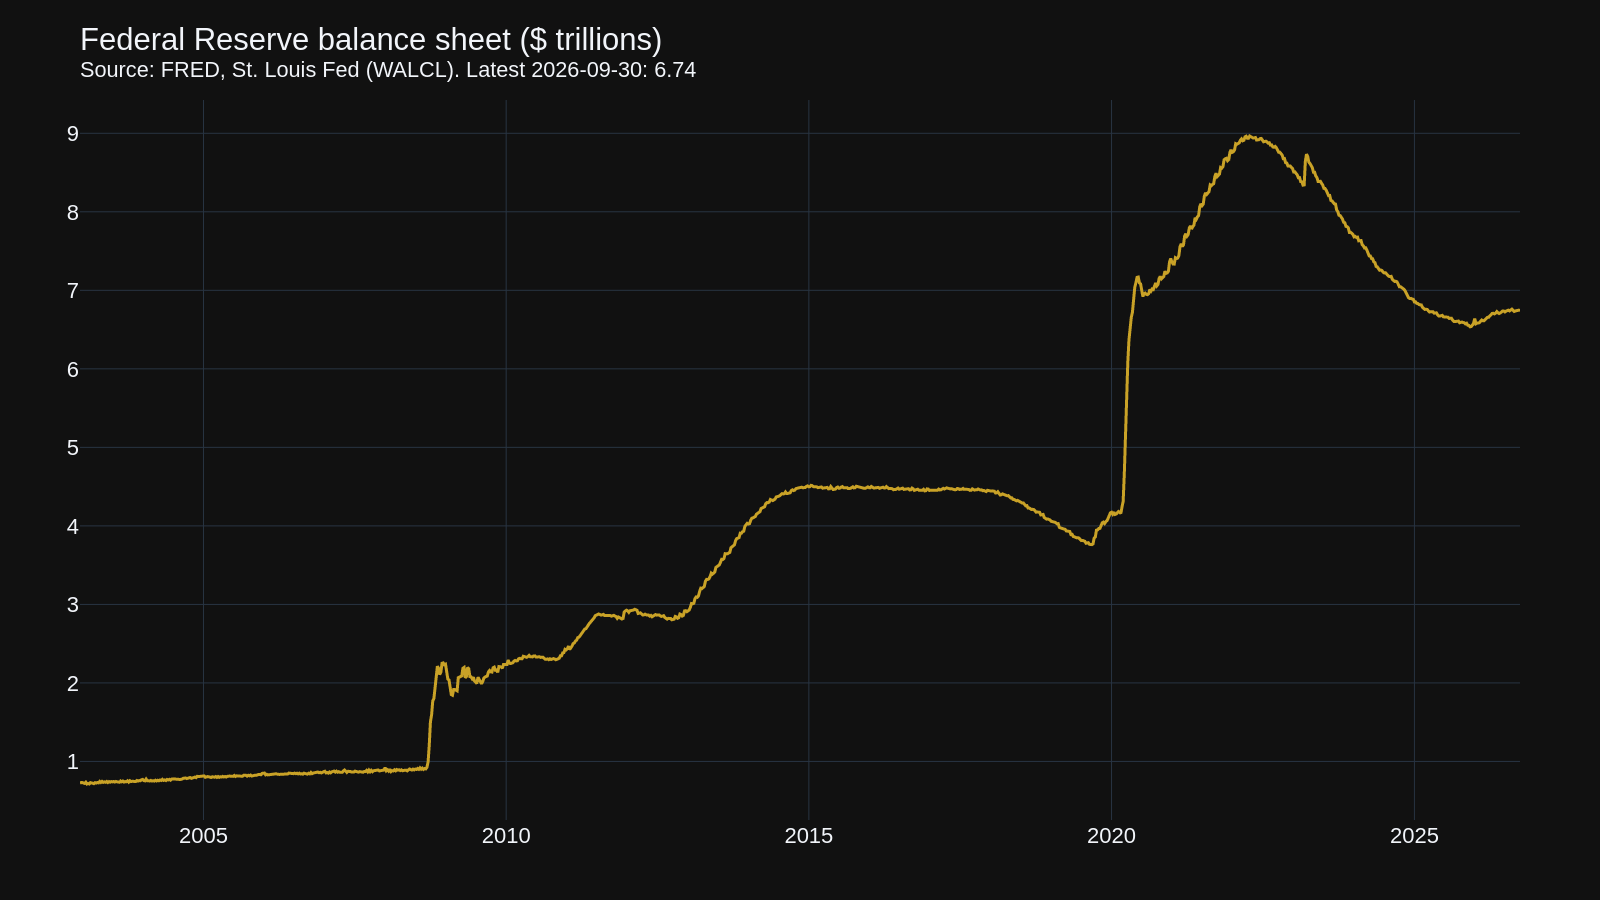
In plain English: the Fed buys government bonds and other assets from banks and pays with money that did not exist the day before. That pushes interest rates down, supports bond prices and floods the system with cash. It stops a credit crisis becoming a collapse, which is why it is done. The side effect is more dollars chasing the same amount of everything else, and things that cannot be printed, such as gold and silver, tend to respond.
If Oracle-style stress spreads, and a large borrower genuinely struggles to refinance, history suggests the Fed steps in again. With $39 trillion of debt to roll, the alternative is hard to stomach.
Gold is the steady one. Silver is the more volatile cousin: it tends to fall harder in a panic and rise harder in a recovery. Flushes like this one have tended to come before money creation, not after. Once leveraged traders and trend funds are out, the remaining holders are the ones who actually want the metal, and there are fewer weak hands left to sell into any rally.
Part 5 · Long-term bonds
The unloved opportunity
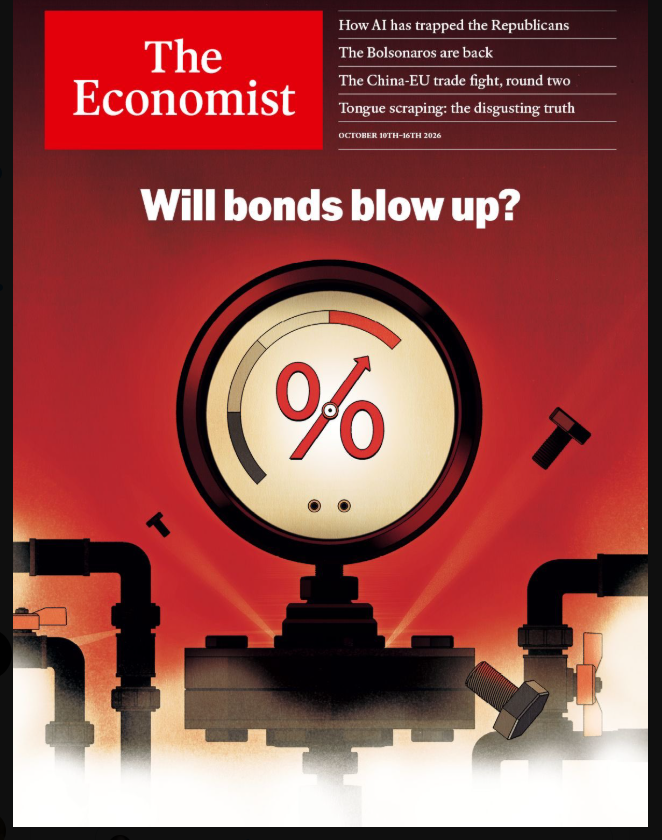
The Economist's cover for 10 to 16 October 2026 asks “Will bonds blow up?”. Jim Bianco's response: “I've been making the case for bonds. If this cover cannot convince you that it's time for bonds, I cannot help you anymore!!” By the time a fear reaches a major magazine cover, many people have usually acted on it already. Covers are not a timing tool, but they are a decent thermometer for how crowded a view has become.
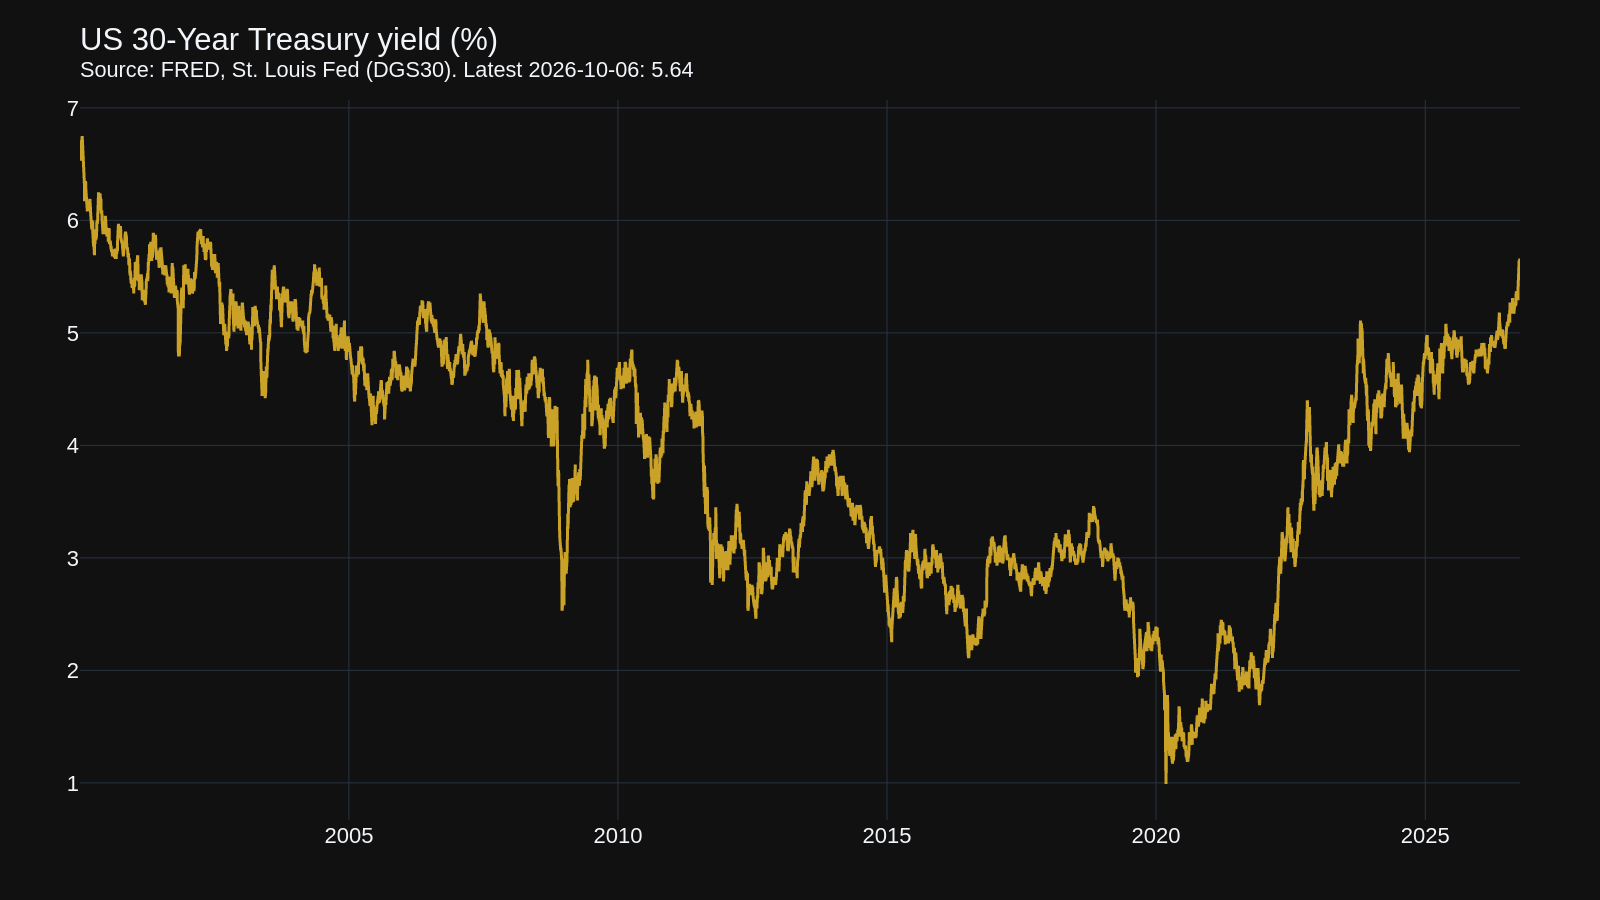
A 30-year US government bond now yields about 5.6%. Bond prices and yields move like a seesaw. As a rough guide (our own calculation for a 30-year bond yielding 5.64%), a 1 percentage point fall in yield would lift the price by about 16%; a 1 point rise would cut it by about 13%.
If credit stress forces the Fed to act, the first thing it usually does is push yields down, which helps long bonds. So silver and long bonds can benefit from the same event through different doors. The risk is serious: if that money creation brings inflation back hard, long bonds get hurt badly, as holders discovered after 2020. Treat them as a measured position with a clear reason, not a bet-the-house idea.
Funds versus single bonds. A single bond repays in full at maturity, so price swings in between need not matter if you hold to the end. A long-bond fund such as TLT never matures; it keeps selling older bonds and buying newer ones, so you get the seesaw without the guaranteed finish line. Neither is better. Know which one you hold.
Part 6 · Position size
Survive the bad scenario first
Silver can fall 30% and recover, or fall 30% and sit there for years. Match any position to your time horizon, avoid leverage on something this volatile, and size it so you can sleep.
An illustration (our own numbers). With £20,000 to invest, a 5% position in silver is £1,000. A 30% fall costs £300, or 1.5% of the total: it stings, but it does not change your life. Put half your savings in and the same fall costs £3,000, which is the kind of loss that makes people sell at the bottom. Some investors also buy in 3 smaller pieces over a few weeks rather than all at once.
What to watch
3 signals for the coming weeks
- The AI bonds. Are the Oracle, SpaceX and Meta data centre bonds steadying or making fresh lows? Lenders tend to see trouble before shareholders. Continued slides mean the stress is spreading.
- The Fed's balance sheet. It sits well below its 2022 peak and has been roughly flat for the past couple of months. A sharp climb would be the lever being pulled, and the moment the story for silver changes.
- Silver itself. Watch whether the selling dries up. When forced sellers are finished, prices often stop falling on bad news. That is usually the first sign the weak hands are out.
Disclaimer
This report is educational research and is not personal financial advice. Felix Nikolas Prehn is not a financial adviser. Figures are drawn from the public sources listed above and were current at the time of writing; prices change daily. Markets carry risk, and past patterns do not guarantee future results. Do your own research and, where appropriate, speak to a qualified professional before making decisions with your money.