
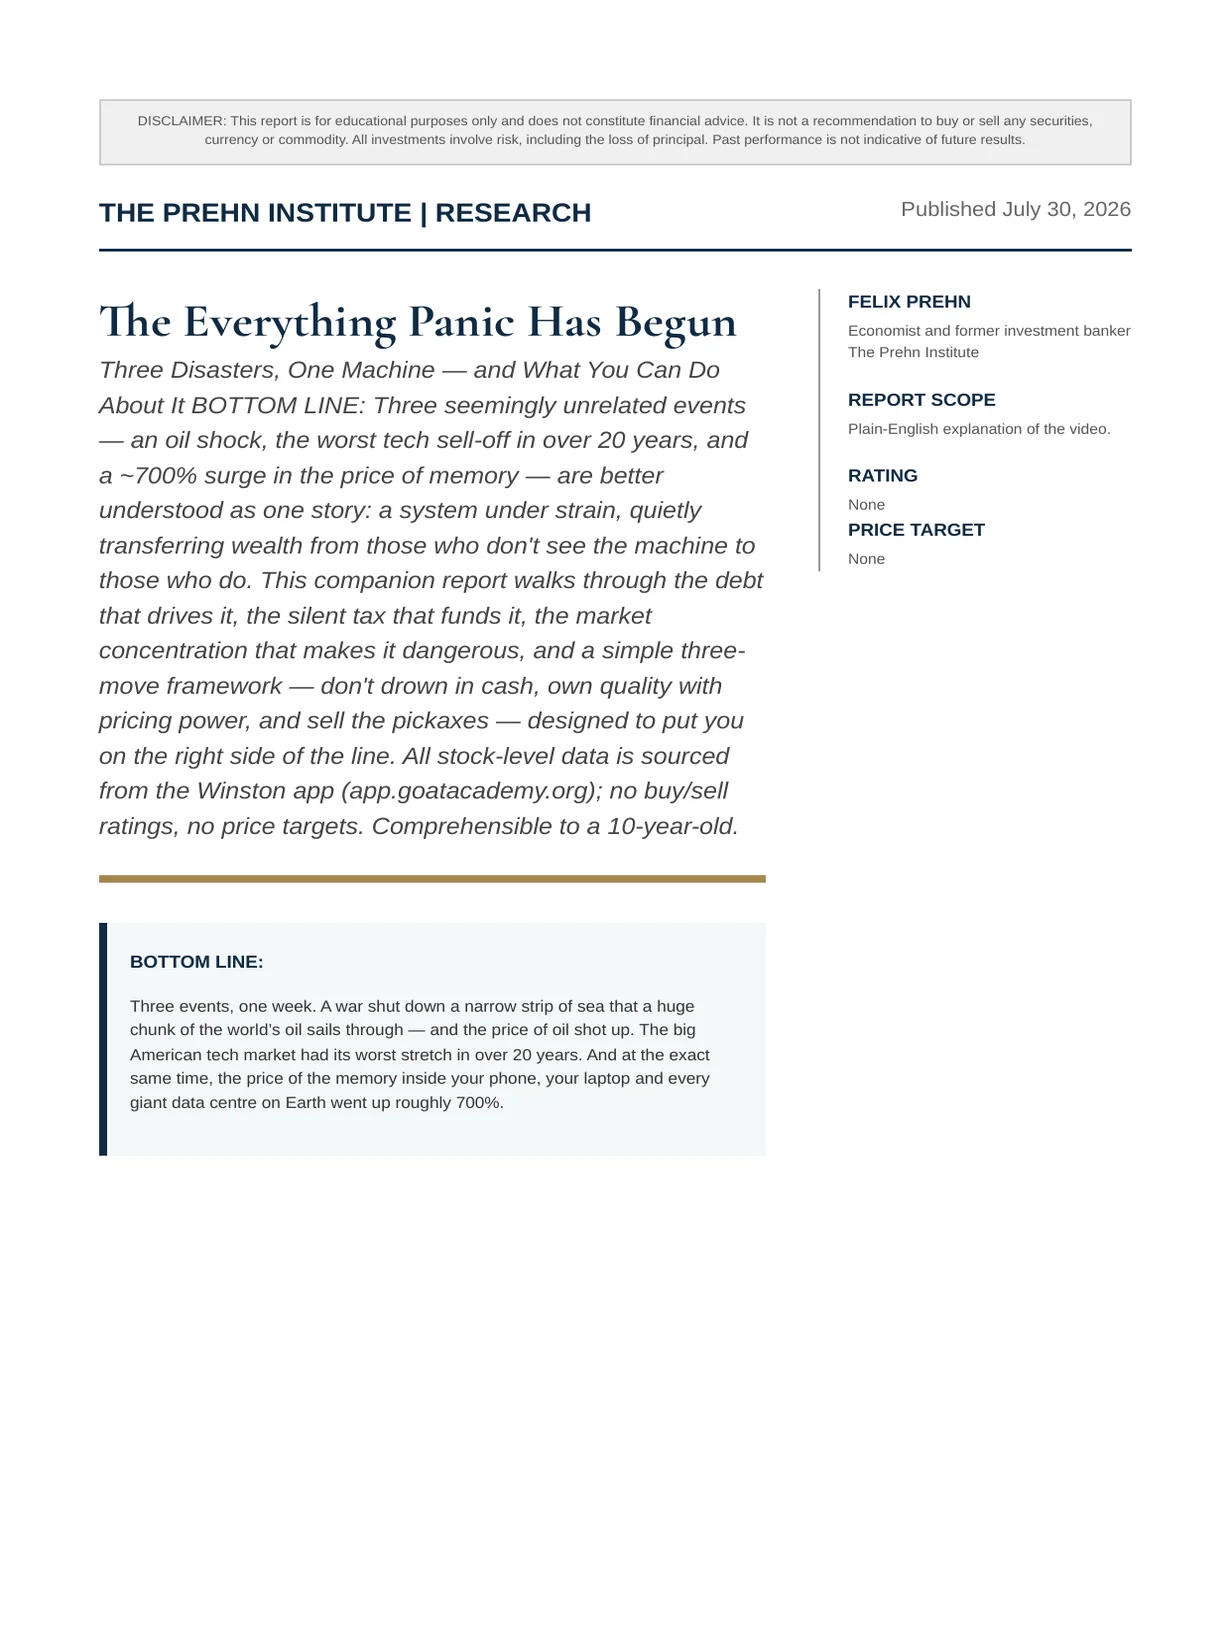
The Everything Panic Has Begun
Three Disasters, One Machine — and What You Can Do About It BOTTOM LINE: Three seemingly unrelated events — an oil shock, the worst tech sell-off in over 20 years, and a ~700% surge in the price of memory
Felix Nikolas Prehn · 30 July 2026 · 26 pages
Bottom line
Three events, one week. A war shut down a narrow strip of sea that a huge chunk of the world’s oil sails through — and the price of oil shot up. The big American tech market had its worst stretch in over 20 years. And at the exact same time, the price of the memory inside your phone, your laptop and every giant data centre on Earth went up roughly 700%.
The Everything Panic · Companion Report
1. Executive Summary
Three events, one week. A war shut down a narrow strip of sea that a huge chunk of the world’s oil sails through — and the price of oil shot up. The big American tech market had its worst stretch in over 20 years. And at the exact same time, the price of the memory inside your phone, your laptop and every giant data centre on Earth went up roughly 700%.
One machine. These are not three separate stories. They are one: a system built on a mountain of government debt, maintained by quietly shrinking the value of your money, and balanced on the narrowest base of crowded stocks in over 30 years. The panic is not a glitch in the system — it is how the system quietly moves money from people who do not understand it to people who do.
The line. There is a single dividing line. On one side sit people whose wealth is mostly in cash and a few popular tech stocks. On the other side sit people who own real things — hard assets, quality businesses with pricing power, and the scarce inputs everybody else has to buy. The companion video asks: which side are you standing on? This report shows you the evidence, the data, and a simple three-move plan.
What this report is NOT. We do not publish price targets, buy/sell ratings, or technical analysis. We do not tell you what to buy. We teach you how the machine works, how to measure business quality using a repeatable checklist, and how to think about positioning — the same way an investment-bank analyst would read the situation, but in plain English a 10-year-old can follow.
In simple terms Three scary things happened at once — expensive oil, crashing tech stocks, and a memory price that shot up 700%. They look like three problems. They’re actually one. This report explains the one machine behind all three, and gives you a simple plan so you come out the other side better off.
The Everything Panic · Companion Report
2. The Government’s Impossible Bill
The number.$40 The number. The US government owes around $40 trillion. If you counted one dollar every second — never sleeping, never stopping — it would take you over a million years to reach a trillion. And they owe forty of them.
The real problem. It is not the debt. It is the interest
- roughly a billion dollars every few hours, just to stand still. That money does not build roads, fund schools, or come back to you. It evaporates — just to keep the government from falling behind on what it already owes.
Three doors. A government with a bill this size has only three exits:
Door 1: Spend less
Politicians won’t — they’d be voted out by lunchtime.
Door 2: Tax people more
Also a wonderful way to get yourself fired.
Door 3: Quietly make each dollar worth a little less
So the giant bill shrinks without anyone actually paying it. They always pick Door 3.
They’ve done it before. After the Second World War, the US owed even more than it does today relative to the size of the economy — debt-to-GDP topped 106% in 1946. They did not pay it back. They kept interest rates low, let the money quietly shrink for about 20 years, and the debt-to-GDP ratio melted from 106% down to about 23% by the mid-1970s. Same playbook. Same quiet trick. Just a different decade.
Add expensive oil. Now drop a war and expensive oil on top. Expensive oil does not politely stay at the petrol station — over the following months it walks into your food, your delivery costs, your rent, nearly everything you buy. No matter what anyone promises about prices coming back down, the real cost of your actual life is heading up.
EXHIBIT 1 — THE POST-WAR DEBT MELT
US federal debt-to-GDP ratio (approximate)
1946 ~106% Mid-1970s ~23%
Source: CEPR / Acalin & Ball (2024), “Reassessing the fall of US public debt after WWII”; IMF Working Paper WP/2024/005. Figures rounded for education.
In simple terms Imagine you owe a thousand sweets. You could eat fewer sweets (no fun), buy fewer sweets (boring), or you could quietly shrink every sweet until a thousand of them is actually a small pile. That’s Door 3. The government always picks Door 3 — and the sweets in your pocket shrink too.
The Everything Panic · Companion Report
3. The Silent Tax Nobody Voted for
Forget the word “inflation” for a second. Inflation is not really “prices going up.” It is your money getting smaller. Same wallet, same notes — buys less stuff. Nobody sent you a letter. There was no vote. That is the silent tax.
What it looks like over one lifetime. A hundred dollars back in 1913 buys what roughly three dollars buys today. The dollar quietly lost around 97% of its purchasing power. The US Bureau of Labor Statistics’ own CPI calculator confirms the figure.
Financial repression. Governments do not just tolerate this — they need it. Economists call it financial repression: keep interest rates below the rate at which money is quietly shrinking, and the giant debt bill melts like an ice-cream in the sun. Your savings are the heat. The more your money shrinks, the smaller their bill gets.
The split. This is the single most important idea in the entire video, and the reason we wrote this report:
Which side of the line are you on?
| The shrinking side (cash & deposits) | The growing side (real things) |
|---|---|
| Savings accounts earning almost nothing | Quality businesses with pricing power |
| Cash sitting idle beyond your emergency cushion | Hard assets: property, gold |
| Index funds crammed into a few crowded names | Scarce inputs everyone must buy (the “pickaxes”) |
| Illustrative educational framework. Not a recommendation. |
EXHIBIT 2 — THE 97% MELT
Purchasing power of $100 (1913 → today)
1913 $100 Today ~$3
Source: US Bureau of Labor Statistics CPI Inflation Calculator (1913–present); confirmed via multiple third-party references. The dollar lost approximately 97% of its purchasing power.
Why it matters right now. If your money is mostly sitting in a bank account and a couple of popular tech stocks, you are on the shrinking side of the line. And the next few weeks are when it gets decided — expensive oil is about to push the real cost of everything you buy even higher, while the cash in your savings quietly melts in the sun.
In simple terms Imagine your lollipop fund had 100 lollipops in 1913. Without anyone stealing a single one, the jar now buys only 3 lollipops. The lollipops got more expensive. Your money got smaller. Nobody asked permission — that’s the silent tax.
The Everything Panic · Companion Report
4. The Crash and the Price-boom — At the Same Time
The paradox. The shares of the companies that make the world’s memory got crushed in a broad sell- off — at the exact same time the price of the product they make surged roughly 700%. That is like a lemonade stand going bankrupt on the hottest day of summer, while lemons cost ten times more. It is not supposed to be possible — and understanding why it happened tells you almost everything about this moment.
Story one: the memory makers. Three companies dominate the manufacture of DRAM — the fast working memory inside phones, laptops and data centres: Samsung, SK Hynix and Micron. The price of their product is up roughly 700% because there simply is not enough to go around. A few years ago, data centres consumed perhaps 20–30% of the world’s memory. Today that share is closer to 70%. The memory in your next laptop is fighting a server rack for the same tiny supply — and the server rack wins.
So why did their stocks fall too? Because when fear takes over a market, everything gets sold at once — the good and the bad together. Scared people do not read the fine print. They sell first and think later. That indiscriminate selling is, historically, precisely where opportunity has appeared for calm, checklist-driven investors.
The Everything Panic · Companion Report
Exhibit 3 — The Paradox, Side by Side
Product price vs. maker share prices
Memory PRICE (1yr) ~+700% Maker SHARES sold off
Story two: the circular money trap. Separately, there is a different company that makes the powerful engines (GPUs) that run those data centres. Different product entirely — not memory. Even the investor who famously called the 2008 crash is now pointing at this one.
The trick, in kid-simple terms. The big tech companies have started lending money to each other. The engine-maker helps fund its own customer’s new data centre — so that customer can turn around and buy more engines. Money running in a circle. It can look like an unstoppable boom — right up until somebody asks, “wait, who is actually paying for all this?” That is when the circle stops. That is a house of cards. And this week, the market just started to sneeze.
The lesson. Do not buy the excitement. Own the toll booth — the thing everybody has to pay to cross, whether the crowd is cheering that company this week or not.
In simple terms Two different things happened at the same time. First, the people who make memory for computers saw the price of their product shoot through the roof — but their shares fell anyway because everyone panicked. Second, a different company that makes the “engines” for data centres got caught in a game where friends were lending money to friends so the friends could buy more engines. Round and round. That’s the circular money trap, and it can snap shut fast.
The Everything Panic · Companion Report
5. Everyone’s Crammed in the Same Few Boats
The most crowded market in 30+ years. The stock market right now is the most concentrated it has been in over three decades. The ten biggest companies account for roughly 38% of the entire S&P 500 — the index that essentially is “the American stock market” for most people. A handful of tech giants alone make up close to a fifth of the whole thing.
Why you should care even if you don’t own
stocks. If you have a pension, a 401(k), a retirement fund, or money in almost any mainstream index tracker, your savings are very likely crammed into those same few boats — whether you chose them or not. When those boats wobble, almost everybody’s retirement wobbles with them.
What the smart money does. When concentration is this extreme, large institutional money quietly rotates out of the crowded names and into safer ground. Gold gets bid up. The world’s most cautious money — central banks, the people who literally print the currency — have been hoarding gold at the fastest pace in decades. They see exactly what you are seeing right now. They are quietly stepping out of the crowded boats.
The emotional trap. When regular investors do not have a plan, they do one of two things: panic-sell right at the bottom, or freeze and do nothing while the smart money quietly scoops up all the bargains. Either way, they end up on the losing side. The three- move framework in the next section exists precisely to stop that from happening to you.
EXHIBIT 4 — HOW CROWDED IS THE MARKET?
S&P 500 concentration (approximate, July 2026)
Top 10 companies ~38% The other 490 ~62%
Source: RBC Wealth Management, “The Great Narrowing” (2026); J.P. Morgan Asset Management, “How extreme is market concentration?” (2026); BofA/Merrill data (most concentrated since before 1990). Figures rounded.
In simple terms Imagine a school bus with 500 kids. 10 of them are carrying almost 40% of all the lunch money. If those 10 kids trip, nearly half the bus’s lunch money goes flying — even though the other 490 kids are walking just fine. That’s how concentrated the stock market is right now. Almost everyone’s retirement is on that bus.
The Everything Panic · Companion Report
6. The Three-move Framework
Seeing the machine is useless unless you know what to do. The companion video distils the response into three simple moves. This section provides the reasoning behind each one, with the data trail.
The Everything Panic · Companion Report
Move 1 — Don’t Drown in Cash
Keep a cushion. Three to six months of your hard bills, so a surprise never forces you to sell anything at the wrong moment. That is sensible and we do not argue with it.
Beyond the cushion — the slow leak. Money parked in a savings account earning almost nothing while its purchasing power quietly shrinks a few percent a year is an ice cube on a hot counter. Looks perfectly safe. Quietly disappears. And the counter just got a lot hotter.
The trap. Sitting in cash feels like doing nothing risky. But the world gets more expensive around you every single year. The 97% melt in Exhibit 2 is not ancient history; it is the same process, still running, right now. Cash is not safety. It is a slow leak you do not feel until you reach for it.
MOVE 2 — OWN THINGS THAT GO UP WHEN THE DOLLAR GOES DOWN
Two kinds of things do this.hard assets Two kinds of things do this. First, hard assets: good property, and gold. Gold does not need a balance sheet, cannot go bankrupt, and has been money for 5,000 years. Central banks are buying it at the fastest pace in decades — they see what you are seeing.
Second, quality companies with pricing power. “Pricing power” means a company can raise its prices
- and you keep buying anyway, without even thinking about it. A company with pricing power eats inflation for breakfast instead of getting eaten by it. A famous example: during a recent inflationary stretch, one giant snack-and-soda company pushed prices up about 17% — and its profits actually went up, because customers just shrugged and kept buying.
of 10 — the “castle wall” competitors cannot cross. Then he checks that the company generates real cash, that the balance sheet is healthy, and sorts by the highest quality score. It works for American, European and Australian stocks — wherever you invest. And his golden rule: if you cannot explain what a company does, and why it makes money, to a 12- year-old — you probably should not own it.
MOVE 3 — SELL THE PICKAXES
The gold-rush analogy. In the gold rush, the people who reliably got rich were not the ones frantically digging for gold. It was the ones selling pickaxes and shovels to every digger — win or lose, they all needed a shovel.
The modern pickaxes. Today’s pickaxes are the plumbing: payment rails, exchanges, custody companies — the boring toll booths the whole financial system has to drive through. And the ultimate pickaxe right now? Whoever owns the genuinely scarce thing the entire tech buildout is desperate for and cannot get enough of — like that memory whose price is up 700%.
The principle. You do not need to pick the winner of the hype race. You just need to own the toll booth every racer has to drive through. The next section applies that idea to the memory makers with real data.
In simple terms
Move 1:Move 2: Move 1: Don’t leave too much money sitting doing nothing — it melts quietly. Move 2: Own things that get more valuable when money shrinks — good businesses with pricing power, gold, property. Move 3: Don’t guess the winner — own the thing every competitor has to buy, like the shovels in a gold rush.
The Everything Panic · Companion Report
7. The Memory Super-cycle: A Worked Example
DRAM vs NAND — the one-minute version. DRAM is the fast, temporary working memory a computer uses while it is thinking — and it forgets everything the moment the power goes off. NAND flash is the longer-term storage that remembers your files after shutdown. DRAM is the product at the white-hot centre of the current shortage; NAND typically carries thinner margins.
Micron Technology (MU). Of the three dominant memory makers, Micron is the most straightforward for a Western investor to study: a large, US-listed, pure-play memory company. Samsung is a sprawling conglomerate (phones, displays, appliances); SK hynix trades primarily on its home exchange. If you want to understand the memory cycle through one clean lens, Micron is it.
The one-sentence business model. Micron spends heavily up front to build extraordinarily advanced factories, then earns its return by producing memory at scale more cheaply than almost anyone else on Earth. When memory is scarce, that scale becomes a money machine; when memory is abundant, margins compress.
MICRON AT A GLANCE (WINSTON APP, QUALITY METRICS)
Winston Quality Score High-quality band
- ~73%
- Gross Margin Up from high-30s a year ago
- ~29%
- Levered FCF Margin Strong cash generation
- ~44%
- Return on Invested Capital Efficient use of capital
- 1.33x
- Financial Leverage Low = safer balance sheet
Very high
Interest Cover Comfortably services debt
Source: Winston app, data as of 28 July 2026. No price targets or ratings implied. Figures rounded.
EXHIBIT 5 — MICRON’S QUALITY PILLARS
Profitable Generating cash Financially stable Valuation Moat
Source: Winston app, 28 July 2026. Pillars sum to 82/100.
The Everything Panic · Companion Report
Exhibit 6 — Gross Margin Expansion (Recent Quarters)
Micron gross margin, trailing quarters (Winston app)
~38% ~45% ~56% ~74% ~85%
Source: Winston app, quarterly data through the quarter ended May 2026. Rounded. Near a cyclical high; not a forecast.
Q3 Fy26
Exhibit 7 — Peer Comparison (Winston App Quality Metrics)
| Company | Score | Gross margin | FCF margin | Leverage | Int. cover | Moat |
|---|---|---|---|---|---|---|
| Micron (MU) — DRAM/NAND | 82 | ~73% | ~29% | 1.33x | ~258x | 10/10 |
| SK hynix — DRAM/NAND | ~68% | ~31% 1.36x ~93x | ||||
| Samsung Elec. — memory + conglomerate | ~47% | ~14% 1.34x ~133x | ||||
| Sandisk (SNDK) — NAND/storage | ~56% | ~34% 1.24x ~44x | ||||
| Seagate (STX) — storage | ~42% | ~24% 8.12x ~11x | ||||
| Western Digital — storage | ~45% | ~25% 1.55x ~16x | ||||
| Source: Winston app (app.goatacademy.org), data 28–29 July 2026. Leverage = financial leverage (assets/equity); higher is riskier. | ||||||
| Educational only; no ratings or targets. |
Reading the table. The two pure-play DRAM makers (Micron and SK hynix) combine the highest margins with low leverage and very high interest cover — the profile of businesses that can weather the cycle. Samsung offers safety with lower margins because memory is only part of a conglomerate. Among the storage names, Sandisk screens best on quality and safety, while Seagate’s leverage of 8.1x is the clearest single risk flag — same theme, very different balance-sheet risk.
The moat. Only three companies can make advanced DRAM at scale; factories cost tens of billions and take years. That is a genuine size/cost moat. It does not repeal the cycle — memory is famously boom-and-bust — but it protects who earns the industry’s profits when the cycle is running.
In simple terms Micron and SK hynix are the strongest swimmers in the pool — and they are swimming in a pool where almost nobody else is allowed. But the pool fills and drains in big waves, so even a great swimmer can get dunked if they jump in at the very top of a wave.
The Everything Panic · Companion Report
8. Felix’s Quality Checklist
The philosophy. “We look neither for value stocks, nor for growth stocks. We look for quality stocks.” — Felix. A quality business is profitable, generates real cash, is financially stable, is reasonably valued, and
- above all — has a moat. These two tables are Felix’s complete rules, reproduced for education. Use them on any stock you are considering — not just the memory makers.
The Everything Panic · Companion Report
Felix’s Rules for Picking Great (Quality) Stocks
Is the business profitable?
Gross Margin
Indicates the size of the moat. Reveals core efficiency and its ability to absorb shocks.
Operating Margin Reveals profitability after all operational costs. A good measure of cost control.
ROCE / ROIC
Reveals the return to all financial stakeholders (equity and debt). A good measure of management effectiveness.
Is it generating cash?
Cash conversion Ability to convert profits into cash. A good measure of efficiency and flexibility.
| Levered Free Cash Flow Margin | Reveals what portion of sales ends up as cash. |
|---|---|
| Is it financially stable? | |
| Leverage | A measure of financial risk. Tells a story about the volatility of returns. |
| Interest cover | |
| Degree of financial comfort regarding debt. A high ratio suggests stability and | |
| flexibility. | |
| Valuation | |
| P/E + Forward P/E | |
| Short-term valuation snapshot plus a forward-looking view. This is the least | |
| important of our metrics. | |
| Consistent earnings growth? | Shows whether management and the business are reliable or cyclical. |
| EPS increasing consistently? | Reveals whether shareholder value is increasing or being diluted. |
| Moat (competitive advantage) | |
| A unique edge competitors cannot easily cross. It comes in the following forms: cost advantage; size advantage | |
| (economies of scale); high switching costs; and patents, brand or government licences. | |
| Framework: The Prehn Institute “How to Pick Great Stocks.” Reproduced for education. |
FELIX’S ADDITIONAL RULES FOR GROWTH STOCKS
| Additional criteria for growth stocks | |
|---|---|
| The same valuation method applies. Growth stocks are more challenging and riskier to pick because we have less data, and they need a longer time horizon to judge success. | |
| Focus on the metrics that are available | |
| High operating margin | Proof the model works as it scales. |
| Strong revenue growth | It is a growth company — it must beat others in the sector. |
| Low debt | Survive a downturn without being forced to raise money badly. |
| Good cash position | Enough cash to survive a crash. |
| Large target market (25x TAM+) | Room to grow many times over. |
| Strong, clean brand | Trust and pricing power. |
| Tech leadership | Ahead of rivals on the thing that matters. |
| High R&D spend | Building a moat for tomorrow. |
| CEO / founder heavily invested | |
| Skin in the game aligns management with shareholders (classic examples: Tesla, Square, Spotify, MercadoLibre, AMD). | |
| Fully understand the business model | |
| Can you write down three reasons this company is better than its competitors? If not, you do not understand it well enough to | |
| own it. | |
| Framework: The Prehn Institute growth-stock rules. Reproduced for education. |
In simple terms The quality checklist is like a coach’s clipboard before picking a player: Is she strong? Fast? Reliable? Hard to replace? And does she actually have cash in the bank? Any stock you are thinking about — not just the ones in this report — should be run through these same questions.
The Everything Panic · Companion Report
9. Risk Factors
- Cash is not risk-free. The biggest risk for most people is the one they do not feel: the slow, silent erosion of purchasing power while sitting in cash. Paradoxically, “doing nothing” is itself a position — and in an inflationary world, it is the position that quietly loses.
- The cycle turns. Memory is historically boom-and- bust. Today’s ~700% price surge and ~85% peak gross margins are almost certainly nearer a cyclical high than a new normal. High prices invite new supply; new supply eventually crushes prices and margins. An investor who buys the theme at the top and forgets the cycle can lose money even in a great business.
- Market concentration. When the ten largest companies are ~38% of the index — the most crowded in over 30 years — a rotation out of those names can drag down almost everyone’s index funds, including quality names that have nothing wrong with them. Concentration cuts both ways.
- The circular money trap. Vendor-style financing among the largest tech companies — where a supplier helps fund a customer who then buys more from that supplier — can flatter demand until someone asks who is really paying. This is a risk to sentiment across the whole tech complex, memory included, even though the memory makers are a different story.
- Geopolitics & energy. Two of the three memory makers are Asia-based. Trade restrictions, export controls and currency swings can all affect results. Meanwhile, expensive oil feeds directly into transport, food and rent, potentially tightening consumers and company margins alike.
- Single-stock risk. Any one company can disappoint for reasons no checklist fully anticipates. That is the core argument for the diversified ETF route in Section 11.
- Timing risk. Seeing the machine does not mean you can time the machine. Every move in the framework is about positioning, not prediction. The best-quality business bought at the absolute worst moment can still lose money in the short term.
In simple terms The biggest risk isn’t a crash — it’s doing nothing and not realising your money is slowly shrinking. But the second- biggest risk is assuming that just because a business is good, its share price cannot fall. It can. Good businesses reduce risk; they do not remove it.
10. OPPORTUNITIES
- The panic IS the opportunity. Broad, fear-driven sell-offs do not discriminate between good and bad businesses. For a patient investor with a checklist, that indiscriminate selling is precisely where opportunity has historically appeared — not as a timing call, but as a reminder to judge businesses by their fundamentals rather than by the mood of the tape.
- Own the scarce input (“the toll booth”). The video’s central idea: own the thing everyone in a boom must buy, rather than guessing the single winner of the hype race. Memory is exactly that kind of input right now — the data-centre build-out cannot proceed without it, and only three companies make it at scale.
- Pricing power in an inflationary world. Companies with real moats can raise prices without losing customers. When the silent tax is running, pricing power is the difference between a company that eats inflation and one that gets eaten by it.
- Hard assets as ballast. Gold, property, and quality businesses with pricing power tend to hold value or appreciate when cash is quietly losing value. Central banks are voting with their vaults — buying gold at the fastest pace in decades.
- Balance-sheet quality into a downturn. Low- debt, high-cash companies can keep investing — and potentially gain share — when weaker competitors are forced to retrench. In cyclicals especially, the strong balance sheet is often the real long-term edge.
In simple terms In a gold rush, the surest money was made selling shovels to every miner — win or lose, they all needed a shovel. Memory is one of today’s shovels. And a panic is when the shovels go on sale.
The Everything Panic · Companion Report
11. Lower-risk Exposure: Sector ETFs
Why an ETF. A single stock — however high its quality score — carries company-specific risk. An ETF spreads your money across many companies in a theme, which lowers the risk that any single name sinks the whole position. For readers who like the memory/semiconductor theme but do not want to bet on one company, a broad sector ETF is the classic lower-risk route.
The trade-off. A fund dilutes the upside of any single winner just as it cushions the downside of any single loser. An ETF also still carries full sector risk — if the whole semiconductor cycle turns down, a semiconductor ETF falls with it. It reduces single- stock risk, not market or sector risk.
The Everything Panic · Companion Report
Exhibit 8 — Two Semiconductor Sector ETFs (Illustrative)
| Ticker | Fund | What it holds & why we chose it |
|---|---|---|
| SOXX | iShares Semiconductor ETF | A broad basket of US-listed semiconductor companies — designers, manufacturers and equipment makers. Gives diversified exposure to the whole chip complex, including memory, in one holding. |
| SMH | VanEck Semiconductor ETF | |
| Another widely-held semiconductor fund tracking a basket of the | ||
| largest chip companies. Similar theme, different index methodology | ||
| and weighting. | ||
| ETFs selected by The Prehn Institute for illustration. Not a recommendation. Always check the fund’s current factsheet for live holdings, | ||
| weightings and fees. |
How to think about fit. A pure memory maker is a concentrated way to express the specific view that memory is scarce and its makers are high quality. A semiconductor ETF is a broader, gentler way to express the view that the whole computing build-out continues. The right choice depends entirely on your goals, time horizon and tolerance for risk — a conversation to have with a licensed adviser, not a report.
In simple terms Buying one stock is like picking one player for your team. Buying an ETF is like drafting the whole squad — if one player has an off day, the others can carry the game.
Disclaimer
Scope & limits. This report deliberately contains no technical analysis, no price targets and no buy/sell ratings. It is educational. The three-move framework is a teaching tool, not a personal financial plan.