
The Drone War Economy
A three-month fundamental snapshot of five U.S. drone and defense-technology companies — and the lower-risk ETFs that hold the whole battlefield.
Felix Nikolas Prehn · 23 July 2026 · 22 pages
Bottom line
Drones have moved from a niche gadget to a core part of how modern militaries and industries operate. The war in Ukraine, rising defense budgets across NATO, and new U.S. rules that push buyers away from Chinese-made drones have created a powerful, multi- year demand story. We expect this demand to keep growing.
Overview
CONTENTS
Executive Summary — The Bottom Line
- Why Drones, Why Now: The Industry Thesis
- How This Theme Makes Money: The Three-Wave Framework
- How We Judge a Company: Felix's Quality-Stock Rules
- The Group at a Glance: Side-by-Side Scorecard
- Company Analysis: Ondas Holdings (ONDS)
- Company Analysis: Unusual Machines (UMAC)
- Company Analysis: Kratos Defense & Security (KTOS)
- Company Analysis: Red Cat Holdings (RCAT)
- Company Analysis: AeroVironment (AVAV)
- Lower-Risk Exposure: Three Defense & Aerospace ETFs
- Rules for Growth Stocks: The Higher-Risk Playbook
- Risks and Opportunities
- Conclusion
- Glossary of Key Terms
- Methodology and Data Notes
- Citations and Sources
- About Felix Prehn and The Prehn Institute
Contents
The Drone War Economy
Five small-cap drone names, one giant tailwind, and the boring ETFs that let you sleep at night.
BOTTOM LINE
Drones have moved from a niche gadget to a core part of how modern militaries and industries operate. The war in Ukraine, rising defense budgets across NATO, and new U.S. rules that push buyers away from Chinese-made drones have created a powerful, multi- year demand story. We expect this demand to keep growing.
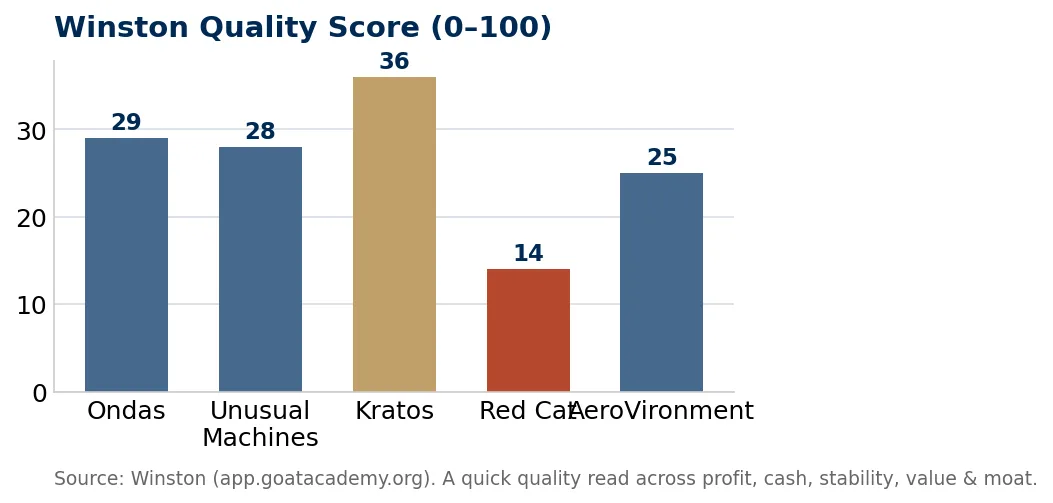
But a great story is not the same as a great business. Our analysis of the five companies in this report — Ondas (ONDS), Unusual Machines (UMAC), Kratos (KTOS), Red Cat (RCAT), and AeroVironment (AVAV) — shows a group that is growing revenue very fast but is, almost without exception, still burning cash and not yet reliably profitable. These are early-stage growth stories, not steady compounders. On The Prehn Institute's 0–100 quality score, the group ranges from just 14 (RCAT) to 36 (KTOS) — all well below what we would call "high quality."
For readers who like the theme but not the white-knuckle volatility of single small-caps, we highlight three aerospace & defense ETFs (SHLD, ITA, XAR) that spread risk across dozens of established, profitable defense giants while still capturing the same tailwind.
1. WHY DRONES, WHY NOW
The shift from "nice-to-have" to "must-have." For decades, air power meant expensive jets and helicopters flown by highly trained pilots. Uncrewed systems — drones — have changed the math. A small drone can scout, strike, or jam an enemy at a tiny fraction of the cost of a manned aircraft, and no pilot is put at risk. We believe this cost-and-risk advantage is the single most important reason the drone theme is durable rather than a passing fad.
Three tailwinds at once. Our analysis suggests three forces are pushing in the same direction. First, the war in Ukraine has become a live laboratory showing that cheap drones can destroy expensive tanks and ships. Second, NATO members are raising defense spending toward and beyond 2% of GDP, with drones a priority category. Third, U.S. policy — through programs like "Blue UAS" and restrictions on Chinese-made drones from market leader DJI — is deliberately steering government dollars toward domestic suppliers.
The China angle matters most for small caps. China's DJI dominates the world commercial drone market. As the U.S. government restricts Chinese drones on security grounds, a protected home market opens up for American makers. Several companies in this report — especially Unusual Machines and Red Cat — are positioning themselves explicitly as the "made-in- America" alternative. We view this as the clearest opportunity and a key risk: the thesis depends heavily on policy staying friendly.
2. THE THREE-WAVE FRAMEWORK
To make sense of a crowded field, we group drone-economy companies into three "waves" based on where they sit in the value chain. This is our framework, designed to help a newcomer see the forest, not just the trees.
Wave 1 — The Platform Makers. Companies that build the actual drones and uncrewed systems. In this report: AeroVironment (AVAV), Red Cat (RCAT), and Kratos (KTOS, which builds jet- powered target and combat drones). They win the biggest headline contracts but also carry the heaviest manufacturing costs.
Wave 2 — The Parts & Guts. Companies that supply the motors, propellers, cameras, radios, and software inside the drones. In this report: Unusual Machines (UMAC), which sells components, and Ondas (ONDS), which supplies drone platforms plus the wireless networks and autonomous systems that connect them.
Wave 3 — The Whole Battlefield. Diversified defense and aerospace ETFs that own the giants (RTX, Lockheed, General Dynamics, Palantir) alongside the up-and-comers. This is the lower-risk way to own the theme, covered in Section 10.
| work, and Wave 3 is buying a share of the whole league so you win no and has a "moat" — a durable edge over rivals. We score every matter which team is best. company against this checklist. The full framework is reproduced in the table on the next page. 3. HOW WE JUDGE A COMPANY We flag an important reality up front: most of the companies in this report do not yet pass the quality test. They are young, Quality over hype. As Felix says, "We look neither for value fast-growing, and cash-hungry. That does not make them bad — it stocks, nor for growth stocks. We look for quality stocks." A quality makes them higher-risk growth stories that must be judged by a business is profitable, generates real cash, is financially stable, second, separate set of rules (Section 11). Table 1. Felix's "How to Pick Great Stocks" framework — the quality checklist we apply to every company. | |
|---|---|
| What we check | Why it matters |
| Is the business profitable? | |
| Gross Margin | Indicates the size of the moat. Reveals core efficiency and its ability to absorb shocks. |
| Operating Margin Reveals profitability after all operational costs. A good measure of cost control. | |
| ROCE (Return on Capital Employed) | Reveals the return to all financial stakeholders (equity and debt). A good measure of management effectiveness. |
| Is it generating cash? | |
| Cash conversion | Ability to convert profits into cash. A good measure of efficiency and flexibility. |
| Leveraged Free Cash Flow Margin Reveals what portion of sales ends up as cash. | |
| Is it financially stable? | |
| Leverage A measure of financial risk. Tells a story about the volatility of returns. | |
| Interest cover | Degree of financial comfort regarding debt. A high ratio suggests financial stability and flexibility. |
| Valuation | |
| P/E Ratio + Forward P/E Ratio | Short-term valuation snapshot plus a forward-looking prediction. This is the least important of our metrics. |
| Is earnings growth consistent? Shows whether management and the business are reliable or cyclical. | |
| Are EPS increasing consistently? | Reveals whether shareholder value is increasing or being diluted. |
| MOAT — the competitive advantage. A unique edge over competitors, in the form of: | |
| Cost advantage | The ability to produce more cheaply than rivals. |
| Size advantage Economies of scale that smaller rivals cannot match. | |
| High switching cost | Customers find it painful or expensive to leave. |
| Patents, brand, government licenses Legal or reputational barriers that keep competitors out. | |
| 4. THE GROUP AT A GLANCE | |
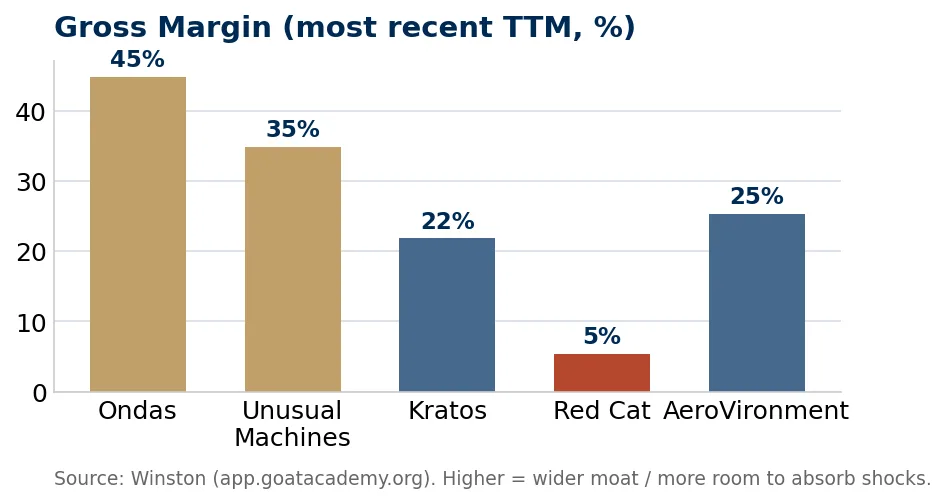
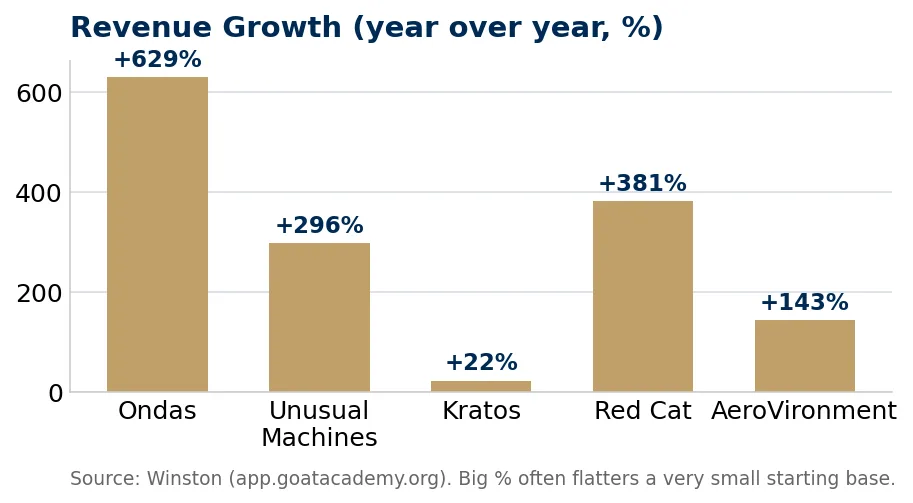
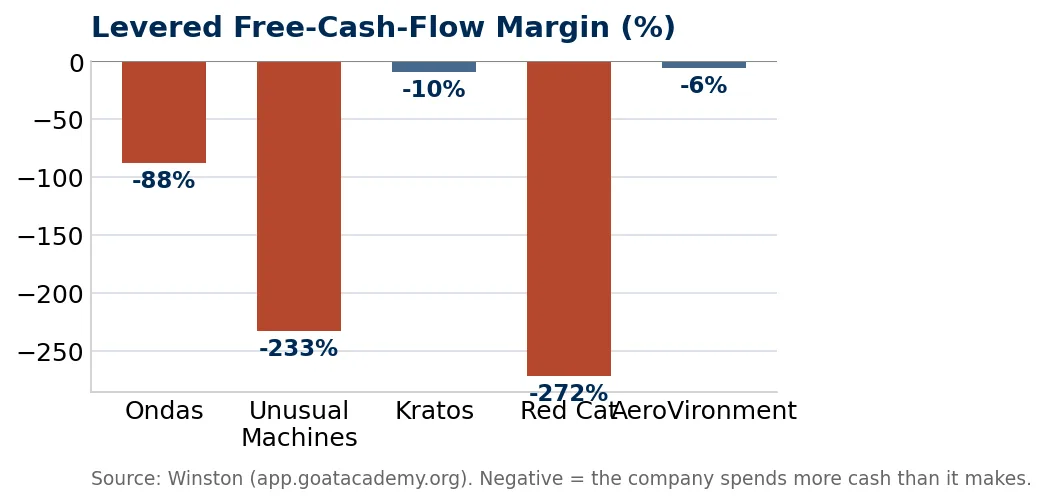
| The table below summarizes the five companies on the metrics Felix prioritizes: gross margin, free cash flow, debt/stability, and valuation. All figures are from the Winston app (app.goatacademy.org) and reflect each company's most recent reported quarter and trailing data. Green- light quality is rare here; the group is defined by very high revenue growth paired with negative free cash flow. |
| Table 2. Side-by-side scorecard. GM = gross margin; Lev. FCF margin = leveraged free cash flow margin; Fin. leverage = assets/equity; Int. cover = interest coverage; GOAT Score = The Prehn Institute 0–100 quality score. n/m = not meaningful. | ||||||||||
|---|---|---|---|---|---|---|---|---|---|---|
| Company (Ticker) | Sector / Industry | GM % | Lev. FCF margin % | Fin. leverage | Int. cover | P/E | Fwd P/E | Rev. growth % | Market cap | GOAT Score |
| Kratos (KTOS) Industrials / Aero & 21.8 -9.5 1.19 4.8 277.0 39.8 +21.9 $8.63B 36 Defense | ||||||||||
| Ondas (ONDS) | Technology / Comm. Equip. | 44.8 | -88.3 | 2.28 | n/m | 40.7 | n/a | +629.3 | $3.46B | 29 |
| Unusual Machines Technology / Drones 34.8 -232.8 1.02 n/m n/a n/a +296.4 $570M 28 (UMAC) & Parts | ||||||||||
| AeroVironment (AVAV) | Industrials / Aero & Defense | 25.3 | -6.2 | 1.30 | n/m | n/a | 26.5 | +143.4 | $7.22B | 25 |
| Red Cat (RCAT) Technology / 5.4 -271.5 1.18 0.0 n/a 86.1 +380.7 $824M 14 Computer HW | ||||||||||
| Exhibit 1. Gross profit margin by company. Ondas leads on margin; Red Cat's razor-thin margin flags a business still far from profitability. Source: Winston app (app.goatacademy.org). |
| THE PREHN INSTITUTE | RESEARCH July 23, 2026 | ||||
|---|---|---|---|---|
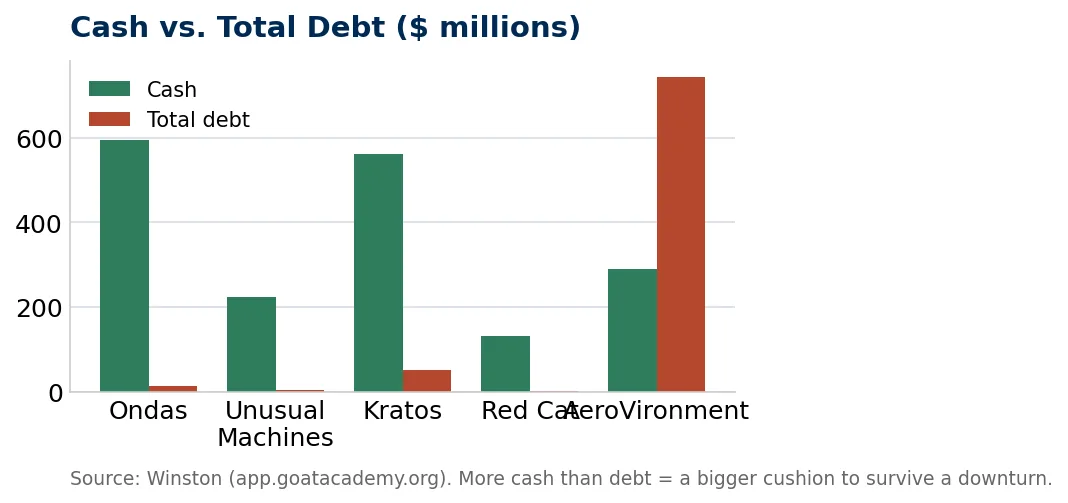
| healthy 49.2%, the best in our coverage group. We caution readers that the reported net income of +$362.9M was not 5. ONDAS HOLDINGS (ONDS) operating profit: it was driven by non-cash accounting items (changes in the fair value of warrant liabilities). Operating income What it does. Ondas is a technology company with two arms: was negative at roughly -$42.7M, and leveraged free cash flow Ondas Networks, which builds specialized industrial wireless margin was about -105%. The business still spends far more cash radios, and Ondas Autonomous Systems, which sells drone than it takes in. platforms (such as the Optimus and Iron Drone systems) for security, defense, and infrastructure inspection. In our Three-Wave Balance sheet. The good news is a large cash pile: about $1.5B framework it straddles Wave 2 (the connective tissue) and Wave 1 in cash and equivalents against only ~$4.4M of debt at quarter- (platforms). end, following significant capital raises. This gives Ondas a long runway to fund losses — but those raises also dilute existing In plain English: Ondas makes flying robots that guard places and shareholders, which is a cost investors should not ignore. inspect things, plus the special radios that let machines talk to each other. Quality read. Ondas scores 29 on the The Prehn Institute scale. Strong gross margin and a fortress cash position are offset by The quarter. In the quarter ended March 31, 2026, Ondas deep cash burn, high financial leverage (2.28x) and inconsistent reported revenue of roughly $50.1M — a very large jump off a tiny earnings. We view ONDS as a high-risk, story-driven growth name prior-year base, which is why its year-over-year growth screens at whose success depends on converting a growing order book into an eye-watering +629%. Gross margin for the quarter was a sustained, cash-generative revenue. Table 3. Ondas Holdings — recent quarterly trend. Source: Winston app (app.goatacademy.org). | ||||
| Quarter (period end) | Revenue | Gross margin % | Lev. FCF margin % | EPS ($) |
| Q1 FY2026 (Mar 31, 2026) $50.1M 49.2 -105.0 0.58* | ||||
| Q4 FY2025 (Dec 31, 2025) | $30.1M | 42.3 | -43.2 | -0.27 |
| Q3 FY2025 (Sep 30, 2025) $10.1M 25.8 -110.4 -0.03 | ||||
| Q2 FY2025 (Jun 30, 2025) | $6.3M | 53.1 | -135.7 | -0.08 |
| *Q1 FY2026 EPS reflects large non-operating, non-cash gains (warrant fair-value changes), not operating profitability. Operating income was negative in the quarter. |
| THE PREHN INSTITUTE | RESEARCH July 23, 2026 | ||||
|---|---|---|---|---|
| with Ondas, the reported positive net income for the quarter was driven by non-operating items rather than the core business, which 6. UNUSUAL MACHINES (UMAC) remains unprofitable. Leveraged free cash flow margin was deeply negative (around -224%), reflecting heavy investment to scale up What it does. Unusual Machines makes small drones and drone manufacturing. parts — motors, propellers, cameras and ready-to-fly aircraft — sold to hobbyists, commercial operators and government buyers. Balance sheet. UMAC holds roughly $222.9M in cash against just Its central pitch is to be the domestic, American-made alternative $3.3M of debt — the lowest financial leverage in our group at to Chinese market leader DJI. This is a Wave 2 (parts & guts) 1.02x. Notably, insiders own about 12.2% of the company, which business. we view positively: management has real money at stake. The challenge is scale — at only ~$8M of quarterly revenue, the In plain English: they sell the engines, propellers and cameras that go company must grow into its ~$570M market value. inside drones, and market themselves as the American choice instead of the Chinese one. Quality read. UMAC scores 28. The near debt-free balance sheet, decent gross margin and meaningful insider ownership are The quarter. In the quarter ended March 31, 2026, Unusual genuine positives; the negatives are its tiny revenue base, heavy Machines reported revenue of about $8.1M with a gross margin of cash burn and dependence on U.S. policy continuing to favor 32.8%. Year-over-year revenue growth is very strong at +296%. As domestic drone makers. Table 4. Unusual Machines — recent quarterly trend. Source: Winston app (app.goatacademy.org). | ||||
| Quarter (period end) | Revenue | Gross margin % | Lev. FCF margin % | EPS ($) |
| Q1 FY2026 (Mar 31, 2026) $8.1M 32.8 -223.7 0.22* | ||||
| Q4 FY2025 (Dec 31, 2025) | $4.9M | 36.2 | -210.2 | -0.35 |
| Q3 FY2025 (Sep 30, 2025) $2.1M 39.4 -413.2 0.05 | ||||
| *Q1 FY2026 EPS reflects non-operating items; the core operating business was not yet profitable. |
| THE PREHN INSTITUTE | RESEARCH July 23, 2026 | ||||
|---|---|---|---|---|
| slower growth than the micro-caps, but off a much larger, more stable base. Gross margin was 22.6%. Crucially, Kratos is the only 7. KRATOS DEFENSE & SECURITY (KTOS) company in our group with a positive, meaningful interest- coverage ratio (about 4.8x) and consistently positive net income, What it does. Kratos is the most established defense contractor in though its leveraged free cash flow margin was still slightly our coverage. It builds jet-powered target drones and combat negative (~-13%) as it invests in capacity. drones (its unmanned systems segment), plus satellite communications, microwave electronics, and rocket-support Balance sheet. Kratos holds about $560.6M in cash against just services for the U.S. Department of Defense. This is a Wave 1 $50M of debt (financial leverage 1.19x) — a strong, low-risk platform maker with a real, decades-long government-contracting balance sheet for a company of its size ($8.6B market cap). business. Quality read. KTOS earns the highest score in our group at 36. It In plain English: Kratos builds fast, jet-powered robot planes and is the closest thing here to a "real" profitable business with an space-radio gear for the U.S. military — and has been doing defense established moat (government contracts, security clearances, work for a long time. hard-to-replicate engineering). The main caution is valuation: a trailing P/E near 277 and a forward P/E near 40 mean investors The quarter. In the quarter ended March 29, 2026, Kratos are already paying a premium for expected growth. reported revenue of about $371M, up ~22% year over year — Table 5. Kratos Defense & Security — recent quarterly trend. Source: Winston app (app.goatacademy.org). | ||||
| Quarter (period end) | Revenue | Gross margin % | Lev. FCF margin % | EPS ($) |
| Q1 FY2026 (Mar 29, 2026) $371.0M 22.6 -13.0 0.07 | ||||
| Q4 FY2025 (Dec 28, 2025) | $345.1M | 21.4 | -3.5 | 0.03 |
| Q3 FY2025 (Sep 28, 2025) $347.6M 22.2 -11.9 0.05 | ||||
| Q2 FY2025 (Jun 29, 2025) | $351.5M | 21.0 | -9.2 | 0.02 |
| THE PREHN INSTITUTE | RESEARCH July 23, 2026 | ||||
|---|---|---|---|---|
| unprofitable, with EPS of -$0.22 and a leveraged free cash flow margin around -250%. Revenue is lumpy quarter to quarter 8. RED CAT HOLDINGS (RCAT) because it depends on the timing of large government orders. What it does. Red Cat builds drones for military and public-safety Balance sheet. Red Cat holds about $131.9M in cash with almost customers, including reconnaissance aircraft (its Teal and Black no debt ($0.35M). That cash cushion is important, because at Widow lines) and first-person-view systems. It is a Wave 1 current burn rates the company relies on it — and on future capital platform maker focused on winning U.S. Army and allied raises — to stay funded while it chases larger contracts. programs. Quality read. RCAT scores just 14, the lowest in our coverage. In plain English: Red Cat makes spy-and-scout drones for soldiers and The combination of a razor-thin gross margin, the heaviest cash police. burn in the group, negative returns on capital, and zero insider ownership makes this, in our assessment, the highest-risk name The quarter. In the quarter ended March 31, 2026, Red Cat here. The bull case rests almost entirely on winning and scaling reported revenue of about $15.5M with a very thin gross margin of major military drone programs — a real possibility, but far from 12.7% — the lowest in our group. The company remained sharply guaranteed. Table 6. Red Cat Holdings — recent quarterly trend. Quarterly revenue is lumpy due to order timing. Source: Winston app (app.goatacademy.org). | ||||
| Quarter (period end) | Revenue | Gross margin % | Lev. FCF margin % | EPS ($) |
| Q1 FY2026 (Mar 31, 2026) $15.5M 12.7 -250.3 -0.22 | ||||
| Prior quarter (Sep 30, 2025) | $9.6M | 6.6 | -254.2 | -0.16 |
| Prior quarter (Jun 30, 2025) $3.2M 11.7 -410.2 -0.15 |
| THE PREHN INSTITUTE | RESEARCH July 23, 2026 | ||||
|---|---|---|---|---|
| also compressed gross margin to 17.1% for the quarter (versus the high-30s% the standalone business earned a year earlier) and, 9. AEROVIRONMENT (AVAV) combined with acquisition-related and non-cash charges, produced a large reported net loss (EPS -$3.15). Leveraged free What it does. AeroVironment is a well-known defense drone cash flow margin was modestly negative at about -4.3%. maker, famous for small tactical systems like the Switchblade loitering munition and the Puma reconnaissance drone. Following Balance sheet. AeroVironment carries the most debt in our group its acquisition of BlueHalo, it has broadened into space, cyber, and — about $743.4M against $289.9M of cash — a direct result of directed-energy systems. It is a large Wave 1 platform maker. financing the BlueHalo deal. Even so, financial leverage of 1.30x remains moderate thanks to a large equity base (~$4.3B). In plain English: AeroVironment makes the small attack-and-scout drones soldiers carry in a backpack, and recently bought another Quality read. AVAV scores 25. It has the strongest brand and the company to do space and laser tech too. most battle-proven products in the group, but the near-term picture is muddied by acquisition integration: margins are temporarily The quarter. In the quarter ended January 31, 2026, depressed, earnings are negative, and debt has risen. We would AeroVironment reported revenue of about $408M — up sharply watch whether gross margins recover toward historical levels as year over year (+143% on a trailing basis), largely because the BlueHalo is integrated. BlueHalo acquisition added a lot of new revenue. That acquisition Table 7. AeroVironment — recent quarterly trend. The BlueHalo acquisition drives the revenue jump and margin compression. Source: Winston app (app.goatacademy.org). | ||||
| Quarter (period end) | Revenue | Gross margin % | Lev. FCF margin % | EPS ($) |
| Q3 FY2026 (Jan 31, 2026) $408.0M 17.1 -4.3 -3.15 | ||||
| Q2 FY2026 (Nov 1, 2025) | $472.5M | 17.4 | -14.4 | -0.34 |
| Q1 FY2026 (Aug 2, 2025) $454.7M 20.9 -32.2 -2.40 | ||||
| Q4 FY2025 (Apr 30, 2025) | $275.1M | 38.0 | -3.2 | 0.59 |
| THE PREHN INSTITUTE | RESEARCH July 23, 2026 | |||||||
|---|---|---|---|---|---|---|---|
| SHLD — Global X Defense Tech. The most "modern warfare" of the three: it leans into defense-technology names like Palantir 10. LOWER-RISK EXPOSURE: THREE ETFS alongside the classic primes (RTX, General Dynamics, Lockheed, Northrop). It also includes global players (BAE, Rheinmetall) and, Why an ETF instead of a single stock? Every company in helpfully for this report, small positions in KTOS and AVAV. Sections 5–9 is a higher-risk, cash-burning growth story. If you like Expense ratio 0.50%. the drone-and-defense theme but do not want to bet your savings on whether one small company wins its next contract, an ITA — iShares U.S. Aerospace & Defense. The largest and most exchange-traded fund (ETF) is the tool. An ETF holds dozens of established (inception 2006, ~$13.6B in assets). It is heavily companies at once, so a stumble by any single name does far less weighted toward the very biggest U.S. names — GE Aerospace, damage. This is our recommended Wave 3. RTX and Boeing make up a large share — so it is the most "blue- chip" and concentrated of the three. Expense ratio 0.38%. In plain English: instead of picking one player, you buy a tiny slice of the whole team. If one player has a bad day, you barely notice. XAR — SPDR S&P Aerospace & Defense. Uses an equal-weight approach, so each holding gets a similar slice regardless of size. How we chose. We screened for diversified, unleveraged, liquid That gives more exposure to small- and mid-sized names — a funds focused on aerospace and defense, and selected three. We middle ground between the micro-caps in this report and the deliberately avoided a drone-only fund (ticker UAV) because it is mega-cap-heavy ITA. Lowest fee of the three at 0.35%. very small (well under $1M in assets and only a couple of holdings), which brings its own risks, and we avoided leveraged Past performance is shown for context only and does not predict funds, which are not suitable for lower-risk, buy-and-hold future results. We provide no price targets or ratings on these exposure. funds. Table 8. Selected aerospace & defense ETFs for diversified, lower-risk exposure. Performance figures are historical and not indicative of future results. Source: Winston app (app.goatacademy.org). | |||||||
| ETF | Name / Issuer | Expense ratio | Assets (AUM) | Holdings | 1-yr return | 3-yr return | Inception |
| SHLD Global X Defense Tech 0.50% $6.75B 50 +32.8% +173.1% 2023 | |||||||
| ITA | iShares U.S. Aerospace & Defense | 0.38% | $13.56B | 49 | +38.6% | +90.0% | 2006 |
| XAR SPDR S&P Aerospace & Defense (equal-weight) 0.35% $5.85B 47 +50.6% +125.5% 2011 | |||||||
| Table 9. Top holdings snapshot (approximate weights). These funds are dominated by large, profitable defense primes — the opposite risk profile to the micro-caps in this report. Source: Winston app (app.goatacademy.org). | |||||||
| ETF | Largest holdings (approx. weight) | ||||||
| SHLD RTX 9.4%, General Dynamics 9.3%, Palantir 8.3%, Lockheed Martin 8.2%, Northrop Grumman 8.1% (also holds KTOS ~1.4%, AVAV ~0.9%) | |||||||
| ITA | GE Aerospace 22.2%, RTX 15.9%, Boeing 9.2%, Howmet 4.8%, General Dynamics 4.7% (also holds KTOS ~0.6%) | ||||||
| XAR Axon 3.4%, VSE Corp 3.2%, Hexcel 3.1%, RTX 3.1%, Howmet 3.1% (equal-weight, ~3% each across top names) | |||||||
| 💡 Learn a Trading System that Makes Market Headlines Irrelevant Go to https://www.bulletproofportfolio.org/, grab your free ticket, show up live, bring your questions. No replay. |
July 23, 2026
11. Rules for Growth Stocks
Because most of the companies in this report are not yet profitable, Felix's core quality checklist alone would screen them all out. For young, fast-growing businesses like these, he applies a separate, more demanding set of rules — while accepting that growth investing is inherently riskier. We reproduce those rules below and encourage readers to hold each drone name up against them.
Additional criteria for growth stocks
Same valuation method applies.
More challenging and thus more risky to pick growth stocks, as we lack data.
Need a longer time horizon to judge success by.
Focus on the metrics that are available:
High operating margin.
Strong revenue growth (after all, it's a growth company) — must beat others in the sector.
Low debt.
Good cash position to survive a crash.
Large target market with 25x TAM+ (total addressable market).
Strong, clean brand.
Tech leadership.
High R&D spend to build a moat.
CEO/Founder heavily invested (e.g. Tesla, Square, Spotify, MercadoLibre, AMD).
Fully understand the business model. Are you able to write down 3 reasons why this company is better than competitors?
Applying the growth rules to our group. Measured against these criteria, the group is mixed. On low debt and a good cash position, most names score well — UMAC, RCAT and ONDS are nearly debt-free and cash-rich after recent raises. On strong revenue growth, all five clearly qualify. Where they struggle is high operating margin: only Kratos is consistently operating-profitable today. On founder/insider ownership, UMAC (~12%) and AVAV (~25%) stand out, while RCAT shows effectively none. The large target market test is comfortably met — the global drone and defense-technology market is large and growing.
Our conclusion: these are textbook growth stocks — big markets and fast growth, but thin or negative profitability and a need for patience. They should be sized and held accordingly.
July 23, 2026
12. Risks and Opportunities
Opportunities
A durable, multi-year demand cycle. Rising global defense budgets and the proven battlefield value of drones support years of potential demand growth. We expect uncrewed systems to take a rising share of defense spending.
A protected home market. U.S. restrictions on Chinese-made drones create a policy tailwind specifically for domestic makers such as UMAC and RCAT — a rare case where regulation helps small players.
Strong balance sheets buy time. Most of these companies raised capital and hold far more cash than debt, giving them runway to fund growth without immediate solvency pressure.
Optionality. A single large program win (an Army drone contract, a major security deployment) can transform a micro-cap's revenue base — the upside that draws investors to the theme.
Risks
Cash burn and dilution. Every company here has negative free cash flow. Funding losses often means issuing new shares, which dilutes existing owners. This is the single most important risk in the group.
Policy dependence. The "buy American" thesis relies on government policy staying friendly. A change in administration priorities or procurement rules could weaken the tailwind quickly.
Lumpy, contract-driven revenue. Sales depend on the timing of large government orders, making quarterly results volatile and hard to predict — clearly visible in Red Cat's swings.
Valuation. Several names trade at high multiples of sales or earnings, pricing in success that is not yet proven. Kratos's elevated P/E is a clear example.
Integration and execution. AeroVironment's BlueHalo deal shows how acquisitions can depress margins and raise debt before the promised benefits arrive.
Competition. The field is crowded, and the largest defense primes (held inside the ETFs in Section 10) have vastly greater resources and could out-invest the small caps.
13. CONCLUSION
A powerful theme, an early-stage group. Our analysis suggests the drone-economy tailwind is real and durable. But the five companies profiled here are, today, higher-risk growth stories — fast-growing, cash-burning, and mostly unprofitable, with quality scores from 14 to 36. Kratos stands out as the most financially mature; the micro-caps offer more explosive potential paired with more danger.
For most readers seeking exposure to this theme with less single- stock risk, we believe the diversified ETFs in Section 10 are the more prudent starting point. As always, position sizing and a long time horizon matter more than any single pick.
July 23, 2026
14. Glossary of Key Terms
This report is written to be understood by a complete beginner. If any term below is unfamiliar, this table explains it in plain English. We list the terms in the order they tend to matter most when judging a business.
| Table 11. Plain-English glossary of the financial terms used in this report. | |
|---|---|
| Term | What it means in plain English |
| Revenue The total money a company brings in from selling its products or services before any costs are taken out. Also called "sales" or the "top line." | |
| Gross margin | Out of every dollar of sales, how much is left after paying to actually make the product. A high gross margin means each sale is very profitable; a thin one means there is little room for error. |
| Operating income / margin Profit (or loss) from the core business after paying to make the product AND to run the company (salaries, research, offices). This strips out one-off, non-business items. | |
| Net income | The final profit or loss after everything, including items that have nothing to do with the day-to-day business. It can be positive even when the core business loses money, which is why we look at operating income too. |
| Free cash flow (FCF) The actual cash left over after a company pays its bills and invests in its business. Negative FCF means the company is spending more cash than it takes in and must raise more to keep going. | |
| Leveraged FCF margin | Free cash flow shown as a percentage of sales, after debt costs. A big negative number (e.g. -230%) means the company burns far more cash than it earns. |
| Cash burn How fast a company is using up its cash reserves. A fast-burning company needs a big cash pile or new funding to survive. | |
| Financial leverage | How much a company relies on debt versus its own money. We measure it as total assets divided by shareholder equity; a higher number means more debt and more risk. |
| Interest coverage How easily a company can pay the interest on its debt out of its profits. A higher number is safer; a low or "n/m" (not meaningful) number is a warning sign. | |
| Dilution | When a company issues new shares to raise money, each existing share owns a smaller slice of the company. Common in cash-burning firms and a real cost to existing owners. |
| P/E ratio Price-to-earnings: the share price divided by the profit per share. A rough gauge of how expensive a stock is relative to its current profits. | |
| Forward P/E | The same idea but using expected future profits instead of past ones. Useful for fast-growing companies whose profits are expected to change. |
| Market cap The total value of all a company's shares added together — essentially the price tag to buy the whole company on the stock market. | |
| Moat | A durable advantage that protects a company from competitors — like a strong brand, patents, huge scale, or contracts that are hard to switch away from. |
| TAM (total addressable market) The full size of the market a company could sell into if it captured every possible customer. A large TAM means lots of room to grow. | |
| ETF | Exchange-traded fund: a single investment that holds dozens of companies at once, spreading risk so one bad stock does far less damage. |
| Expense ratio The yearly fee an ETF charges, shown as a percentage of the money you invest. Lower is cheaper for the investor. | |
| AUM (assets under management) | The total amount of money invested in a fund. Very small funds can be riskier and harder to trade. |
| Loitering munition A small drone that can circle an area before striking a target — a fast-growing category of battlefield drone. | |
| Blue UAS | A U.S. government-approved list of drones that meet security rules, effectively steering government buyers toward trusted, non-Chinese suppliers. |
| GOAT / Winston quality score The Prehn Institute's 0–100 rating of overall business quality, combining profitability, cash generation, financial stability, valuation and competitive edge. Higher is better. |
July 23, 2026
15. Methodology and Data Notes
What this report is. This is an educational fundamental snapshot of the drone-and-defense investing theme and five representative companies within it. Our goal is to explain how the theme works, how a disciplined investor judges these businesses, and where the opportunities and risks sit — in language a beginner can follow. It is not a recommendation to buy or sell anything.
How we picked the companies. We selected five U.S.-listed names that together illustrate the full value chain of the drone economy: platform makers that build the drones (AeroVironment, Red Cat, Kratos) and parts-and-systems suppliers that sell what goes inside and connects them (Unusual Machines, Ondas). This spread lets a reader see how the same tailwind reaches different kinds of businesses.
How we picked the ETFs. For readers who prefer lower-risk, diversified exposure, we screened aerospace-and-defense funds for reasonable size, liquidity, no leverage, and meaningful exposure to the theme, then selected three (SHLD, ITA, XAR). We deliberately excluded a drone-only fund that was far too small and any leveraged products, which are unsuitable for steady, long-term holding.
The metrics we focused on. Following Felix's quality framework, we emphasised gross margin (is the product profitable to make?), free cash flow (is the company generating or burning cash?), and debt and leverage (is the balance sheet stable?). We also show revenue growth, valuation multiples, insider ownership and the The Prehn Institute quality score for context.
The three-month snapshot. This report is a point-in-time snapshot. Earnings figures reflect each company's most recently reported quarter as of publication — the quarter ended March 2026 for Ondas, Unusual Machines, Kratos and Red Cat, and the quarter ended January 2026 for AeroVironment. Trends can and do change from quarter to quarter.
A note on "profits" that are not really profits. Two companies in this group reported positive net income in their latest quarter driven by non-cash accounting items (changes in the fair value of warrant liabilities), not by the core business. We flag this in each relevant section, and throughout we lean on operating income and free cash flow — measures that are harder to flatter — so readers are not misled by one-off accounting gains.
What we deliberately did not do. In keeping with an educational, FTC-compliant approach, this report contains no buy or sell ratings, no price targets, and no technical (chart-timing) analysis. We make no performance claims. Every number is drawn from the Winston app; we did not invent figures or rely on non-public data.
Source of all data. All quantitative company and fund data — revenue, margins, cash flow, debt, valuation, holdings, returns and quality scores — comes from the Winston app at and was current as of the publication date. Industry context (defense budgets, battlefield trends, U.S. drone- sourcing policy) reflects widely reported public developments and is used for background only.