
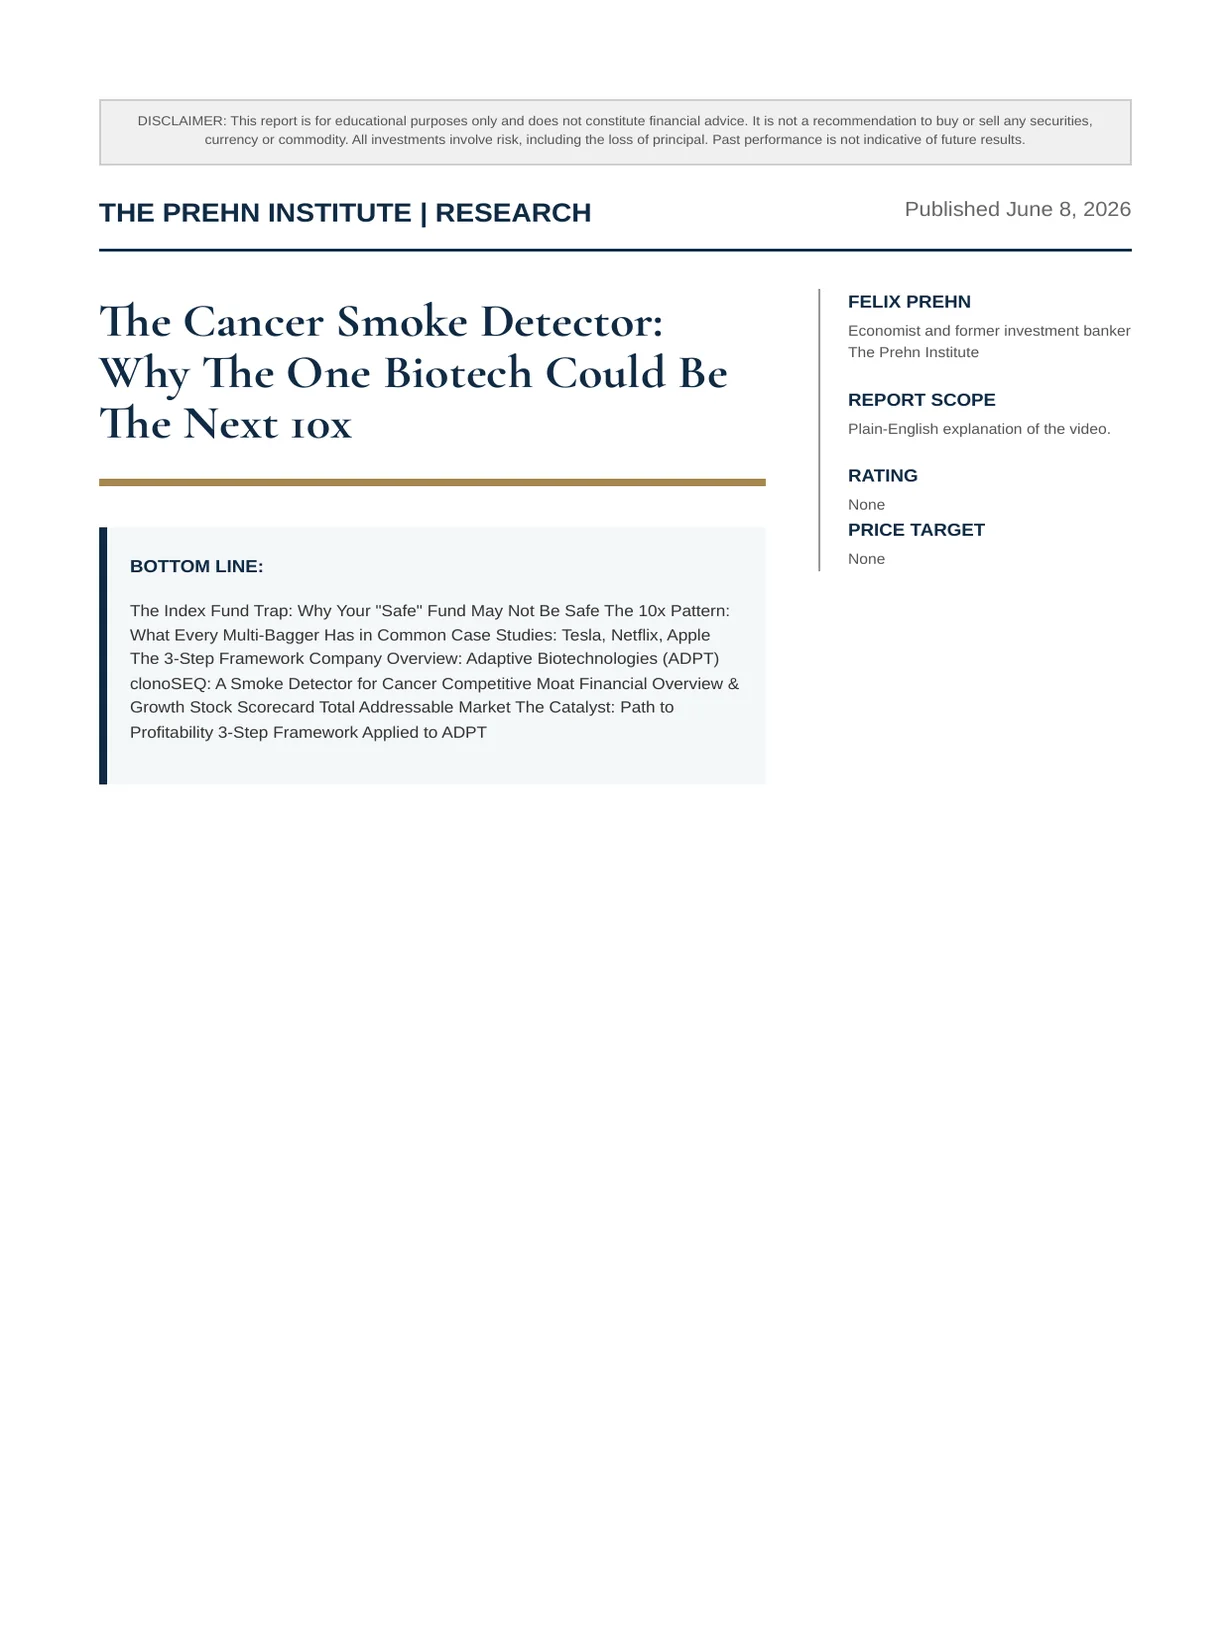
The Cancer Smoke Detector: Why The One Biotech Could Be The Next 10x
Felix Nikolas Prehn · 8 June 2026 · 19 pages
Bottom line
The Index Fund Trap: Why Your "Safe" Fund May Not Be Safe The 10x Pattern: What Every Multi-Bagger Has in Common Case Studies: Tesla, Netflix, Apple The 3-Step Framework Company Overview: Adaptive Biotechnologies (ADPT) clonoSEQ: A Smoke Detector for Cancer Competitive Moat Financial Overview & Growth Stock Scorecard Total Addressable Market The Catalyst: Path to Profitability 3-Step Framework Applied to ADPT
Overview
| Competitive Landscape: Natera & Others ETF Alternatives for Lower-Risk Exposure Risk Factors Conclusion Sources & Citations | |
|---|---|
| HEALTHCARE · DIAGNOSTICS · ONCOLOGY The Cancer Smoke Detector: Why One Biotech Could Be the Next 10x Adaptive Biotechnologies (ADPT) — The Only FDA-Cleared Minimal Residual Disease Test in a $6 Billion Market | |
| BOTTOM LINE: Adaptive Biotechnologies holds a unique position in precision oncology as the maker of clonoSEQ, the only FDA- cleared test that can detect a single cancer cell hiding among one million healthy cells. With clinical revenue compounding at over 50% annually for four straight years, a $6 billion total addressable market of which less than 5% has been captured, and the company targeting its first-ever profitability in 2026, we believe ADPT exhibits the classic hallmarks of a multi-year base pattern that has preceded historic 10x moves in Tesla, Netflix, and Apple. This report is not a recommendation to buy or sell ADPT. It is a framework applied to a real-world example — designed to teach investors how to identify potential multi-baggers using a repeatable 3-step checklist. KEY FIGURES: Market Cap ~$2.7B TAM ~$6B Revenue CAGR 53% Penetration <15% 4-Year Base | |
| twice as many slices. Your two slices haven't changed — but the pizza is the same size, so each slice is smaller. THE INDEX FUND TRAP: WHY YOUR "SAFE" FUND MAY NOT BE SAFE The Valuation Warning. Legendary investor Mohnish Pabrai — a close associate of the late Charlie Munger — recently The Concentration Problem. Most investors believe the S&P highlighted a stunning data point: the S&P 500 is trading at a trailing PE ratio of approximately 32, versus a long-term 500 is diversified — after all, it holds 500 companies. But the reality is starkly different. As of mid-2026, just ten stocks historical average of roughly 16. Investors are paying double the normal price for the earnings in their "safe" fund. History account for approximately 38–40% of the entire index weight. That is not diversification. That is a concentrated technology bet suggests that when valuations stretch to this degree, forward returns compress significantly. disguised as a broad market fund. The Dilution Bomb. Adding to this concern, the largest index constituents are actively diluting shareholders. Alphabet (Google's parent company) announced an $80 billion equity offering in June 2026 — $30 billion in underwritten offerings, a $40 billion at-the-market program, and a $10 billion Berkshire Hathaway private placement. Meta (Facebook) is reportedly planning a similar multi-billion-dollar offering. When companies print new shares, existing shareholders' slices of the pie get thinner. Think of it like a pizza: same pizza, but now cut into |

| S&P 500 Concentration & Valuation Snapshot | ||
|---|---|---|
| Top 10 Weight | ~38–40% of total index | High concentration |
| Trailing |
PE
Ratio
~31.83
Nearly 2x long-term avg
Long-Term Avg PE
~16.22 Based on Shiller data
Alphabet Offering
$80 Billion filing, June
2026
Meta Offering
Multi-billion (reported)
Stock dropped 5–7%
What This Means for You. If your retirement savings are sitting in an index fund, you are holding a concentrated bet on a handful of technology giants, at double the normal valuation, while those companies actively dilute your ownership. Wall Street institutions are already repositioning. The question is whether individual investors have a plan.
💡 First & Only LIVE Training
'The Index Fund Trap: Why the
S&P 500 Is Lying to You'
THE 10X PATTERN: WHAT EVERY MULTI-
BAGGER HAS IN COMMON
The Spring Effect. Our analysis of historic 10-baggers reveals a remarkably consistent pattern: before every explosive breakout, the stock went sideways for two to four years. We call this "the spring effect." When a business grows — more revenue, more customers, improving margins — but the stock price stays flat, the disconnect creates a compressed spring. At some point, the market must re-price the business to reflect its underlying value. When it does, the release can be dramatic.
During these boring sideways periods, most investors give up and sell. The headlines turn negative. Analysts lose interest. That is precisely when the opportunity is greatest — because the spring is being compressed the hardest.
Business grows quietly underneath
▼
Stock goes sideways for 2–4 years
▼
Most investors give up and sell
▼
Market re-prices → 10x breakout
SEC
Case Studies: Tesla, Netflix, Apple
Tesla (2017–2020). Between 2017 and 2020, Tesla traded in a narrow sideways range. Headlines screamed "Tesla is going bankrupt." Meanwhile, the company was building Gigafactories and ramping Model 3 production. Revenue was growing while the stock was dead. Then in 2020, the spring released — the stock gained over 10x in a single year.
Netflix (2011–2013). In 2011, Netflix crashed 80%. Everyone said streaming was a fad. The stock bounced sideways throughout 2012. But underneath, Netflix was adding roughly two million streaming subscribers every single quarter. In 2013 alone, the stock tripled (+297%), and it continued to compound
- delivering over 10x returns within a few years.
Apple (2015–2019). For four years, Apple stock traded in a frustrating range. "Apple is done growing," the consensus declared. Meanwhile, the iPhone installed base was exploding, services revenue was compounding, and the company was executing massive share buybacks. In 2019, the stock broke out — up 90% that year alone. Then it doubled. Then it doubled again.
| Company | Sideways Period | What Grew Underneath | Breakout |
|---|---|---|---|
| Tesla | 2017–2020 (~3 years) | Gigafactories, Model 3 ramp | +10x in one year |
| Netflix | |||
| 2011–2013 | |||
| (~2 years) | |||
| +2M subs/quarter | |||
| +297% |
in
2013, then 10x
Apple
2015–2018 (~4 years) iPhone base, services, buybacks
+90% in 2019, then 2x, then 2x
The common thread: a multi-year period of boredom, with the business growing while the stock was flat. Then — once the market could no longer ignore the fundamentals — an explosive re-rating.
The 3-Step Framework: Finding the
Based on our study of these patterns, we use a simple three- step checklist to evaluate whether a stock might be the "next spring" ready to release:
THE 3-STEP 10X CHECKLIST
Step 1: Is the business growing while the stock is flat?
Revenue ↑, Stock →
Step 2: Are institutions quietly accumulating?
Volume creeping up
Step 3: Is a catalyst approaching?
Profitability, new product, shift
If all three boxes are checked — growing business, institutional accumulation, approaching catalyst — the stock may exhibit the same spring compression that preceded historic 10x moves. We now apply this framework to a specific company.
COMPANY
OVERVIEW:
ADAPTIVE
BIOTECHNOLOGIES (ADPT)
The Human Story. Every three minutes, someone in America is diagnosed with blood cancer — leukemia, lymphoma, or myeloma. That adds up to roughly 192,000 new diagnoses per year. Right now, 1.7 million Americans are living with or in remission from a blood cancer.
After months of gruelling chemotherapy, a patient hears the words every cancer survivor dreads: "We think we got it all." The question is devastating — do they think, or do they know? Because if even a microscopic amount of cancer remains hidden in the body — invisible to a standard blood test, invisible to a scan — it can come roaring back. This is the problem Adaptive Biotechnologies was built to solve.
The Company. Adaptive Biotechnologies (Ticker: ADPT) is a commercial-stage biotech company headquartered in Seattle, Washington. Its flagship product is clonoSEQ — a next- generation sequencing-based test for Minimal Residual Disease (MRD) in blood cancers.
CLONOSEQ: A SMOKE DETECTOR FOR
CANCER
The Barcode Analogy. Every cancer has a unique genetic fingerprint — think of it like a barcode on a product at the supermarket. clonoSEQ reads a patient's blood and looks for that specific barcode. Its sensitivity is extraordinary: it can find one single cancer cell hiding among one million healthy
cells . That is like finding one specific person in the entire city of Dallas — by their fingerprint alone.
The Smoke Detector Analogy. A regular check-up is like walking through your house looking for flames. If you see fire, it is already bad — the cancer has already returned and spread. clonoSEQ is the smoke detector. It catches the faintest wisp of smoke before there is ever a fire. Before the cancer comes back. Before it spreads. That early warning changes everything
- doctors can adjust treatment before a relapse, instead of reacting after it is too late.
🔬 Cancer has a unique genetic "barcode"
▼
clonoSEQ scans blood for that barcode
▼
Detects 1 cancer cell in 1,000,000
▼
Early warning → Treat BEFORE relapse
COMPETITIVE MOAT
clonoSEQ's moat is among the most defensible we have observed in diagnostic oncology:
This is not a company at the finish line. This is a company barely out of the starting blocks, with a moat nobody else has replicated.
Only FDA-cleared MRD test — for multiple myeloma, B- ALL, and CLL. No competitor has FDA clearance
▸
250+ peer-reviewed publications validating the science
▸
160+ active pharmaceutical trials using clonoSEQ as a clinical endpoint
▸
50%+ of US hematologist-oncologists already use the test
▸
Insurance covers 300M+ American lives — most patients pay nothing out of pocket
▸
Less than 15% penetration in most cleared indications — 85% of the runway is still ahead
▸
| Moat Factor | Detail | Competitive Strength |
|---|---|---|
| FDA Clearance | Only cleared MRD test (lymphoid) | Very High |
| Clinical | ||
| Validation | ||
| 250+ publications | Very High | |
| Pharma | ||
| Adoption | ||
| 160+ drug trials | Very High | |
| Physician | ||
| Network | ||
| 50%+ |
of blood cancer doctors
High
Payer Coverage
300M+ covered lives High
Switching Cost
Deep clinical workflow integration
High
Market Penetration
<15% in most indications
Massive Runway
US
Financial Overview & Growth Stock
SCORECARD
Revenue Growth. Clinical revenue has compounded at approximately 53% annually from 2021 through 2025 — while the stock has gone essentially nowhere. This is the textbook definition of spring compression. Q1 2026 revenue came in at $70.9 million, up 35% year-over-year, with test volumes surging 41% to 32,595 tests. Management has raised FY2026 MRD revenue guidance to $260–$270 million.
Path to Profitability. ADPT is targeting positive adjusted EBITDA and positive free cash flow company-wide by end of 2026. The MRD segment is already EBITDA-positive. In Q1 2026, adjusted EBITDA loss narrowed to just $2.5 million, and net loss shrank to $20 million from $29.8 million a year earlier. The company held $237.2 million in cash as of March 31, 2026.
Margins. Sequencing gross margin is targeted above 70% for 2026 — a strong indicator of the test's pricing power and underlying moat. As the company scales past the profitability inflection, operating leverage should be significant.
| Financial Metric | Latest Data | Commentary |
|---|---|---|
| Q1 2026 Revenue | $70.9M (+35% YoY) | Strong acceleration |
| Q1 2026 Test Volumes | ||
| 32,595 |
(+41%
YoY)
Adoption accelerating
Clinical Revenue
~53% consecutive years
FY2026 MRD Guidance
(raised)
Management confidence
Adj. EBITDA (Q1 2026) -$2.5M Near breakeven
Net Loss (Q1 2026)
-$20M (vs -$29.8M prior)
Rapidly narrowing
Sequencing Gross Margin Target
>70%
Strong pricing power
Cash Position $237.2M
Runway to profitability
Market Cap ~$2.7B
Small relative to TAM
Felix's Growth Stock Scorecard — Applied to
ADPT
We apply The Prehn Institute's proprietary Growth Stock Framework to assess ADPT. Because ADPT is a pre-profit growth company, some traditional profitability metrics are not yet applicable — which is expected for companies at this stage. We focus on the metrics that are available.
High Operating Margin
Emerging — targeting >70% gross margin, EBITDA inflection in 2026
Strong Revenue Growth (beat sector)
- 53% CAGR — far exceeds biotech sector averages
Low Debt
- Cash-funded operations, $237M cash on hand
Good Cash Position to Survive a Crash
- $237.2M — multi-year runway
Large TAM (25x+ current revenue)
- ~$6B TAM vs ~$270M revenue = ~22x
Strong Clean Brand
- Gold-standard MRD — "the only FDA- cleared test"
Tech Leadership
- 250+ publications, 1-in-1-million sensitivity
High R&D Spend (building moat)
✓ Ongoing clinical trials, expanding indications
Fully Understand Business Model
- Single-product focus, clear revenue driver
3 Reasons ADPT May Be Better Than Competitors
- Only FDA-cleared MRD test — regulatory moat that took years and hundreds of clinical studies to build
- Deepest clinical integration — over half of US blood cancer doctors already use it; 160+ pharma trials embed it as an endpoint
- Insurance coverage at scale — 300M+ covered lives removes the adoption friction that kills most diagnostic startups
TOTAL ADDRESSABLE MARKET
The total addressable market for MRD testing in blood cancers is estimated at approximately $5.5–$6.2 billion, per Adaptive's 10-K filing. Currently, ADPT is generating roughly $260–$270 million in annual MRD revenue — representing only about 4– 5% of the total opportunity.
ADPT Market Penetration
ADPT Today (~$270M) Total Market (~$6B)
If ADPT captures even 25% of the addressable market — and as the only FDA-cleared player in most indications, there is a reasonable pathway to do so — that would represent approximately $1.5 billion in revenue. For a company currently valued at roughly $2.7 billion, the re-rating potential is significant.
Additionally, the TAM is expanding: new clinical guidelines are recommending more frequent MRD testing, and the company is actively expanding into additional blood cancer types, broadening the addressable patient population.
The Catalyst: Path to Profitability
The Profitability Inflection. In 2026, for the first time in its history, ADPT is expected to achieve positive adjusted EBITDA and positive free cash flow. This is a watershed moment. A well- known investing rule holds that when a company flips from losing money to making money, the market re-rates the stock aggressively. It is like a switch gets flipped — the stock goes from being ignored to being on every screen on Wall Street.
4 years of revenue growth (53% CAGR)
▼
Q1 2026: EBITDA loss just -$2.5M
▼
2026 Target: First-Ever Profitability
▼
New guidelines → More testing per patient
▼
Expanding into new cancer types
Multiple catalysts are converging simultaneously: profitability, guideline-driven volume expansion, and TAM expansion into new indications. Individually, any of these could force a market re-rating. Together, they create a powerful cluster of triggers.
3-STEP FRAMEWORK APPLIED TO ADPT
3-STEP 10X CHECKLIST — ADPT
Step 1: Multi-year sideways base?
- 4 years sideways (peaked 2021 → base since)
Step 2: Business growing underneath?
✓ Revenue +53%
CAGR,
volumes +41% Q1 2026
Step 3: Catalyst approaching?
✓ First profitability + new guidelines + new indications
The Chart Pattern. ADPT peaked at $67.74 in January 2021 during the pandemic-era biotech bubble, then crashed to under $5 by 2023. Since then, for approximately four years, the stock has been building a base — going sideways while revenue compounds at 50%+ per year. The 52-week range is $9.90– $20.76. This is the same pattern we observed in Tesla before 2020, Netflix before 2013, and Apple before 2019.
~5%
All three boxes are checked. The spring is compressed.
Back-of-Napkin 10x Math
| Variable | Value |
|---|---|
| Current Market Cap | ~$2.7 Billion |
| Total Addressable Market | ~$6 Billion |
| 25% |
Market Capture
Scenario
~$1.5B Revenue
Gross Margin Target >70%
Market Multiple for Growth + Moat
Premium (comparable to high- growth diagnostics)
Framework Assessment
The math is supportive — not a guarantee
Competitive Landscape
Natera (NTRA). The primary competitive threat comes from Natera, which has built a strong franchise in solid tumour testing with its Signatera product and is now aggressively expanding into the blood cancer MRD space. Natera is well- funded and has a proven commercial engine. However, they currently lack FDA clearance for blood cancer MRD testing, which is a significant regulatory and competitive gap.
| Factor | ADPT (clonoSEQ) | Natera (Signatera) |
|---|---|---|
| FDA Clearance (Blood MRD) | Yes — only cleared test | No |
| Primary Focus | ||
| Blood |
cancers
(lymphoid)
Solid tumours, expanding to blood
250+
Extensive (solid tumours)
Pharma Trial Adoption
160+ trials Growing
Insurance Coverage
300M+ lives
Strong coverage (solid tumours)
Sensitivity in 1,000,000 cells
Competitive
While Natera's expansion is a real and ongoing competitive risk, the FDA clearance advantage, deep physician network, and entrenched position in pharma trials give ADPT a meaningful head start that will be difficult — and time- consuming — to replicate.
Lower-risk
For investors who find the ADPT thesis compelling but prefer diversified exposure rather than a single-stock bet, the following ETFs provide exposure to the genomics, diagnostics, and biotech sectors:
| ETF | Ticker | Focus | Relevance |
|---|---|---|---|
| ARK Genomic Revolution ETF | ARKG | Genomics & precision medicine | Direct exposure to genomic diagnostics companies including ADPT |
| iShares | |||
| Biotechnology | |||
| ETF | |||
| IBB | |||
| Broad US | |||
| biotechnology | |||
| Diversified | |||
| biotech basket; | |||
| reduces single- | |||
| stock risk |
SPDR S&P Biotech ETF
XBI
Equal- weighted S&P biotech
Equal-weighted — gives more weight to smaller biotech names like ADPT
Invesco S&P
Equal
Weight Health Care ETF
RSPH
Equal-weight healthcare
Broad healthcare diversification without mega- cap concentration
ETFs reduce the idiosyncratic risk of any single company's execution but also dilute the potential upside. For those who believe in the broader genomics theme but are uncomfortable with the risk profile of a $2.7 billion company, these vehicles offer a middle ground.
RISK FACTORS
We identify the following key risks to the ADPT investment thesis:
Small-Cap Risk. At ~$2.7 billion market capitalisation, ADPT is significantly smaller than large-cap healthcare names. Smaller companies carry higher volatility, lower liquidity, and greater vulnerability to market shocks
▸
Competitive Pressure. Natera's expansion into blood cancer MRD testing is a direct and credible threat. If Natera achieves FDA clearance, the competitive dynamics could shift meaningfully
▸
Execution Risk. The company must continue executing on its profitability roadmap. One bad quarter does not break the thesis, but sustained margin pressure or missed guidance could erode investor confidence
▸
Pre-Profit Valuation. ADPT has never been profitable. While targeting EBITDA-positive by end of 2026, this has not yet been achieved. The market may not re-rate until
▸

This is NOT a buy recommendation. It is a framework applied to a real-world example. Every investor must conduct their own due diligence.
The Mindset Shift
Boredom Is the Price of Admission. The reason most investors will never find a 10-bagger is not because they cannot find the stocks. It is because they sell during the boring part. They buy a stock, watch it go nowhere for three years, get frustrated, and sell — only to watch it multiply afterward.
The flat years are not the problem. The flat years are the setup. Every 10-bagger we examined — Tesla, Netflix, Apple — had a boring middle chapter that scared everyone away. That is precisely the chapter ADPT appears to be in right now.
CONCLUSION: THREE BIG IDEAS
- Every 10x stock builds a boring base first. Tesla did it. Netflix did it. Apple did it. That boring, sideways chart is not a death sentence — it is a launchpad. Now you know what to look for.
- ADPT fits the pattern. The only FDA-cleared cancer detection test of its kind, revenue compounding at 50%+, turning profitable for the first time, four-year base, in a $6 billion market with 85% runway ahead. The spring is compressed.
- Your index fund might not be as safe as you think. Ten stocks making up 40% of the index, double the normal valuation, active share dilution — if you do not have a plan, you may find out the hard way in a decade.
💡 First & Only LIVE Training
'The Index Fund Trap: Why the
S&P 500 Is Lying to You'
Disclaimer
The Prehn Institute Felix Prehn is the founder of The Prehn Institute, an educational platform that has taught over 20,000 students the fundamentals of investing and stock market analysis. The Prehn Institute focuses on demystifying Wall Street's investment strategies and making them accessible to regular investors. The academy provides comprehensive training on fundamental analysis, technical analysis, risk management, and portfolio construction—empowering individual investors to make informed decisions about their financial futures.