
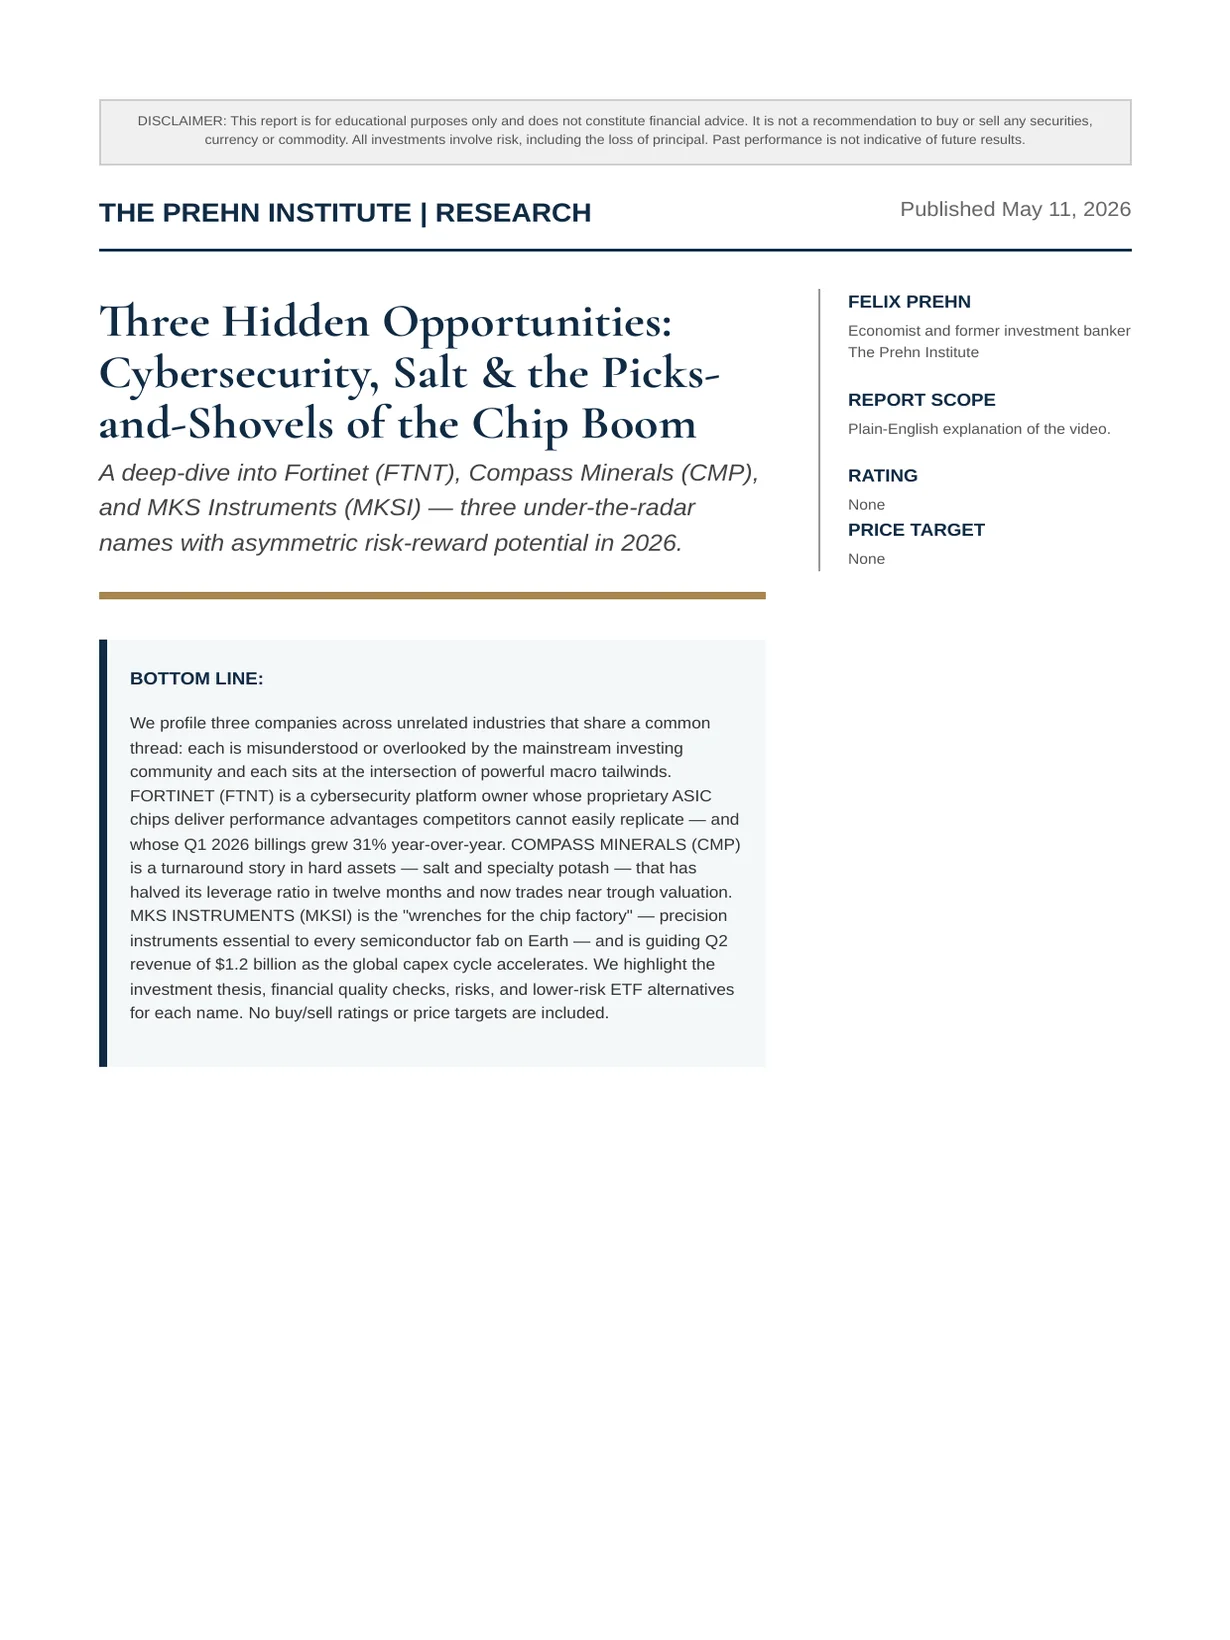
Three Hidden Opportunities: Cybersecurity, Salt & the Picks- and-Shovels of the Chip Boom
A deep-dive into Fortinet (FTNT), Compass Minerals (CMP), and MKS Instruments (MKSI) — three under-the-radar names with asymmetric risk-reward potential in 2026.
Felix Nikolas Prehn · 11 May 2026 · 26 pages
Bottom line
We profile three companies across unrelated industries that share a common thread: each is misunderstood or overlooked by the mainstream investing community and each sits at the intersection of powerful macro tailwinds. FORTINET (FTNT) is a cybersecurity platform owner whose proprietary ASIC chips deliver performance advantages competitors cannot easily replicate — and whose Q1 2026 billings grew 31% year-over-year. COMPASS MINERALS (CMP) is a turnaround story in hard assets — salt and specialty potash — that has halved its leverage ratio in twelve months and now trades near trough valuation. MKS INSTRUMENTS (MKSI) is the "wrenches for the chip factory" — precision instruments essential to every semiconductor fab on Earth — and is guiding Q2 revenue of $1.2 billion as the global capex cycle accelerates. We highlight the investment thesis, financial quality checks, risks, and lower-risk ETF alternatives for each name. No buy/sell ratings or price targets are included.
Overview
The academy provides comprehensive training on fundamental analysis, technical analysis, risk management, and portfolio construction — empowering individual investors to make informed decisions about their financial futures.
Tradevision.io
Felix Prehn is also the co-founder of Tradevision.io, a platform dedicated to providing news and data specifically tailored for retail investors. Tradevision.io helps individual investors access the information and tools they need to compete effectively in modern financial markets.
Mission and Dedication
Felix Prehn has dedicated his retirement to teaching regular investors how to protect their wealth and navigate the complexities of the stock market. His approach emphasizes understanding the fundamental principles that drive long- term investment success, rather than chasing short-term trends or speculation.
By bridging the knowledge gap between Wall Street professionals and individual investors, Felix works to level the playing field and help people take control of their financial destinies.
Connect with Felix Prehn on YouTube
youtube.com/felixfriends
Cross-Comparison Summary Table
The Buy-and-Hold Warning
Sources & Citations
Disclaimer
THE QUALITY STOCK FRAMEWORK
Throughout this report we apply a consistent quality-screening methodology. The framework evaluates every company across four dimensions: profitability, cash generation, financial stability, and competitive moat. Below is a summary of the metrics we use and why each matters — explained simply.
Is the Business Profitable?
Gross Margin Indicates the size of the moat. Reveals core efficiency and the company's ability to absorb shocks.
Operating Margin Reveals profitability after all operational costs. A good measure of cost control.
ROCE Return on capital employed. Reveals the return to all financial stakeholders (equity and debt). A good measure of management effectiveness.
Is It Generating Cash?
Cash Conversion Ability to convert profits into cash. A good measure of efficiency and flexibility.
Leveraged Free Cash Flow Margin Reveals what portion of sales ends up as cash after all obligations.
Is It Financially Stable?
Leverage (Debt/Equity) Measure of financial risk. Tells a story about volatility of returns.
Interest Cover Degree of financial comfort regarding debt. A high ratio suggests financial stability and flexibility.
Does It Have a Moat (Competitive Advantage)?
Cost Advantage Can produce goods or services more cheaply than competitors.
Scale Economies of scale that smaller rivals cannot match.
Switching Costs Customers face high costs or friction to switch to a competitor.
Patents / Brand Intellectual property, brand recognition, or government licenses.
ETF Alternative
I. Fortinet (Ftnt) — Cybersecurity
INDUSTRY OVERVIEW
The Cybersecurity Imperative. The global cybersecurity market was valued at approximately $192 billion in 2023 and is projected to reach between $501 billion and $608 billion by 2033, growing at an annual rate of 9–12%. Chief information officers anticipate cybersecurity spending to increase 50% faster than overall software spending. Every company on Earth that connects to the internet needs cybersecurity — and the threat landscape is accelerating.
AI: Both Sword and Shield. Artificial intelligence has become the defining force in cybersecurity. On the offensive side, AI enables deepfake attacks, automated phishing at scale, and self-propagating worms that adapt in real time. On the defensive side, AI-driven threat detection and automated response systems are becoming essential. Every Fortune 500 board is increasing cybersecurity budgets — not cutting them. This dynamic creates a structurally growing addressable market.
Quantum Computing Adds Urgency. The emerging reality of quantum computing threatens current encryption standards. Organizations must begin transitioning to quantum-resistant security architectures, adding another layer of demand for next-generation cybersecurity platforms. Companies that can integrate quantum-safe solutions into existing infrastructure will command a premium.
INVESTMENT THESIS
Proprietary ASIC Technology. Fortinet designs its own application-specific integrated circuits (ASICs) — custom silicon chips that power its FortiGate firewalls. This is not something competitors can replicate quickly. These chips deliver higher throughput at lower cost per unit of security performance. Think of it as building a proprietary engine rather than buying one off the shelf. This creates a meaningful cost advantage and a durable moat.
Platform Convergence. Fortinet operates a unified platform — FortiOS — that integrates secure networking, unified SASE (Secure Access Service Edge), and AI-driven security operations on a single operating system. This convergence is accelerating in the AI era, as customers prefer to consolidate security vendors rather than manage dozens of point solutions. The company has over 20 AI- enabled solutions on its platform.
Recurring Revenue Engine. The majority of Fortinet's revenue is subscription-based. Service revenue reached $1.21 billion in Q1 2026, growing 11% year-over-year. Deferred revenue — a forward indicator of future billings — increased 15%. Subscription-based revenue is sticky, predictable, and commands a premium valuation from institutional investors.
Billings Re-Acceleration. Total billings grew 31% to $2.09 billion in Q1 2026, reflecting broad strength across secure networking and unified SASE. Service billings specifically re-accelerated to 27% growth. This re-acceleration is the metric institutional investors watch most closely — it suggests underlying demand is strengthening, not peaking.
The "Rule of 51." Fortinet's combined GAAP operating margin (31%) plus revenue growth (20%) totaled 51% in Q1 2026 — one of the highest efficiency scores in the entire software industry. This suggests the company is not sacrificing profitability for growth or vice versa.
Large Enterprise Traction. Deals greater than $1 million and total deal value both grew over 60% in large enterprises, particularly in Europe and the U.S. This is significant because large enterprise deals are stickier, higher margin, and often expand over time as organizations deploy more Fortinet solutions across their networks. Operational technology (OT) billings grew over 70%, reflecting the expansion of cybersecurity into industrial environments — factories, power plants, transportation systems — that were historically unprotected.
Product Revenue Surge. Product revenue surged 41% year-over-year to $645 million. This growth was driven by demand for higher-performance FortiGate appliances, AI infrastructure upgrades, and technology expansion. When product revenue accelerates ahead of service revenue, it typically signals a new installation wave that will convert to high-margin recurring service revenue in subsequent quarters.
$2.09B
+31% Year-over-Year
- 80.3%
- Industry-leading profitability
$1.01B
57.6% adjusted FCF margin
FINANCIAL QUALITY CHECK — FTNT (Q1
2026)
| Metric | FTNT Value | What It Tells You | Assessment |
|---|---|---|---|
| For every $1 of revenue, $0.80 is left after direct costs. Indicates a wide Gross Margin (GAAP) 80.3% Excellent moat. | |||
| Gross Margin (Non-GAAP) | 81.0% | Adjusting for stock compensation reveals an even stronger core margin. | Excellent |
| Operating Margin (GAAP) | 31.0% | ||
| Nearly a third of revenue converts to operating profit — strong cost | |||
| discipline. | |||
| Excellent | |||
| Operating Margin (Non- | |||
| GAAP) | |||
| 35.8% | Record Q1 operating margin, up 160 basis points year-over-year. | Excellent | |
| Free Cash Flow | |||
| $1.01B | |||
| (record) | |||
| Record quarterly FCF demonstrates the business converts profits into | |||
| actual cash. | |||
| Excellent | |||
| Adjusted FCF Margin | 57.6% | ||
| Nearly 58 cents of every revenue dollar becomes free cash. Remarkable | |||
| efficiency. | |||
| Excellent | |||
| TTM FCF Margin | 34.3% | On a trailing twelve-month basis, still in the top tier of software companies. | Strong |
| Debt/Equity | 0.50 | Low leverage. The balance sheet is conservative. | Strong |
| Net Cash Position | $2.73B | Cash exceeds total debt by $2.73 billion — net cash, not net debt. | Excellent |
| P/E Ratio (TTM) | 44.2x | ||
| Premium to the market, but cheapest among pure-play cybersecurity peers | |||
| (~30x forward). | |||
| Fair | |||
| Forward P/E | 36.6x | Reasonable for a high-growth, high-margin software platform. | Fair |
| Revenue Growth (YoY) | 20% | Accelerating from prior quarters, driven by product and service strength. | Strong |
| EPS Growth (Non-GAAP | |||
| YoY) | |||
| 41% | Earnings growing faster than revenue — operating leverage at work. | Excellent |
Moat Assessment: STRONG
Cost advantage (proprietary ASICs
reduce unit cost); High switching
costs (FortiOS is embedded in
customer
networks,
making
replacement expensive and risky);
Scale
(over 730,000 customers
globally, with a direct manufacturing
and operations model); Technology
leadership (FortiOS 8.0, 20+ AI
solutions, custom silicon).
COMPETITIVE LANDSCAPE
CrowdStrike (CRWD). Cloud-native endpoint protection leader. Annual recurring revenue (ARR) of $5.25 billion. Faster topline growth but trades at ~90x forward earnings
- a significant premium. The Falcon platform is highly regarded, but CrowdStrike does not design its own silicon and lacks the integrated networking-plus-security approach.
Palo Alto Networks (PANW). The other major platform player pursuing "platformization" — consolidating point solutions. Revenue of $8.0 billion in FY24 with NGS ARR of $6.3 billion. Trades at ~55x forward earnings. Palo Alto is a formidable competitor, but Fortinet's ASIC advantage gives it a hardware-level cost edge that Palo Alto cannot easily replicate.
Zscaler (ZS). A prominent zero-trust cloud security provider. Q2 FY2026 revenue grew 26% to $816 million with ARR of $3.4 billion. Strong in cloud-delivered security but narrower in scope than Fortinet's platform.
Microsoft. A $37 billion cybersecurity business — larger than CrowdStrike, Palo Alto, and Zscaler combined. Microsoft bundles security into enterprise agreements, creating pricing pressure. However, many CISOs prefer dedicated best-of-breed security solutions over bundled offerings, particularly for firewall and network security.
RISK FACTORS
| Risk | Severity | Detail |
|---|---|---|
| Microsoft's ability to bundle security into existing enterprise Microsoft HIGH agreements could compress bundling margins for pure-play vendors over time. | ||
| Valuation | ||
| compression | ||
| MEDIUM | ||
| At 44x TTM earnings, any | ||
| deceleration in billings growth | ||
| could trigger a re-rating lower. | ||
| Geopolitical | ||
| risk | ||
| MEDIUM | ||
| International revenue exposure | ||
| means tariffs, sanctions, or trade | ||
| restrictions could impact growth. |
ASIC design cycle risk
LOW
Custom silicon requires long lead times. A misstep in the next- generation ASIC could create a gap competitors exploit.
ETF ALTERNATIVE FOR LOWER-RISK
EXPOSURE
First Trust NASDAQ Cybersecurity ETF (CIBR). This ETF tracks an index of cybersecurity companies, providing diversified exposure to the sector without single-stock risk. CIBR includes Fortinet, CrowdStrike, Palo Alto Networks, Zscaler, and other players. For investors who believe in the cybersecurity macro thesis but are not comfortable with individual stock selection, CIBR offers a way to participate in the sector's structural growth.
Global X Cybersecurity ETF (BUG). A second option with a focus on smaller pure-play cybersecurity companies, providing more concentrated exposure to the theme.
🔍 What to Watch — Fortinet Catalysts &
Warning Signs
Bullish trigger: Q2 billings growth sustains above 25%, confirming the re-acceleration is durable. Bullish trigger: Full-year billings guidance raised above $9.1B in subsequent quarters. Bullish trigger: SecOps ARR accelerates, validating the platform expansion thesis. Caution signal: Billings growth decelerates below 20%
- could indicate market saturation or competitive pressure. Caution signal: Gross margin compression below 78% sustained for two quarters. Exit signal: Microsoft or another hyperscaler begins aggressively bundling firewall-equivalent solutions at zero marginal cost.
FTNT — FORWARD GUIDANCE DETAIL (FY
2026)
| Metric | Q2 2026 Guidance | Full-Year 2026 Guidance |
|---|---|---|
| $2.09B – $2.19B $8.8B – $9.1B Billings (midpoint +20%) (midpoint +18%) | ||
| Revenue | ||
| $1.83B – $1.93B | ||
| (midpoint +15%) | ||
| $7.71B – $7.87B | ||
| (midpoint +15%) | ||
| Service Revenue | — | |
| $5.09B – $5.15B | ||
| (midpoint +12%) | ||
| Non-GAAP Gross | ||
| Margin | ||
| 79.5% – 80.5% | 79% – 81% | |
| Non-GAAP | ||
| Operating Margin | ||
| 33% – 35% | 33% – 36% | |
| Non-GAAP EPS | $0.72 – $0.76 | |
| $3.10 – $3.16 (vs. | ||
| consensus $2.91) |
ETF Alternative
II. Compass Minerals (Cmp) — Salt
& SPECIALTY FERTILIZER
INDUSTRY OVERVIEW
The Boring Business That Never Dies. Salt is one of the oldest commodities in human history — and one of the most essential. Highway deicing keeps roads safe in winter across North America, Europe, and parts of Asia. Chemical- grade salt is used in water treatment, food production, and industrial processes. Demand for salt does not go to zero. Ever. Recessions do not eliminate winter.
Specialty Fertilizers in a Food-Insecure World. Sulfate of potash (SOP) is a premium fertilizer used for high-value crops — fruits, vegetables, nuts, and turf. Unlike standard potash (MOP), SOP is chloride-free and preferred for chloride-sensitive crops. Global food demand continues to rise with population growth, and arable land per capita continues to shrink. The market for specialty fertilizers is structurally supported.
Hard Assets Are Coming Back. In a world worried about inflation, supply-chain fragility, and geopolitical disruption, physical assets — mines, mineral deposits, infrastructure — are returning to investor favor. You cannot 3D-print a salt mine. You cannot disrupt it with AI. These assets have intrinsic, tangible value that software companies simply do not possess.
INVESTMENT THESIS
A Classic Turnaround Setup. Compass Minerals has had a difficult few years — weather disruptions, excess debt, operational inefficiency, and a suspended dividend. The stock has been beaten down. That is precisely the setup we look for: a real business, temporarily out of favor, with identifiable catalysts for improvement. The "Back-to-Basics" framework introduced by management is showing early results.
Leverage Ratio Halved in 12 Months. The single most important data point in this thesis: Compass Minerals' net debt-to-EBITDA leverage ratio has improved from 4.6x to 2.7x in just twelve months. The company redeemed $150 million of its 2027 senior unsecured notes early, extending its significant debt maturity to 2028. Net debt is down $119 million year-over-year to $639 million. This is a company aggressively cleaning up its balance sheet.
•
•
•
•
•
•
First Positive Net Income Since 2023. In Q1 2026, Compass Minerals reported its first positive quarterly net income since 2023 — EPS of $0.43, smashing the forecast of $0.19. Adjusted EBITDA doubled to $65 million. The Salt segment saw revenue climb to $332 million from $242 million in the prior year. This is an inflection point.
Plant Nutrition Margin Explosion. The Plant Nutrition segment's adjusted EBITDA margin surged to 25.2% from 9.6% year-over-year in Q2 2026 — a 202% increase in adjusted EBITDA. The Ogden, Utah SOP facility is performing well following the sale of the less-profitable Wynyard operation. Portfolio simplification is working.
Structural Tightness in North American Salt. Management noted that salt inventories across the system are low following last winter, which is constructive for pricing and tender size in the upcoming deicing bid season. This is a supply-demand dynamic that favors producers.
New Board and Labor Agreements. Four new directors with relevant industrial or sector expertise were added to the Board in the past year. New collective bargaining agreements were completed at the Goderich mine and another site, designed to improve operational flexibility and efficiency. These are the "boring" moves that signal a serious turnaround effort — management is methodically removing operational friction.
- 2.7x
- NET DEBT / EBITDA Down from 4.6x one year ago
- $152M
- H1 2026 ADJ. EBITDA +32% Year-over-Year
- 25.2%
- PLANT NUTRITION EBITDA MARGIN
Up from 9.6% — 202% increase
CMP — TURNAROUND TIMELINE
FY 2024 — The Trough: Operational challenges at Goderich, excess inventory, high leverage at 4.6x, net losses, dividend suspended. Stock near multi-year lows.
FY 2025 — Back-to-Basics Begins: Management implements "Back-to-Basics" strategy. Curtails production to draw down excess inventory, releasing $145M in working capital. $125M net debt reduction achieved.
Q1 FY 2026 — Inflection: First positive net income since 2023 (EPS $0.43 vs. forecast $0.19). Adjusted EBITDA doubles to $65M. Salt revenue climbs to $332M from $242M.
Q2 FY 2026 — Confirmation: Net income $12.7M (vs. loss of $32M prior year). $150M of 2027 notes redeemed early. Leverage ratio falls to 2.7x. Plant Nutrition margin explodes to 25.2%. Wynyard SOP operation sold for $30.8M to sharpen focus on Ogden.
FY 2026 Guidance — Raised: Full-year EBITDA guided $212M–$236M (midpoint $224M). Management targets investment-grade rating (~2.5x leverage).
FINANCIAL QUALITY CHECK — CMP (H1
FISCAL 2026)
| Metric | CMP Value | What It Tells You | Assessment |
|---|---|---|---|
| Low for a software company but normal for mining/commodities. Gross Margin (Q2 2026) 18.3% Improving Improving from 15.96% in Q1. | |||
| Adjusted EBITDA Margin (H1 | |||
| 2026) | |||
| 17.9% | |||
| Up from 14.5% in H1 2025. Shows operational improvements are | |||
| translating to the bottom line. | |||
| Improving | |||
| H1 Adjusted EBITDA | $152M | Up 32% year-over-year — a meaningful acceleration. | Strong |
| Net Income (H1 2026) | $31.3M | ||
| Versus a loss of $55.6M in H1 2025. A $87M swing to positive. Inflection | |||
| point. | |||
| Inflection | |||
| Leverage Ratio (Net Debt / TTM | |||
| EBITDA) | |||
| 2.7x | |||
| Down from 4.6x one year ago. Management targets investment-grade | |||
| (~2.5x). | |||
| Improving | |||
| Net Debt | $639M | Down $119M year-over-year (16% reduction). | Improving |
| Debt/Equity | 3.39 | High — this is a leveraged turnaround. Higher risk than FTNT or MKSI. | Elevated |
| Liquidity | $379M | ||
| $74M cash + $305M undrawn revolver. Adequate cushion for | |||
| operations. | |||
| Adequate | |||
| Cash from Operations (H1) | $160.4M | Generating operating cash despite the turnaround phase. | Positive |
| Full-Year EBITDA Guidance | |||
| $212– | |||
| $236M | |||
| Midpoint $224M. Raised during Q2 earnings call — confidence from | |||
| management. | |||
| Raised | |||
| Salt Operating Earnings/Ton | $15.85 | Up 21% year-over-year. Price realization is working. | Strong |
| Plant Nutrition EBITDA Margin | 25.2% | Up from 9.6%. The Ogden focus is paying off dramatically. | Excellent |
Moat Assessment: MODERATE
Hard-asset advantage (irreplaceable
salt mines in Ontario, Louisiana, UK;
brine operation at Great Salt Lake,
Utah); Scale in North American
deicing
(one of the largest
producers);
Regulatory barriers
(mining permits are difficult and time-
consuming to obtain). Weakness:
commodity pricing exposes the
company to weather volatility and
cyclical demand.
COMPETITIVE LANDSCAPE
Intrepid Potash (IPI). A direct competitor in the potash space, though smaller in scale. Intrepid produces standard potash (MOP) and specialty products. Compass Minerals' SOP product carries higher margins and serves a different end market (chloride-sensitive crops).
K+S AG (SDF.DE). A major European salt and potash producer. Larger in absolute terms but with different geographic exposure. K+S serves European markets, while Compass Minerals dominates North American highway deicing.
Cargill Salt (Private). A significant private competitor in North American road salt. Because Cargill is privately held, direct financial comparisons are not possible, but it represents meaningful competitive pressure in the deicing market.
RISK FACTORS
| Risk | Severity | Detail |
|---|---|---|
| A mild winter directly reduces Weather deicing salt volumes. This is the HIGH dependency single largest uncontrollable variable. | ||
| Elevated debt | HIGH | |
| Debt/equity of 3.39 is high. If the | ||
| turnaround stalls, the balance | ||
| sheet becomes a liability. |
Commodity pricing
MEDIUM
Salt and potash prices are influenced by global supply- demand dynamics that Compass Minerals cannot control.
Operational execution
MEDIUM
The Goderich mine has had operational challenges. New labor agreements aim to improve flexibility, but execution risk remains.
Regulatory / mining taxes
LOW
Changes to mining regulations or taxes could increase operating costs.
ETF ALTERNATIVE FOR LOWER-RISK
EXPOSURE
VanEck Agribusiness ETF (MOO). Provides diversified exposure to global agribusiness companies, including fertilizer producers, agricultural equipment makers, and food processors. A broader way to play the food-security theme without single-stock turnaround risk.
Invesco DB Agriculture Fund (DBA). A commodities- based ETF that tracks agricultural commodity futures. For investors seeking pure commodity exposure rather than equity exposure to agricultural companies.
🔍 What to Watch — Compass Minerals
Catalysts & Warning Signs
Bullish trigger: Upcoming deicing bid season yields higher volumes and pricing (visible in Q3/Q4 results). Bullish trigger: Leverage ratio falls below 2.5x, putting the company on path to investment-grade. Bullish trigger: Dividend reinstated — would signal management confidence in cash flow sustainability. Caution signal: Mild winter significantly reduces salt volumes for a second consecutive season. Caution signal: EBITDA guidance lowered below $212M range. Exit signal: Leverage ratio increases back above 3.5x, or the company requires additional financing.
CMP — SEGMENT GUIDANCE DETAIL (FY
2026)
| Segment | Revenue Guidance | Adj. EBITDA Guidance | Key Driver |
|---|---|---|---|
| $225M – Pricing $1,025M – $240M Salt realization, bid $1,080M (midpoint season strength $233M) |
Plant Nutrition
$190M – $210M
$43M – $47M (midpoint $45M)
Ogden facility optimization, SOP demand
Corporate / Unallocated
—
($56M) – ($51M)
Interest expense lowered to $62M–$67M
Consolidated — $212M – $236M (midpoint $224M)
Raised from initial guidance
III.
MKS INSTRUMENTS (MKSI) —
SEMICONDUCTOR
MATERIALS
&
EQUIPMENT
INDUSTRY OVERVIEW
The Picks-and-Shovels of the Chip Boom. There is a global race to build semiconductor fabrication plants ("fabs"). The United States, Europe, Japan, South Korea, and India are collectively spending hundreds of billions of dollars to secure domestic chip manufacturing capacity. The CHIPS Act in the U.S. alone has catalyzed over $200 billion in announced investments. Every single one of these fabs needs precision instruments to operate.
The Analogy. If Nvidia is the racecar, and ASML is the factory that builds the racecar, then MKS Instruments makes the wrenches the factory uses. No wrenches, no factory, no racecar. This is the unsexy, invisible layer of the semiconductor supply chain — and it is absolutely essential.
AI Drives Complexity. AI chips require more advanced manufacturing processes — more layers, tighter tolerances, more sophisticated materials handling. This directly benefits companies like MKS that provide the precision gas-flow controllers, vacuum systems, plasma products, and lasers used in these processes. As chip complexity increases, so does the amount of MKS equipment required per fab.
INVESTMENT THESIS
Cyclical Company Near a Turning Point. MKS Instruments' business rises and falls with semiconductor capital expenditure cycles. The company has been through the down part of the cycle. The up part is when MKS historically generates outsized returns. With Wafer Fabrication Equipment (WFE) spending projected to reach $125 billion and potentially $170–$180 billion by 2027, MKS is positioned at the front of a multi-year upcycle.
AI Is the Accelerant. AI-related demand is driving growth across MKS's semiconductor and electronics & packaging segments. Chemistry sales related to AI-driven PCB manufacturing now account for approximately 15% of chemistry revenue, up from 10% in the prior year. The company is seeing increased complexity and layer counts in both semiconductors and advanced printed circuit boards.
•
•
•
•
•
•
Diversified Revenue Base. MKS is not a one-trick semiconductor pony. The company serves three segments: Semiconductor ($466M in Q1), Electronics & Packaging ($321M), and Specialty Industrial ($291M, including defense and datacom). Consumables and service revenue account for approximately 40% of total revenue, providing a stable recurring base.
Capacity Is Being Built. MKS has a new facility in Malaysia coming online in June 2026 to support the anticipated demand surge. Current capacity can handle $125 billion WFE plus a 25–30% surge. The Malaysia facility extends capacity through at least 2027 without requiring additional buildings.
Customer Breadth. All top 30 PCB makers globally are MKS customers. The company has design wins in enhanced precursor monitoring, ultrafast lasers for back- end semiconductor applications, and dissolved gas solutions for leading-edge nodes. This breadth reduces customer concentration risk.
$1.08B
Q1 2026 REVENUE
+15% YoY, beat consensus by $11M
$1.2B
Q2 2026 REVENUE GUIDANCE
+11% sequential, above Street
- $2.30
- NON-GAAP EPS
Beat $2.04 consensus by 12.75%
MKSI — SEGMENT REVENUE BREAKDOWN (Q1 2026)
| Segment | Q1 Revenue | % of Total | YoY Growth | Sequential | Q2 Guidance |
|---|---|---|---|---|---|
| Semiconductor $466M 43% +13% +7% $550M ± $15M | |||||
| Electronics & Packaging | $321M | 30% | +27% | +6% | $350M ± $15M |
| Specialty Industrial | $291M | 27% | +8% | -2% | $300M ± $10M |
| Total | $1,078M | 100% | +15% | +4% | $1,200M ± $40M |
Semiconductor Segment Deep-Dive. Growth was broad- based across DRAM (storage memory), NAND (flash memory), and Foundry/Logic (processor manufacturing). Particular strength was seen in vacuum and power products, and plasma and reactive gas offerings. AI is driving demand for more enterprise storage and higher layer counts in NAND, which directly benefits MKS's RF power business. As chips get more complex, more MKS equipment is needed per wafer.
Electronics & Packaging — The AI PCB Story. This segment delivered 27% year-over-year growth, led by flexible PCB drilling systems. AI-related PCB manufacturing now accounts for approximately 15% of chemistry revenue, up from 10% a year ago. Advanced AI chips require advanced printed circuit boards — more layers, tighter traces, specialized materials. MKS provides the laser drilling and chemistry solutions that make this possible. The company is also seeing strong demand for rigid PCB laser applications for low-earth-orbit (LEO) satellites.
Specialty Industrial — Defense and Datacom. Revenue of $291M grew 8% year-over-year, driven by datacom (fiber optic and networking equipment) and defense applications. While this segment is less "glamorous" than the semiconductor business, it provides diversification and stability during semi downturns.
FINANCIAL QUALITY CHECK — MKSI (Q1
2026)
| Metric | MKSI Value | What It Tells You | Assessment |
|---|---|---|---|
| Gross Margin 47.0% At the high end of guidance. Healthy for an industrial equipment company. Strong | |||
| Operating Margin (Non- | |||
| GAAP) | |||
| 21.8% | Reflects operating leverage as revenue scales. Operating income ~$235M. | Strong | |
| Adjusted EBITDA | $277M | ||
| 25.7% margin — exceeded the high end of guidance. Up from $236M in Q1 | |||
| 2025. | |||
| Strong | |||
| Revenue (Q1 2026) | $1.078B | Up 15% year-over-year and 4% sequentially. Beat consensus by ~$11M. | Strong |
| Non-GAAP EPS | $2.30 | Beat consensus estimate of $2.04 by 12.75%. Up from $1.71 in Q1 2025. | Beat |
| Free Cash Flow | $29M | ||
| Seasonally low due to variable compensation and working capital build. | |||
| Prior quarter was $91M. | |||
| Seasonal | |||
| Debt/Equity | 1.53 | Elevated due to the 2023 Atotech acquisition. Being actively reduced. | Elevated |
| Net Leverage Ratio | 3.5x | Net debt $3.6B vs. TTM EBITDA $1.0B+. Being actively paid down. | Moderate |
| Liquidity | $1.5B | $569M cash + $1B undrawn revolver. Ample cushion. | Strong |
| P/E Ratio (TTM) | 65.5x | ||
| High trailing P/E reflects trough earnings. Forward P/E of 24.8x is more | |||
| representative. | |||
| Cyclical | |||
| Forward P/E | 24.8x | Reasonable for a cyclical industrial at the start of an upcycle. | Fair |
| Q2 Revenue Guidance | $1.2B ± $40M | ||
| ~11% sequential growth. Exceeded consensus of $1.1B. Strong forward | |||
| visibility. | |||
| Above | |||
| Street | |||
| Dividend Growth | |||
| +14% to $0.25/ | |||
| qtr | |||
| Management confidence signal — raising the dividend during a growth | |||
| investment phase. | |||
| Positive |
Moat Assessment: STRONG
High
switching
costs
(MKS
instruments are deeply integrated
into fab processes — swapping them
requires requalification, which is
expensive and time-consuming);
Technology leadership
(vacuum
systems, plasma products, RF
power, precision lasers, dissolved
gas monitoring); Scale (all top 30
PCB makers are customers; serves
every major chipmaker); Diversified
end markets
(semi, electronics,
defense, industrial — reduces
cyclical risk).
COMPETITIVE LANDSCAPE
Entegris (ENTG). Provides specialty chemicals, advanced materials, and contamination-control solutions for semiconductor manufacturing. Complementary to MKS rather than directly overlapping, but competes for capex budgets.
Brooks Automation / Azenta (AZTA). Provides automation and cryogenic solutions for semiconductor manufacturing. Smaller scale and narrower product range than MKS.
Advanced Energy Industries (AEIS). Manufactures power conversion and control solutions used in semiconductor manufacturing. Competes directly in the power delivery segment.
RISK FACTORS
| Risk | Severity | Detail |
|---|---|---|
| Semiconductor equipment is deeply cyclical. A sudden Cyclicality HIGH pullback in WFE spending would directly impact revenue. | ||
| Debt |
from
Atotech acquisition
MEDIUM
The 2023 acquisition of Atotech added significant debt. Net leverage of 3.5x requires sustained earnings growth to reduce.
China/ geopolitical risk
MEDIUM
Export restrictions on semiconductor equipment to China could limit addressable market. Tariff impacts affected Q1 gross margin.
Customer concentration
LOW
Mitigated by serving all major chipmakers and top 30 PCB producers, but a slowdown from any top-3 customer would be felt.
ETF ALTERNATIVE FOR LOWER-RISK
EXPOSURE
VanEck Semiconductor ETF (SMH). The most popular semiconductor ETF, holding major chipmakers and equipment companies. Provides broad exposure to the chip boom without single-stock risk.
iShares Semiconductor ETF (SOXX). Another well-known semiconductor ETF with a slightly different weighting methodology. Includes both chip designers and equipment companies.
🔍 What to Watch — Mks Instruments
Catalysts & Warning Signs
Bullish trigger: Q2 revenue comes in at the high end of guidance ($1.24B), confirming the upcycle is accelerating. Bullish trigger: WFE spending forecasts revised above $130B for 2026 or $180B for 2027. Bullish trigger: Net leverage ratio declines below 3.0x, reducing the Atotech debt overhang concern. Bullish trigger: Malaysia facility ramps ahead of schedule, supporting gross margin expansion. Caution signal: Semiconductor equipment orders plateau or decline — visible in industry association data (SEMI, SEAJ). Caution signal: Gross margin falls below 45% for two consecutive quarters. Exit signal: Major chipmakers announce capex cuts or fab construction delays, signaling a cycle downturn.
MKSI — Q2 2026 GUIDANCE DETAIL
| Metric | Q2 2026 Guidance | Key Assumptions |
|---|---|---|
| $1.2B ± ~11% sequential growth; all Revenue $40M three segments contributing | ||
| Non-GAAP | ||
| EPS | ||
| $2.90 ± $0.30 | ||
| Versus consensus $2.37– | ||
| $2.60; |
reflects operating leverage
Adjusted EBITDA
$328M ± $26M
~18.4% sequential growth from $277M
Gross Margin
47.0% ± 100 bps
Equipment mix, VSD ramp (below-avg margins), palladium
OpEx $275M ± $5M
Higher R&D investment and seasonal compensation
Net Interest Expense
$35M
Down from $37M as debt reduction continues
Tax Rate ~20% 18–20% range for full year
CapEx
4–5% of revenue
Malaysia facility and capacity expansion
VALUATION CONTEXT — HOW DO THESE STOCKS COMPARE TO PEERS?
Fortinet vs. Cybersecurity Peers. Among major cybersecurity platform companies, Fortinet trades at the lowest forward P/E multiple: approximately 36.6x, compared to Palo Alto Networks (~55x) and CrowdStrike (~90x). This does not necessarily mean Fortinet is "cheap" — these are all premium multiples — but it does mean that relative to its growth rate and margin profile, Fortinet offers the most favorable risk-reward within the cybersecurity peer group. The company's 80%+ gross margin, 36% operating margin, and net cash position support the premium over the broader market.
Compass Minerals — Turnaround Valuation. Traditional valuation metrics (P/E ratio) are less useful for CMP because the company is emerging from losses and its earnings are volatile. The more appropriate lens is enterprise value relative to EBITDA. With a guided midpoint EBITDA of $224M for FY 2026 and declining net debt, the company trades at a modest EV/EBITDA multiple relative to its hard-asset base. The key question is not "is it cheap today?" but rather "if the turnaround succeeds and EBITDA reaches $250M+, what will this be worth?" Investors should size positions accordingly — smaller allocations for turnaround stories given the elevated risk.
MKS Instruments — Cyclical Earnings Recovery. MKSI's trailing P/E of 65.5x looks expensive, but this is misleading because it reflects trough-level earnings from the semiconductor down-cycle. The forward P/E of 24.8x — based on recovering earnings — tells a more accurate story. This is reasonable for a cyclical industrial company at the beginning of a multi-year upcycle, particularly one with a 47% gross margin and growing exposure to AI
•
•
•
•
•
•
• infrastructure. The Atotech-related debt is the primary overhang that keeps the multiple in check; as leverage declines, we would expect the multiple to expand.
PEER VALUATION TABLE
| Company | Ticker | Sector | Forward P/E | Gross Margin | Revenue Growth |
|---|---|---|---|---|---|
| Fortinet FTNT Cybersecurity ~36.6x 80.3% 20% YoY | |||||
| Palo Alto Networks | PANW | Cybersecurity | ~55x | ~74% | ~16% YoY |
| CrowdStrike | CRWD | Cybersecurity | ~90x | ~75% | ~28% YoY |
| Zscaler | ZS | Cloud Security | ~70x | ~78% | ~26% YoY |
| Compass Minerals | CMP | Salt / Fertilizer | N/A (turnaround) | 18.3% | 6% H1 Salt |
| Intrepid Potash | IPI | Potash | N/M | ~25% | Variable |
| MKS Instruments | MKSI | Semi Equipment | ~24.8x | 47.0% | 15% YoY |
| Entegris | ENTG | Semi Materials | ~30x | ~45% | ~12% YoY |
| Advanced Energy | AEIS | Semi Power | ~22x | ~40% | ~10% YoY |
| Metric | FTNT | CMP | MKSI |
|---|---|---|---|
| Sector Cybersecurity Software Salt & Specialty Fertilizer Semiconductor Equipment | |||
| Gross Margin | 80.3% | 18.3% | 47.0% |
| Operating Margin | 31.0% (GAAP) | ~6% (GAAP) | 21.8% (Non-GAAP) |
| Revenue Growth (YoY) | 20% | 6% (H1 Salt) | 15% |
| FCF or Cash Generation | $1.01B (Q1 record) | $160M (H1 ops cash) | $29M (seasonal low) |
| Debt/Equity | 0.50 | 3.39 | 1.53 |
| Net Cash / (Net Debt) | +$2.73B (net cash) | ($639M) net debt | ($3.6B) net debt |
| Forward P/E | 36.6x | N/A (turnaround) | 24.8x |
| Moat Strength | Strong (ASIC + platform) | Moderate (hard assets) | Strong (switching costs) |
| Primary Risk | Microsoft bundling | Weather / leverage | Cyclicality |
| Thesis Type | Quality compounder | Turnaround / value | Cyclical recovery |
| ETF Alternative | CIBR / BUG | MOO / DBA | SMH / SOXX |
THE BUY-AND-HOLD WARNING
Nothing Lasts Forever. We conclude this report with a critical reminder. None of these three companies will be permanent winners. The speed of technological change, competitive disruption, and macroeconomic shifts means today's opportunity will eventually become tomorrow's fading story. Smart investors — or more accurately, trained investors — understand that knowing when to sell is as important as knowing when to buy.
The Graveyard Is Full of Former Winners. Consider the stocks that were once "can't lose" names: PayPal (down ~85% from its peak), PLUG Power (down ~96%), BlackBerry (down ~77% from its meme peak), NIO (down ~91%), and Lucid (down ~97%). These were all consensus favorites. They were all "the future." Buy-and-hold destroyed the people who believed the story would last forever.
Why This Happens. The fundamental problem with buy- and-hold is that it assumes the story never changes. But stories always change. PayPal was disrupted by Apple Pay, Google Pay, and a dozen fintech startups. PLUG Power never achieved the scale economics needed to make hydrogen competitive. BlackBerry failed to adapt to the touchscreen revolution. NIO was hit by the Chinese economic slowdown and intensifying competition from BYD. Lucid could not translate beautiful design into profitable manufacturing at scale. In every case, the underlying thesis broke — but investors who had married the stock refused to acknowledge it.
The Average Decline. Across these five once-beloved names, the average decline from peak to current price is approximately 89%. That means if you invested $10,000 at the peak, you'd have roughly $1,100 left today. After years of waiting. After years of telling yourself "it'll come back." That is the true cost of undisciplined buy-and-hold.
| Stock | Peak | Approximate Decline from Peak | $10,000 Invested at Peak → Today |
|---|---|---|---|
| PayPal (PYPL) ~$310 (Jul 2021) -85% ~$1,500 | |||
| PLUG Power (PLUG) | ~$75 (Jan 2021) | -96% | ~$400 |
| BlackBerry (BB) | ~$28 (Jan 2021) | -77% | ~$2,300 |
| NIO | ~$67 (Feb 2021) | -91% | ~$900 |
| Lucid (LCID) | ~$57 (Nov 2021) | -97% | ~$300 |
| Average | — | -89% | ~$1,100 |
The Rotation Principle. Institutional investors do not buy and hold individual stocks indefinitely. They rotate — moving capital from one opportunity to the next as conditions change. This is not market timing. This is disciplined portfolio management based on fundamental research, valuation, and macro awareness. It is a learnable skill.
What to Watch For. For each of the three stocks in this report, we have identified specific triggers and risks. When the thesis breaks — when billings decelerate, when the mine underperforms, when WFE spending stalls — that is the signal to reassess. Discipline is what separates investors from speculators.
The Index Is Different. It is important to distinguish between individual stocks and broad market indices like the S&P 500. The index self-corrects: weak companies are removed and replaced by strong ones. Over long periods, the index has historically trended upward, partly because of monetary expansion. Buy-and-hold works for the index. It does not reliably work for individual stocks. Understanding this distinction is one of the most important lessons in investing.
HOW TO USE THIS REPORT
This Is a Starting Point, Not a Conclusion. This report provides our analysis of three companies based on publicly available data, recent earnings reports, and fundamental quality screening. It is designed to educate and inform — not to replace your own due diligence. Every investor has different risk tolerance, time horizons, and financial goals.
Step 1: Understand the Thesis. For each stock, make sure you can articulate — in your own words — why the opportunity exists and what has to go right. If you cannot explain the thesis to a friend in three sentences, you do not understand it well enough to invest.
Step 2: Know the Risks. Read the risk factors section carefully. Every investment has risks. The question is not whether risks exist, but whether the potential reward justifies the risks — and whether you can tolerate the downside if things go wrong.
Step 3: Watch the Triggers. We have provided specific catalysts and warning signs for each stock. These are the data points that will tell you whether the thesis is playing out as expected or breaking down. Set alerts. Follow earnings. Read transcripts. Stay informed.
Step 4: Have an Exit Plan. Before you buy any stock, decide in advance what would cause you to sell. Write it down. This is not pessimism — it is discipline. The investors who suffered 89% average losses in PayPal, PLUG, BlackBerry, NIO, and Lucid did not have exit plans. Do not repeat their mistake.
Step 5: Consider the ETF Alternative. If any individual stock feels too risky, remember that we have provided ETF alternatives for each sector. ETFs diversify away single- stock risk while still giving you exposure to the macro themes we believe are compelling.
Learn Wall Street's 3 Simple Rules at felixfriends.org/getfree
Join the free live seminar: "Why Buy & Hold Is Dead in 2026"
Disclaimer
This report is for educational purposes only and does not constitute financial advice. It is not a recommendation to buy or sell any securities. All investments involve risk, including the loss of principal. This report is FTC compliant. Past performance is not indicative of future results.