
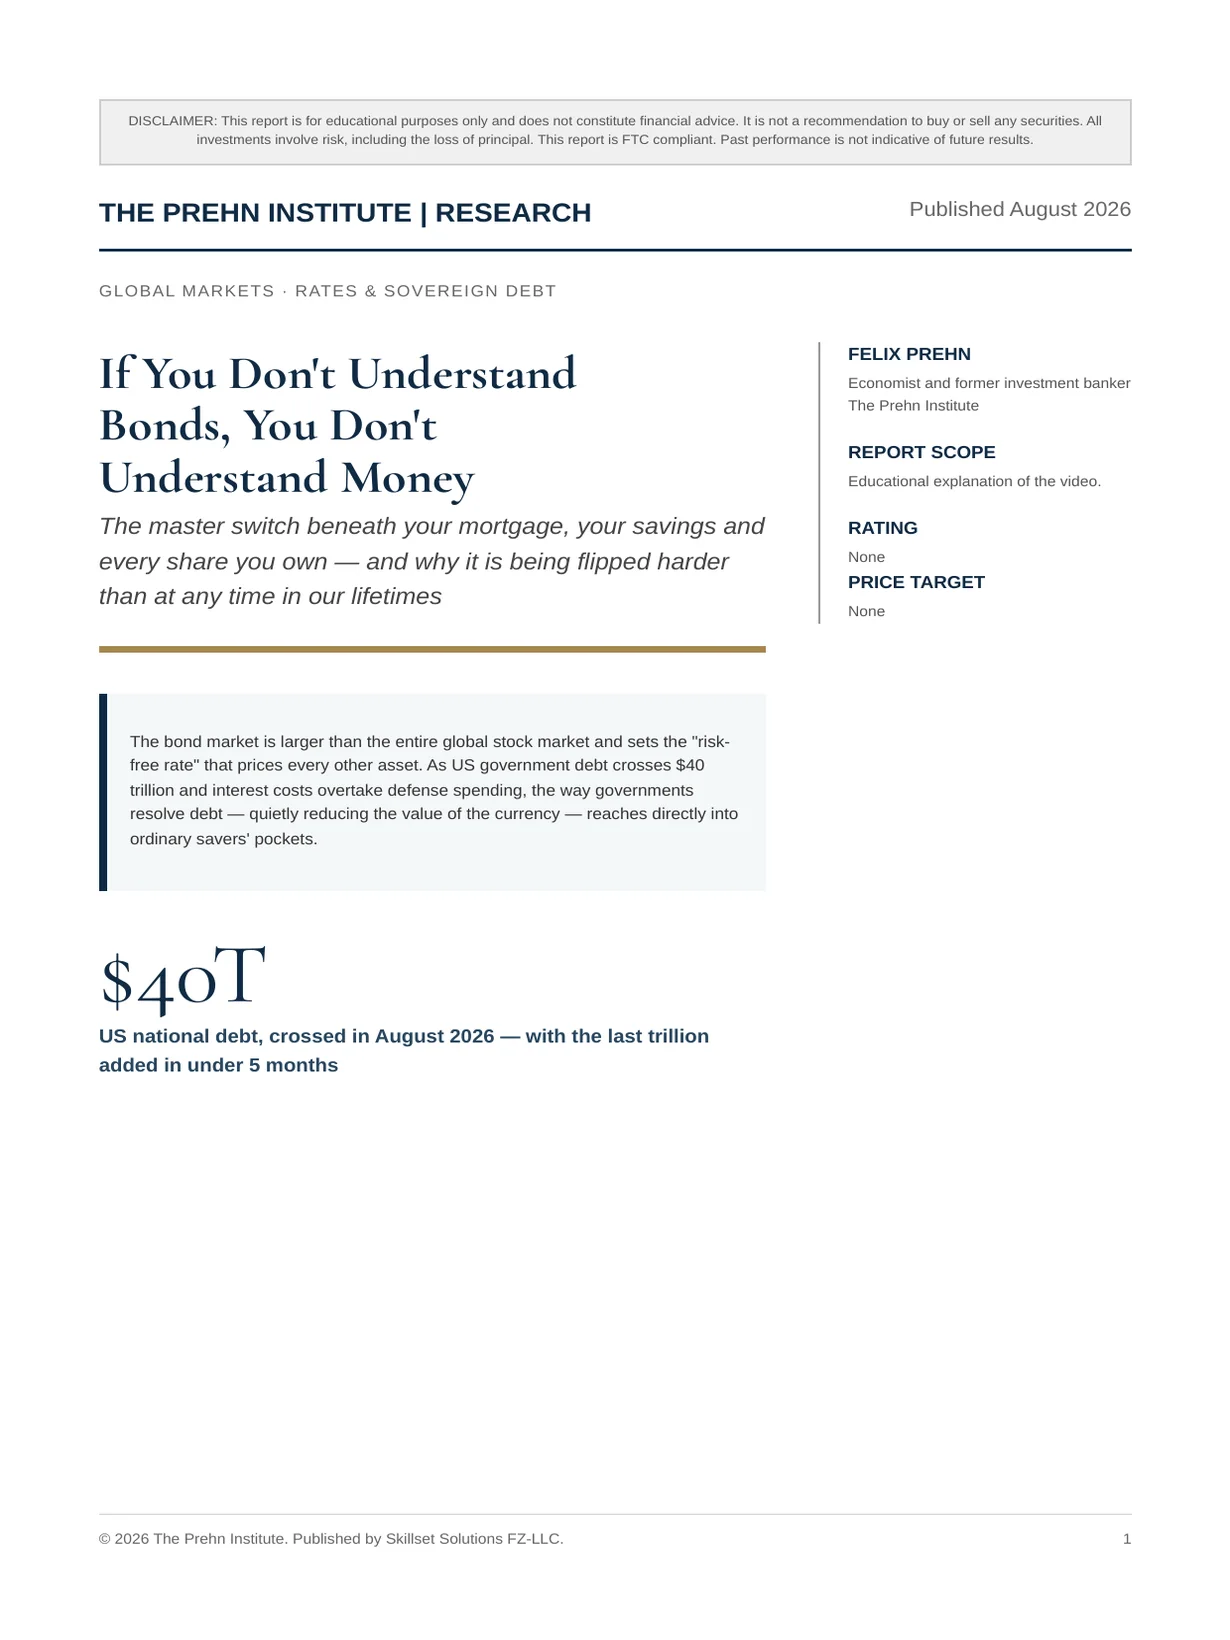
If You Don't Understand Bonds, You Don't Understand Money
The master switch beneath your mortgage, your savings and every share you own — and why it is being flipped harder than at any time in our lifetimes
Felix Nikolas Prehn · 31 August 2026 · 13 pages
Bottom line
The bond market is larger than the entire global stock market and sets the "risk-free rate" that prices every other asset. As US government debt crosses $40 trillion and interest costs overtake defense spending, the way governments resolve debt — quietly reducing the value of the currency — reaches directly into ordinary savers' pockets.
$40TUS national debt, crossed in August 2026 — with the last trillion added in under 5 months
Bottom Line
The master switch under everything
Bottom line. Bonds are loans. Their yields set the baseline return every other investment must beat, so when yields move, the price of every risky asset — shares, property, crypto — is quietly repriced, often with no company news at all.
- Bond yields move
- The risk-free rate resets
- Every other asset is repriced
The size
Bonds are bigger than stocks. The global bond market is worth roughly $161 trillion, larger than the roughly $158 trillion global stock market. It is where the largest, best-informed money on the planet lives.
The mechanism
Price and yield move opposite ways. When rates rise, existing bond prices fall and effective yields rise. That single seesaw is the heartbeat of the global economy.
The strain
The biggest borrower is trapped. US debt has crossed $40 trillion, and interest now costs more than the entire military — a self-reinforcing spiral of borrowing to pay interest.
The consequence
Currencies pay the bill. Japan already shows the endgame: a central bank buying up half the national debt with printed money, and the currency quietly weakening. Since 1971 the US dollar has lost roughly 87% of its purchasing power.
Start Here
What a bond actually is
Bottom line. A bond is just a loan. Instead of borrowing from a bank, a government or company borrows from you, promising interest along the way and your money back on a set date.
- You lend $1,000 today (you are the lender)
- The borrower pays you interest each year
- You get your $1,000 back on a set date — the bond is the IOU
Who borrows
Governments and companies. When the US government needs money, it sells bonds. Buyers include pension funds, insurers, banks and other countries.
Why it matters
This is where serious money parks. Large, cautious institutions do not buy meme stocks with hundreds of billions. They buy bonds — which is why the bond market tends to tell the truth about the economy.
The One Idea To Remember
Price and yield move opposite ways
The seesaw
When one goes up, the other goes down. If you own a bond paying 2% and new bonds now pay 5%, nobody wants your old one — so its price falls. As the price falls, the effective yield rises to match the market.
And in reverse
Fear pushes prices up. When investors rush to safety, they bid up bond prices, and yields drop. Price up, yield down.
Why you should care
This seesaw sets the cost of money. It flows through to mortgages, car loans, credit cards and the value of shares — the whole economy runs on it.
| What happens | Bond price | Yield |
|---|---|---|
| Interest rates rise / new bonds pay more | Falls | Rises |
| Investors panic and rush to safety | Rises | Falls |
Risk-Free Rate & Spread
How bonds price everything else
Bottom line. US government bonds are treated as the safest place on Earth, so the interest they pay becomes the "risk-free rate" — the floor every other investment must beat. When that floor rises, money drains out of risky assets.
The risk-free rate
The floor for the whole planet. If a safe government bond pays 5% for doing nothing, a risky stock must promise much more to be worth it. Raise the floor and risky assets get repriced downward.
The mystery solved
Why your portfolio drops on quiet days. A red day with no bad company news is often the master switch — yields moved, the risk-free rate ticked up, and every risky asset was quietly repriced.
The spread
The early-warning system. The spread is the extra interest shakier borrowers must pay over the safe government rate. It is small in good times and widens when fear creeps in.
Ahead of stocks
Bonds smell trouble first. Widening spreads have flagged nearly every modern crisis weeks or months before the stock market panicked.
The Biggest Borrower On Earth
$40 trillion — and the interest is the trap
- $40T
- US national debt
- ~$1T
- annual interest — more than defense
- ~$3B
- interest per day
The speed
A trillion in under 5 months. The debt went from $39 trillion in March 2026 to $40 trillion in August 2026 — roughly $117,000 for every American.
The trap
Borrowing to pay interest. More debt means more interest, which means more borrowing. Much of the debt is short-term and must be rolled over at today's higher rates.
Three ways out
Only one is realistic. Grow fast enough to outrun it (near impossible at this size); default (unthinkable); or inflate it away — reduce the value of the dollar and repay in cheaper money.
Why it is yours
Door three is the quiet one. Shrinking the value of the dollar to shrink the debt also shrinks the value of your savings. You are part of the bill.
| Expense | Scale | Note |
|---|---|---|
| Net interest on the debt | ~$1 trillion / year | 2nd largest federal outlay |
| National defense | Less than interest | Interest now exceeds it |
The Canary In The Coal Mine
Japan is a decade ahead on this road
- ~200%
- Japan debt-to-GDP — highest in the developed world
- ~120%
- US debt-to-GDP
- ~50%
- of all JGBs owned by the central bank
How it survived
The central bank became the buyer. When investors would not hold Japan's bonds at low rates, the Bank of Japan created money and bought them. At its peak it owned more than half of all Japanese government bonds; it still holds roughly half.
The widowmaker
Betting against it destroyed traders. Shorting Japanese bonds failed so reliably it earned the nickname "the widowmaker."
The price
The currency pays. The yen weakened, and ordinary Japanese savers watched their spending power quietly erode.
The pattern
Debt, then printing, then the currency. First the debt piles up; then interest becomes unpayable; then the central bank prints and buys; then the currency pays the price. Keep your eye on Japan.
Where Your Purchasing Power Goes
The quiet wealth transfer
Bottom line. When a government resolves its debt by reducing the value of its currency, the cost falls on whoever holds that currency — savers. Economists call it inflation; in practice it is a transfer of wealth from cash-holders to the issuer of the debt.
- −87%
- US dollar purchasing power lost since 1971
- 12¢
- what a 1971 dollar buys today
- 1,000+t
- gold bought by central banks in 2024
The proof
Since 1971. When the dollar's last link to gold was cut, its slow dilution began. A 1971 dollar now buys roughly 12 cents' worth of goods. The money was not stolen — it was diluted.
What the printers do
They buy gold. Central banks bought over 1,000 tonnes of gold in 2024 (a third straight year above 1,000t) and about 863 tonnes in 2025 — well above the roughly 473-tonne average of the 2010s.
Why gold
It cannot be printed. No central bank can create more gold with a button. "Follow what can't be printed" is the idea behind the biggest, best-informed money quietly moving.
Purchasing-power figures: US Bureau of Labor Statistics. Central-bank gold: World Gold Council.
Turn Understanding Into Process
What it means for you
Cash is not safe
It is a slow bleed. The number in your account stays still while its purchasing power quietly erodes. Keep an emergency buffer, but understand that excess long-term cash is designed to lose.
Gold is insurance
Not a lottery ticket. The point of gold is to hold value when paper money does not — the escape hatch civilizations and central banks keep returning to. You buy insurance to be protected, not to get rich.
Watch the switch
Yields and spreads. Rising yields mean pressure on everything risky. Widening spreads mean the bond market is signalling fear — usually before stocks notice.
- Do I have three to six months of expenses available without selling investments?
- Am I holding so much long-term cash that inflation is quietly eroding it?
- Do I own any insurance against currency debasement, such as gold?
- Am I watching bond yields and credit spreads, not just stock prices?
- Would a sudden repricing force me to act, or give me choices?
Disclaimer
This report is for educational and informational purposes only and does not constitute financial, investment, legal, tax or accounting advice. It is not a recommendation, solicitation or offer to buy or sell any security, currency, commodity or financial product. No buy/sell rating or price target is provided. All investments involve risk, including the possible loss of principal. Market events, relationships and historical comparisons described here may not repeat. Illustrations simplify complex systems and may omit factors. Readers should conduct their own research and consult appropriately qualified professionals before making financial decisions. Past performance is not indicative of future results. The Prehn Institute makes no guarantee regarding outcomes.