
The Bond Market Is Breaking
A congressman, a Treasury Secretary who would not say no, one line from Morgan Stanley, and the date to write down
Felix Nikolas Prehn · 13 October 2026 · 18 pages
Bottom line
America is paying more to borrow for 10 years than at any time since 2002. The government is buying back its own bonds to hold the price up, a congressman has asked about it on the record, and the Senate has written to ask whether the nation's cash balance is next. And on 4 November the Treasury may quietly stop selling some of its longest debt. Morgan Stanley has told its biggest clients what this adds up to. This report shows you the same line, and the three boring things to do about it.
5.2%what the US government now pays to borrow for 10 years, the most since 2002
Bottom Line
The loop nobody is talking about
Bottom line. The stock market is busy with AI. The bond market is busy with something else. The yield on the 10 year US bond is about 5.2%, the 30 year about 5.6%, and the Treasury has spent the autumn trying to hold those numbers down with buybacks. And it has not worked. And the reason it has not worked is the AI build-out itself. Data centres are buying every memory chip on earth, that shows up in inflation, inflation keeps rates high, and high rates push the interest the government pays above the rate the economy grows. Morgan Stanley calls that moment R above G. On its numbers it arrives by 2030. And then the debt feeds on itself.
- AI capex pushes inflation up
- Inflation keeps interest rates high
- Rates rise above growth, debt feeds on itself
- The only prop left is 7 share prices
The trigger
A question in Congress. In mid September a congressman asked the Treasury Secretary, on the record, whether the government is propping up its own bond market. The answer was that the buybacks had worked, and that more tools were available. So ask yourself two things. If it worked, why the tools?
And if you need the tools, what was the intervention for?
The chain
The price of money is set by the bond market, not the government. Your mortgage, your car loan and your pension fund's maths all stand on that floor. So when the floor rises, everything standing on it rises too. Britain and Germany feel it next, because money goes where it is paid most.
The date
4 November. That is when the Treasury publishes its refunding statement. And Citi expects it to cut sales of 20 and 30 year bonds and sell short term bills instead. Nobody wants to lend to America for 30 years at a price America can afford.
So America may borrow 3 months at a time instead, and hope.
What to do
Three boring things. Find out how much of your money is riding on AI. Check your companies for debt, because R above G hurts borrowers first. And stop treating long bonds as the safe bit, because the safe bit has halved since 2020.
What The Bond Market Is Telling You
The price of money
- 5.2%
- 10 year US Treasury yield, highest since 2002
- 5.6%
- 30 year US Treasury yield
- 2007
- the last time money cost this much, the year before house prices broke
The American government borrows by selling bonds. A bond is an IOU. You hand over $1,000 today, the government hands it back in 10 years, and in between it pays you interest.
That interest is the yield. And the yield is set by the buyers, not by the Treasury. You do not get a say either. So if lenders want more before they will lend, the yield goes up. Simple as that.
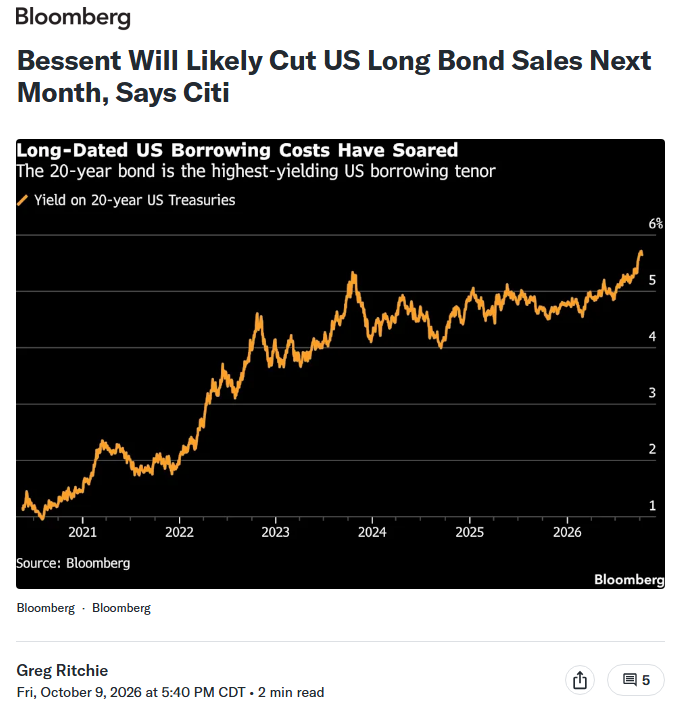
The 10 year is now about 5.2%. The 30 year is about 5.6%. And the 20 year is the dearest money the US government has borrowed in a generation.
Bloomberg's chart of it runs from under 1% in 2020 to nearly 6% today.
Why it is your floor
The yield on a government bond is the price of money. It is the floor under every other interest rate in the economy. Your mortgage is priced off it. Your savings rate too. So is your car loan.
So is the loan your employer takes to build the next factory, and the sum your pension fund uses to decide whether it can pay you what you were promised. So when the floor rises, everything standing on it rises with it. Including yours.
And it is Britain's floor too, and Germany's. When America pays 5% to borrow, money that would have lent to Britain at 4% goes to Washington instead, until Britain pays up. The 30 year gilt is at its highest since the 1990s for exactly this reason. So if you are in Britain, this is your floor too.
Who is still buying
Fewer people than before. For 30 years the biggest foreign buyer was Japan, because Japanese bonds paid nothing. But now the Bank of Japan is raising rates, Japanese bonds pay something again, and Japanese money is going home.
And the Federal Reserve, which bought trillions after 2008 and again in 2020, has stopped. So the buyer of last resort for American government debt, right now, is the American government. Think about that.
The Intervention
The hearing, and the house
In August the Treasury doubled what it calls its buyback programme. A buyback means the Treasury goes into the market and buys its own older bonds, with money raised by selling new ones. Officially it is about liquidity. Unofficially, it is about price.
And Wall Street read it as the government trying to hold its own borrowing costs down. The Treasury Secretary said liquidity in the 30 year bond was very poor and that yields did not reflect fundamentals. In plain English: we think the market is wrong, and we are going to lean on it.
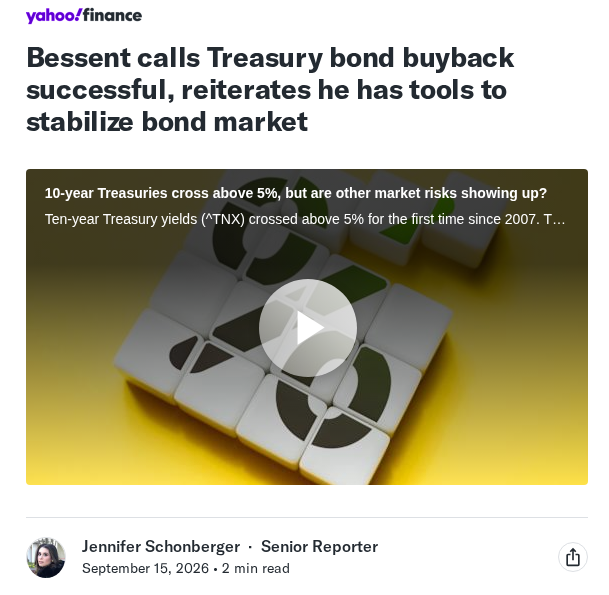
Then in mid September, Congressman Jim Himes asked him in a public hearing whether it had worked. Because the 10 year had gone through 5% that very week, buybacks and all. And the answer was yes, it was successful, you have to consider what would have happened without it, and we have more tools.
Then, that same month, he told bond traders: “I am the house now. You can bet against me if you want.” So they did. On 1 October the 10 year hit its highest level since April 2002, and the Treasury spent its full $6bn buyback allowance that same day.
The question inside the answer
If the intervention worked, why do you need more tools? And if you need more tools, what was the intervention for? Senators have since written to the Treasury asking whether it plans to run down the government's own bank account to fund bigger buybacks.
And you do not ask that question about a market that is working.
The Next Move
4 November: borrowing shorter and hoping
On Friday, Bloomberg reported the next move. Citi expects the Treasury to cut its sales of 20 and 30 year bonds at the November refunding, possibly to scrap the 20 year entirely, and to fill the gap with short term bills. A bill is an IOU that comes due in under a year.
In plain English: nobody wants to lend to America for 30 years at a price America can afford, so America will borrow for 3 months at a time instead. And that looks cheaper this quarter. But it means the government has to come back to the market every few months and ask for the money again, at whatever rate the market demands that day.
It is the national equivalent of paying your mortgage with a credit card because the card rate looked lower this month.
The Treasury Secretary spent years attacking his predecessor for doing exactly this. Now he is doing it. Because there is no better option.
The date to write down
4 November is when the Treasury publishes its refunding statement, the document that says how much it will borrow and for how long. If the long bond sales are cut, or the 20 year quietly disappears, the financial press will file it as a technical footnote. But it is not.
It is the moment the world's biggest borrower admits it can no longer sell its longest debt at a price it is willing to pay.
Where the risk goes
The bills that replace those long bonds have to be bought by someone too. Mostly money market funds, which is where you probably keep your cash. So the risk does not disappear.
It moves from a 30 year bond held by a pension fund to a 3 month IOU held by you. So you carry it now.
Where It Touches Your Money
The safe bit that halved
- About half
- what TLT, the long bond fund, has lost from its 2020 peak
- 1.5%
- roughly what a 30 year bond paid at the 2020 top
- 40 years
- the falling rate tailwind, 1981 to 2021, that made buy and hold work
The thing most people hold as the safe part of their portfolio, the part the adviser said would protect them when shares fall, is long dated government bonds. There is a fund for that, TLT. You may well own it. From its top in 2020 it has lost roughly half its value.
Half. That is your safe bit.
And when the Treasury stops selling long bonds because the price is embarrassing, the loss does not go away. It tells you the loss was real.
Why the old rules stopped working
Most of us were taught to handle money by people who learned in a world that has gone. Buy the index. Buy and hold. Do not look at it.
Put 40% in bonds as you get older. It worked for the previous generation because interest rates fell for 40 years straight, from 1981 to 2021, and a falling rate lifts the price of everything. But that tailwind ended in 2022.
What you are watching in the bond market is the bill for it arriving.
So what replaces buy and hold is a skill. Watch where the professional money is moving, and move with it, instead of marrying one position and hoping. And nobody at the pension fund is going to learn it for you. That is on you now.
R Versus G
The one line Morgan Stanley sent its clients

The report is written by Morgan Stanley's global economics team for institutional clients, the pension funds and sovereign wealth funds. It runs to about 60 pages, most of them tables. You do not need the tables. But one relationship sits on the front page.
They call it R versus G.
R is the interest rate the government pays on its debt. G is the growth rate of the economy. And whether a country's debt is sustainable comes down to which number is bigger. That is it.
If the economy grows faster than the interest on the debt, the debt shrinks as a share of the economy on its own. That is how America got through the 1950s with a war debt almost as big as today's, and how it got through the last 15 years. Growth beat interest.
So nobody had to be disciplined.
Put numbers on it
Say the economy grows 4% a year in cash terms and the government pays 3% on its debt. Every year the debt ratio drifts down by itself. Now flip it.
The economy grows 4%, the government pays 5%. Every year the debt gets 1% bigger relative to the economy before a single dollar is spent on anything. So to stand still, the government has to run a surplus.
America has not run one since 2001.
And 2030 is the good case. The same report says the probability of a recession before 2030 is high. And if one arrives, it says, American debt could fall into “risk frameworks that have historically been more closely associated with emerging markets.” On their numbers US debt passes 140% of the economy by 2030 and 160% by 2040.
Now connect that to the buybacks. The whole game for the Treasury is to keep R below G. That is why it is buying back bonds. That is why it is cutting long bond sales.
But there is a reason it is not working, and it is not the war and it is not tariffs. It is the one thing everybody thinks will save the economy.
The AI Inflation Loop
The thing that was supposed to save us
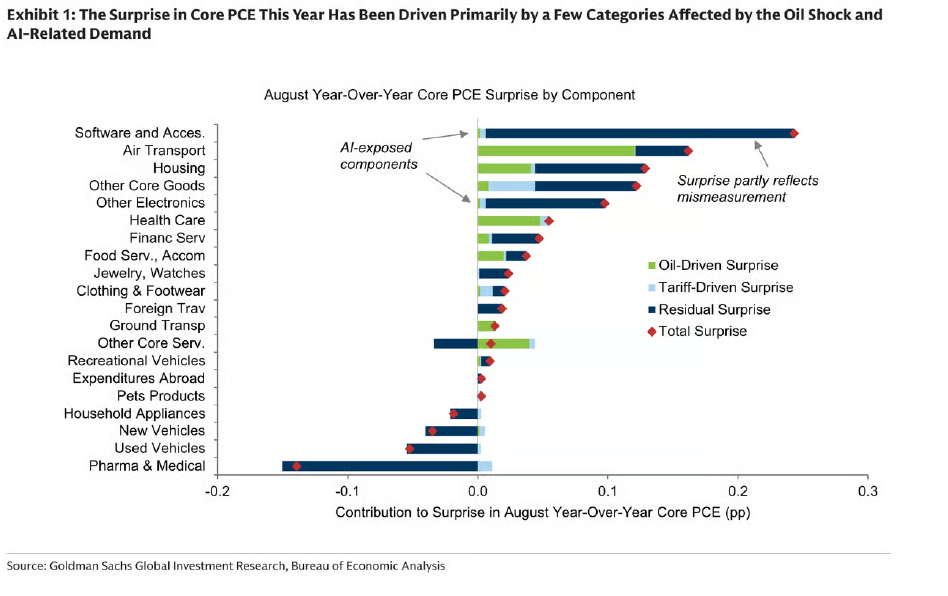
In January, Goldman Sachs forecast core inflation of 2.3% by August. It came in at 3%. A big miss. So Goldman published a post-mortem, and the biggest single cause on its own chart is AI.
Not oil. Not tariffs. Chips, laptops, memory and software.
The data centres are buying every memory chip on earth, which means the chip in your phone costs you more, which shows up in the inflation numbers, which keeps rates high. Computer software prices are rising for the first time since 1998. For 28 years technology got cheaper. Now it does not.
And the Fed has noticed. The minutes of its September meeting name the AI build-out for the first time: “surging AI-related investments were contributing to inflation pressures.” All 19 officials backed the rate rise. The head of the San Francisco Fed went further.
The big technology companies, she said, “aren't very interest rate sensitive.”
The problem in one sentence
The Fed's only real tool is to make borrowing dearer so that people spend less. But the companies driving this inflation do not borrow to build. They pay cash. Microsoft, Google, Amazon, Meta and the rest are spending around $800bn this year on data centres, and JPMorgan puts next year above $1tn, mostly out of cash.
A higher rate is a rounding error to them. It is not a rounding error to you. So the Fed raises rates, the data centres keep building, memory prices keep rising, and the rate rise lands on everyone else. On your mortgage.
On your employer. On the small business down the road. On the government's own debt, which takes us back to R versus G.
And you feel it even if you cannot name it. The New York Fed's survey shows people expect 3.9% inflation over the next year, the highest since May 2023. The next iPhone is reported to be $300 dearer because of memory prices.
Nobody told you, standing in the Apple shop, that you are paying for a data centre in Texas. But you are.
Concentration
Everyone buying the same thing
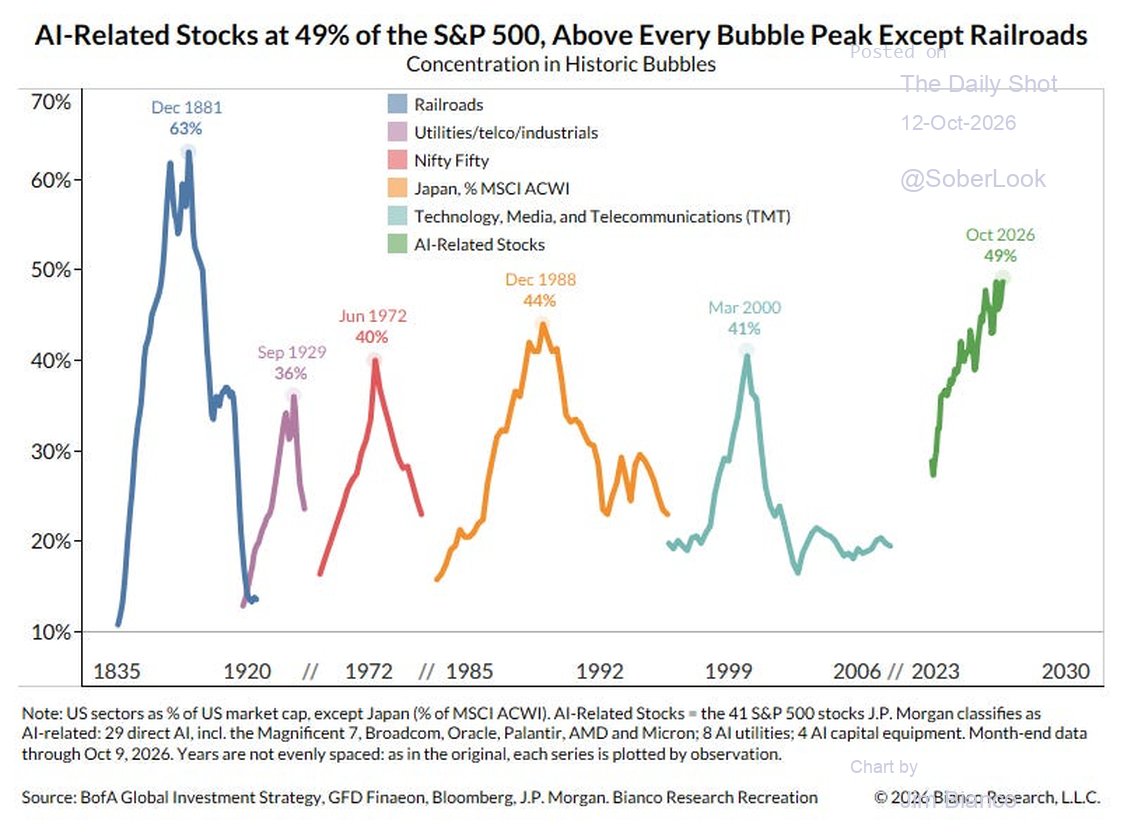
- 63%
- railroads, 1881
- 41%
- technology and telecoms, 2000
- 49%
- AI related companies in the S&P 500 today
In 1881 it was railroads, 63% of the market. In 1929, utilities, 36%. In 1972 the Nifty Fifty, 40%.
In 2000, technology and telecoms, 41%. And today AI related companies are 49% of the S&P 500. Higher than 1929.
Higher than 2000. Only the railroads were bigger. Think about what that means.
There is a word for every pension fund, sovereign wealth fund and index tracker on earth piling into the same 7 companies. It is a bubble. That is the definition. A bubble is not a judgement about whether the technology is real.
The railroads were real. They built the country. And the people who bought railroad shares in 1881 still lost most of their money, because the price had stopped being about railroads and had become about everybody else buying railroads.
If you own an index fund, you own this
Half of your S&P 500 tracker is now one bet. Half. You did not choose that. The index chose it for you. Because the index buys whatever has already gone up.
It is wonderful on the way up and has no brakes on the way down. And in 2000 it took 13 years to get back to where it started. Thirteen.
And the smart money knows. Temasek, Singapore's $405bn sovereign fund, said last week the biggest risk for 2027 is “the unwinding of the AI trade,” and that it wants its AI holdings in public markets so it can pivot quickly. Pivot is the polite word. They mean sell.
What You Actually Do
Three boring things, which is why they work
- 1. Find out what you actually own
- 2. Check your companies for debt
- 3. Stop treating long bonds as the safe bit
First, what you do not do
You do not sell everything and sit in cash. Cash at 3% inflation is a slow leak, and the people who went to cash in 2022 missed the best 3 years in a decade. So panic is a strategy.
It is just a bad one.
One: what you own
Most people have no idea how much of their money is riding on AI. You probably do not either. An S&P 500 fund is about half. A Nasdaq fund is more.
A world index is still about a third, because the world index is mostly America. Every fund publishes its top 10 holdings on a 1 page factsheet. So add up the AI names and write the number down.
If it is higher than you would have chosen on purpose, you have learned something important about your own money in 5 minutes.
Two: the danger zone
In a world where R is above G for the government, R is above G for a lot of companies too. And the ones that borrowed cheap money in 2020 get hurt when they refinance at today's rates. The Winston app has a filter for this. Felix calls it the danger zone, and you can run your own names through it.
Nvidia has almost no debt and a mountain of cash, so if the AI trade unwinds the share price takes a beating but the business is still there the next morning. Oracle is borrowing tens of billions to build data centres for other people's AI. When money costs 5.6% for 30 years, that is a different race.
The app flags it. You can see it in a minute. Thousands of companies are in that zone, and most of the people who own them do not know, and you may be one of them, because nobody reads the balance sheet while the share price is going up.
Three: the safe bit
TLT has halved. If you bought a 30 year bond at 1.5% in 2020, you have lost more than most stocks. So there is no safe asset any more.
What keeps you safe is knowing what you own, and having a rule for when to leave. That rule is the skill. And it takes practice. More than one video can give you.
Turn Understanding Into A Plan
Before 4 November, ask yourself
- Do I know everything I own, in one place, including old pensions and workplace schemes?
- How much of it, added up from the factsheets, is riding on the 7 AI names?
- Which of the companies I own borrowed cheap in 2020 and now have to refinance at 5% or more?
- How much of my “safe” money is in long dated bonds that have already halved?
- What is my rule for when to leave a position, written down, before I need it?
In 12 months there will be 2 kinds of people. The ones who read a headline about yields hitting a new high and wonder why nobody warned them. And the ones who were calm, because they took 2 hours on a Saturday to learn the skill.
Disclaimer
This report is for educational and informational purposes only and does not constitute financial, investment, legal, tax or accounting advice. It is not a recommendation, solicitation or offer to buy or sell any security, currency, commodity or financial product. No buy or sell rating or price target is provided.
All investments involve risk, including the possible loss of principal. Market events, relationships and historical comparisons described here may not repeat, and figures cited are drawn from the video's source materials rather than refreshed with independent research. Illustrations simplify complex systems and may omit factors.
Readers should conduct their own research and consult appropriately qualified professionals before making financial decisions. Past performance is not indicative of future results. The Prehn Institute and Winston make no guarantee regarding outcomes.