
BofA Flow Show: The Bidterms Explained
A Plain-English Breakdown of Bank of America's Most-Watched Weekly Market Intelligence Report
Felix Nikolas Prehn · 18 May 2026 · 33 pages
Bottom line
DISCLAIMER: This report is for educational purposes only and does not constitute financial advice. It is not a recommendation to buy or sell any securities. All investments involve risk, including the loss of principal. This report is FTC compliant. Past performance is not indicative of future results.
Overview
Copyright The Prehn Institute. Educational purposes only — not financial advice.
Disclaimer & Important Notices
DISCLAIMER: This report is for educational purposes only and does not constitute financial advice. It is not a recommendation to buy or sell any securities. All investments involve risk, including the loss of principal. This report is FTC compliant. Past performance is not indicative of future results.
Educational Purpose Only
This document is an independent educational
breakdown produced by The Prehn Institute. It is designed to help everyday investors understand the content and terminology used in professional institutional research — specifically the Bank of America "Flow Show" report dated 14 May 2026, authored by Michael Hartnett and his team at BofA Global Research.
This report does not reproduce the original BofA document in its entirety. It summarises, explains, and contextualises the public data and insights contained within it for purely educational purposes.
Not Financial Advice
Nothing in this document constitutes, or should be construed as, financial, investment, legal, or tax advice. The The Prehn Institute analyst ("Winston") is providing educational commentary only. You should always consult a qualified and regulated financial adviser before making any investment decisions.
Investing in financial markets involves significant risk, including the possible loss of your entire principal investment. The value of investments can go down as well as up. Past performance — whether of funds, indices, strategies, or individual securities — is not a reliable indicator of future results.
Source Attribution
All data, statistics, indicators, and market observations referenced in this breakdown are sourced from the Bank of America Global Research publication: "The Flow Show — The Bidterms" (14 May 2026), authored by Michael Hartnett, Anya Shelekhin, Myung-Jee Jung, and Jessica Guo at BofA Securities. Flow data is sourced from EPFR Global. Private client data is sourced from BofA's Global Wealth and Investment Management (GWIM) division.
The Prehn Institute and the analyst "Winston" have no affiliation with Bank of America, BofA Securities, or any of their affiliates. No endorsement by those entities is implied or should be inferred.
Third-party Data
Market prices, returns, and flow data cited in this document reflect figures as reported by BofA Global Research as of 13–14 May 2026. All data is subject to revision. The Prehn Institute does not independently verify the accuracy of the underlying data provided in the source document.
Conflicts of Interest
The Prehn Institute receives no compensation from Bank of America, any securities issuer, or any financial institution in relation to this report. The sole commercial relationship disclosed is the call- to-action at the end of this document for the Goat
Copyright The Prehn Institute. Educational purposes only — not financial advice.
FTC Compliance
This report fully complies with the Federal Trade Commission's guidelines on endorsements and testimonials. No performance claims, guarantees, or projections are made regarding the investment outcomes of any reader. All statements of market data are clearly attributed to their source.
Any claims about Felix Prehn's background or The Prehn Institute's student reach are based on publicly available information. No claims are made regarding student investment performance.
Copyright Notice
This educational breakdown is Copyright © 2026 The Prehn Institute. The underlying source data and research is Copyright © 2026 Bank of America Corporation. Reproduction or redistribution of either document without express written consent of the respective copyright holders is prohibited.
Copyright The Prehn Institute. Educational purposes only — not financial advice.
Section 1 • Background & Context
What is the Flow Show — and Why Should You
Care?
Bottom Line:
The BofA Flow Show is a weekly report by Bank of America's top strategist, Michael Hartnett. It tracks where hundreds of billions of dollars are moving across global markets every week. By understanding those flows, even a beginner investor can gain a significant edge over the crowd — and this week's edition contains some of the most urgent market warnings we've seen in years.
The Flow Show in Plain English
Every week, Bank of America's Global Research team publishes what is arguably the most closely watched piece of market intelligence on Wall Street: The Flow Show. Written by Chief Investment Strategist Michael Hartnett, it tracks the movement of money across every major asset class — stocks, bonds, commodities, currencies, and crypto.
Think of it like a weekly X-ray of the global financial system. Instead of asking "What are people saying?" about markets, the Flow Show asks the far more powerful question: "What are people actually doing with their money?"
The difference matters enormously. Words are cheap. Capital flows tell the truth.
WHY THIS MATTERS FOR YOU Institutional investors — pension funds, hedge funds, sovereign wealth funds — collectively manage tens of trillions of dollars. When they move money en masse, markets move. The Flow Show gives you a weekly window into that activity before most retail investors even know it's happening.
WHO Is Michael Hartnett?
The Oracle of Wall Street. Michael Hartnett is Chief Investment Strategist at BofA Securities, one of the world's largest investment banks. His weekly Flow Show has been published for many years and is required reading at the world's largest hedge funds, pension funds, and family offices.
Hartnett is known for his willingness to call out bubbles and risks early — often well before the consensus changes. His Bull & Bear Indicator (explained in Section 6) is one of the most- watched sentiment gauges in professional finance.
Copyright The Prehn Institute. Educational purposes only — not financial advice.
Crucially, Hartnett is not a perma-bear. He calls markets as he sees them — which is why when he flashes a warning, the entire investment community takes notice. This week's report contains multiple such warnings.
What Are "the Bidterms"?
This week's edition is titled "The Bidterms" — a clever play on the US midterm elections coming in November 2026. "Bid" in markets means buying pressure (a "bid" for an asset). Hartnett's thesis is that investors are currently bidding up stocks and commodities to maximum levels as they position ahead of the November elections.
The political cycle matters. US midterm elections historically create predictable patterns in markets. Presidents want growth and rising asset prices heading into elections. Institutional investors who understand this position early — and that is exactly what Hartnett is documenting this week.
THE REPORT TEAM This edition of The Flow Show was authored by: Michael Hartnett (Lead Strategist), Anya
ShelekhinMyung-Jee JungJessica Shelekhin, Myung-Jee Jung, and Jessica
Guo — all Investment Strategists at BofA Securities in New York.
The Weekly "Scores on the Doors"
Every Flow Show opens with what Hartnett calls "Scores on the Doors" — a league table of asset class returns year-to-date. It tells you, at a glance, what has actually been making money in 2026. Here is this week's opening line-up:
OIL (YTD)
- +76.6%
- #1 asset class
COMMODITIES
(YTD)
- +62.5%
- Real assets dominate
GLOBAL STOCKS (ACWI)
- +12.3%
- Solid but not #1
S&P 500 (SPX)
- +9.5%
- US stocks YTD
GOLD (YTD)
- +7.9%
- Safe haven in demand
BITCOIN (YTD)
- −7.1%
- Crypto underperforming
What this tells us immediately: The real story of 2026 so far is commodities and energy, not technology. Oil is up 76.6%. That is extraordinary. Yet most financial news headlines focus on tech stocks. The Flow Show cuts through the noise with hard data.
Also notable: government bonds are negative year-to-date (−0.9%), and cash is barely keeping up with inflation at +1.3%. This is a critical data point for investors who think "playing it safe" in bonds or cash is, in fact, safe.
Copyright The Prehn Institute. Educational purposes only — not financial advice.
Section 2 • Macro Environment
The Big Picture: The US "Boom Loop"
Bottom Line:
US households have accumulated extraordinary wealth through the stock market: +
10 trillion in 2025, 8 trillion in 2023.
This wealth effect creates a self-reinforcing "boom loop." But Hartnett is very clear: this loop only ends two ways — politics or rising bond yields. Both threats are building right now.
The $31 Trillion Wealth Machine
One of the most striking data points in this report is the scale of household equity wealth creation over the past three years:
Year
Gain in US Household Equity Wealth Cumulative Gain
2023 +$8 trillion $8tn
2024 +$9 trillion $17tn
2025 +$10 trillion $27tn
2026 (YTD)
+$4 trillion $31tn
Source: BofA Global Investment Strategy, Bloomberg; BofA private client equity holdings data
What this means in plain English: American households are $31 trillion richer from stocks alone over just three years. That is almost the entire annual GDP of the United States — gained purely from rising share prices.
What Is the "Boom Loop"?
Hartnett uses the term "boom loop" to describe a self-reinforcing cycle of wealth creation:
- Rising stock prices make households feel wealthier
- Wealthier households spend more money
- More spending boosts corporate profits
- Higher profits drive stock prices even higher
- The loop repeats — until something breaks it
This is the economic engine powering the US right now. It explains why consumer spending remains strong, why the economy hasn't fallen into recession despite high interest rates, and why stocks keep going up even when many traditional valuation metrics say they're expensive.
4trillionthisyearalone, following 9trillionin2024, and
Copyright The Prehn Institute. Educational purposes only — not financial advice.
According to Hartnett, the boom loop has historically been ended by only two forces:
politics (policy changes that redistribute wealth or constrain markets) and rising bond
yields (higher interest rates that make stocks relatively less attractive and increase borrowing costs). Both of these threats are, in his view, escalating right now in 2026.
The Zeitgeist Quotes — What They
MEAN
Hartnett opens each report with one or two pithy "Zeitgeist" quotes that capture the mood of Wall Street. This week he used two:
"Guess we're gonna find out if a bubble can win you an election."
This refers to the Trump administration's apparent strategy of keeping asset prices elevated heading into the November 2026 midterm elections. If voters feel wealthy, they vote for the incumbent. The cynical phrasing "guess we're gonna find out" suggests Hartnett thinks this is a dangerous and unprecedented experiment.
"The one thing Xi defiantly has that Trump wants is low interest rates."
This quote highlights a key tension: China's President Xi has the ability to set interest rates through state control of the banking system, while Trump, as a US President, cannot legally control the Federal Reserve's interest rate decisions. Trump has notoriously wanted lower rates to keep the economy and markets booming. The implication is that the new Fed Chair (Warsh, who begins May 15, 2026) faces enormous political pressure — but may resist it.
The "Melt-up" Scenario
What is a melt-up? A melt-up is when markets rise rapidly and sharply — not because fundamentals justify it, but because investor fear of missing out (FOMO) drives money into stocks at an accelerating rate. It is the final euphoric phase of a bull market before a major correction.
Hartnett explicitly notes that the "melt-up is everyone's new base case" — meaning most professional investors now expect markets to keep rising strongly into year-end. When everyone expects the same thing, markets have a habit of delivering a surprise. This consensus view is itself a warning sign.
KEY INSIGHT FOR RETAIL INVESTORS The boom loop is real and powerful. But Hartnett is documenting its late stage. The most dangerous moment in any market cycle is when everyone is bullish and complacent. That is precisely where we appear to be heading into the summer of 2026.
Copyright The Prehn Institute. Educational purposes only — not financial advice.
Section 3 • Bubble Warning
The Bubble Warning: Semiconductors & the SOX
Index
Bottom Line:
The Philadelphia Semiconductor Index (SOX) — the benchmark for AI and chip stocks — is currently trading 62% above its 200-day moving average. To understand how extreme this is: the Nasdaq at the peak of the dot-com bubble in 2000 was only 55% above its 200-day average. The Mississippi Bubble of 1720 stands alone as the only comparable extreme. Hartnett names this explicitly as the AI bubble.
WHAT
IS
THE
200-Day
MOVING
Average?
The 200-day moving average (200dma) is one of the most widely used tools in professional investing. It is simply the average closing price of an index or stock over the past 200 trading days
- roughly 10 months of market activity.
It acts as a long-term "fair value" reference point. Markets naturally oscillate around this line. In normal bull markets, indices may trade 5–15% above their 200dma. In exceptional bull phases, perhaps 20–30%. At extremes like the dot-com peak, the Nasdaq reached 55% above its 200dma
- and then crashed 78% over the following two years.
The SOX index, which includes companies like NVIDIA, AMD, Intel, Qualcomm and TSMC, is currently 62% above its 200dma. This is not a 200dma deviation that has existed anywhere in modern financial history — except at the very top of past bubbles.
The Historical Bubble Comparison
Hartnett's team compiled a remarkable table comparing today's SOX deviation to every major financial bubble since 1700 — specifically how far above the 200dma each market traded at the very peak of the bubble:
Copyright The Prehn Institute. Educational purposes only — not financial advice.
Date at Peak
Mississippi Co.
CAC All-Tradable
Jan 1720
+73%
Roaring 20s
Dow Jones
Sep 1929
+21%
Black Monday
Dow Jones
Aug 1987
+21%
Japan Nikkei 225
Dec 1989
+12%
Dot-com Nasdaq
Mar 2000
+55%
Saudi Arabia
Tadawul
Feb 2006
+28%
China Shanghai
Oct 2007
+37%
| Historical Average | +35% | ||
|---|---|---|---|
| AI / Today | SOX (Semiconductors) | Now | +62% |
| Source: |
BofA Global Investment Strategy,
Bloomberg, GFD Finaeon
The average peak deviation across all historical bubbles is +35%. The SOX today is at +62% — not at the average, and not even at the dot-com extreme. Only the Mississippi Bubble of 300 years ago comes close. This data point alone should stop every tech and AI investor in their tracks.
WHAT
DOES
THIS
MEAN
IN
PLAIN
English?
Exponential price action. Hartnett describes the current environment as "exponential price action, market concentration, collapsing volatility, stocks bossing bond yields higher." Let's decode that:
Exponential price action: Prices are rising at an accelerating rate, not a steady one. This is a hallmark of late-stage bubbles.
Market concentration: A small number of stocks (primarily AI/semiconductor names) account for a disproportionate share of market gains. When those few stocks turn, the whole market feels it.
Collapsing volatility: The "fear gauge" (VIX) is extremely low, meaning options are cheap and investors are complacent. Low volatility environments often precede sudden spikes. Stocks bossing bond yields higher: Strong stock market performance is, paradoxically, pushing bond yields up because it signals continued economic strength and inflation — making the inflation problem worse.
CRITICAL RISK WARNING Hartnett explicitly compares current semiconductor/AI stock behaviour to the French CAC at the peak of the Mississippi Bubble (1720) and the Nasdaq at the peak of the dot-com bubble (2000). He calls this the "AI bubble." He does not say it will pop tomorrow. But he is very clearly saying that the deviation from historical norms is extreme and that the risk/reward for late entrants into AI/semiconductor stocks has become dangerously skewed.
The Nikkei and Japan Warning
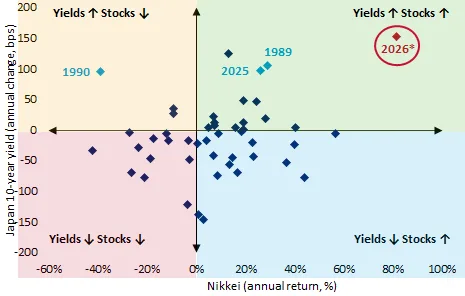
Another striking price alert: the Japanese Nikkei 225 index is annualising a gain of 81–86% in 2026. At the same time, 10-year Japanese government bond (JGB) yields are on pace to rise by +150 basis points (1.5%) this year.
Copyright The Prehn Institute. Educational purposes only — not financial advice.
Hartnett's team notes this is "reminiscent of 1989 and 2025." Japan's 1989 experience is the most infamous stock market bubble in history — the Nikkei peaked in December 1989 and took over 30 years to recover its losses. The parallel is deliberately alarming.
The Financials Anomaly
One of the most counterintuitive data points in this week's report: financial stocks relative to the S&P 500 are now trading below the lows seen at the peak of the dot-com bubble (March 2000), below the lows of the Global Financial Crisis (March 2009), and below the COVID lows (October 2020).
Banks and financial stocks are traditionally considered economically sensitive — they do well when the economy is booming. If they are at multi-decade relative lows while the broad market is at highs, this is a significant divergence that professional investors watch closely as a warning signal of potential fragility beneath the surface.
THE TECH BOND WARNING While AI and semiconductor equity prices have soared, the bonds issued by those same technology companies tell a different story. Investment-grade tech bonds are down 1.5% YTD, and high-yield tech bonds are down
3.7% YTD. The bond market — often more sophisticated than the equity market — is not sharing equity investors' enthusiasm. This divergence is worth watching closely.
Copyright The Prehn Institute. Educational purposes only — not financial advice.
Section 4 • Inflation Risk
Inflation: The Time Bomb Nobody Wants to Talk
About
Bottom Line:
US inflation (CPI) is tracking toward 5%+ by the November 2026 midterm elections, based on the pace of monthly gains seen in recent months. History shows that whenever CPI crosses 4%, stocks fall an average of 4% over the next 3 months and 7% over the next 6 months. US PPI (wholesale prices) is already running at 6%. The inflation threat is not a distant risk — it is a present one.
Where Inflation Stands Right Now
US inflation is currently approaching 4%, and Hartnett's team has done the maths on where it's likely to go. The driver is straightforward: the economy is running hot, and prices across multiple categories are rising simultaneously:
Energy prices: Rising (oil up 76.6% YTD adds to energy costs throughout the economy)
Electricity prices: Rising (driven by AI data centre demand and energy transition costs)
Transportation costs: Rising (fuel costs flow through to logistics)
Goods prices: Rising (re-shoring and tariff effects)
Rents: On the rise again after a brief pause
US Producer Price Index (PPI) — which measures wholesale prices paid by businesses, and is a leading indicator of future consumer prices — is already running at 6%. When producers pay more, they pass it on to consumers. This data point alone suggests CPI has room to rise further.
The Inflation Path Scenarios
Hartnett's team modelled four scenarios for US CPI based on different monthly gain assumptions. The recent run-rate of monthly CPI gains has been approximately +0.4% per month:
Monthly CPI Gain
CPI by Nov 2026 Midterms
Scenario
+0.1% / month ~3.0%
Best case — Fed succeeds
+0.2% / month ~3.7%
Optimistic but stretching
+0.3% / month ~4.4%
Danger zone begins
+0.4% / month (current pace)
~5.2%
Historical danger territory
Source: BofA Global Investment Strategy, Bloomberg
Copyright The Prehn Institute. Educational purposes only — not financial advice.
Unless the pace of monthly CPI gains slows dramatically from the current +0.4% rate, US inflation will be above 5% by the time Americans go to the polls in November 2026. Hartnett's note captures this with the blunt phrase: "4% and there be dragons."
What History Says: CPI Above 4%
And Stocks
This is the most actionable piece of data in this week's report. Hartnett's team has analysed 100
years of US market history to determine what happens to the S&P 500 after CPI crosses 4%:
HISTORICAL AVERAGE: S&P PERFORMANCE AFTER CPI CROSSES 4%
−4% over 3 months −7%
over 6 months
Source: BofA Global Investment Strategy, 100 years of US market data
This is not a prediction of what will happen. It is an empirical observation of what has historically happened on average across a century of data. It is a base rate — and as investors, ignoring base rates is how people lose money.
Why does high inflation hurt stocks? Several reasons:
Rate pressure: High inflation forces the central bank to raise interest rates. Higher rates make bonds more attractive relative to stocks, pulling capital out of equities.
Margin compression: Companies that can't pass on cost increases see their profit margins shrink.
Consumer pressure: Inflation erodes real purchasing power, reducing consumer spending and economic growth.
Valuation compression: Higher interest rates reduce the present value of future corporate earnings — the mathematical foundation of stock valuation.
The New Fed Chair: Kevin Warsh
Kevin Warsh becomes the new Federal Reserve Chair on May 15, 2026 — literally the day after this report was published. The timing is significant. Hartnett's team ran a historical analysis of what happens to US Treasury yields in the first 3 months after a new Fed Chair takes
office :
Fed Chair President
Start Date
2yr Yield Change (bps)
10yr Yield Change (bps)
Burns Nixon
Feb 1970
−42 +19
Miller Carter
Mar 1978
+53 +35
Volcker Carter
Aug 1979
+288 +194
Greenspan Reagan
Aug 1987
−8 +6
Bernanke Bush
Feb 2006
+38 +59
Yellen Obama
Feb 2014
+13
Powell Trump
Feb 2018
+43 +20
| Average | +55 bps | +48 bps | ||
|---|---|---|---|---|
| Warsh | Trump | May 2026 | TBD | TBD |
| Source: |
BofA Global Investment Strategy,
Bloomberg
Copyright The Prehn Institute. Educational purposes only — not financial advice.
The historical average in the 3 months after a new Fed Chair takes over is +55bps on the 2-year
yield+48bps on the 10-year yield yield and +48bps on the 10-year yield. The BofA team projects the 2-year yield could reach
4.53%4.93% 4.53% and the 10-year yield 4.93% by mid- August 2026 based on this historical pattern alone.
Why this matters: Rising bond yields are directly negative for stock valuations and mortgage costs. If the 10-year Treasury approaches 5%, expect significant turbulence in rate-sensitive sectors including real estate, utilities, and growth stocks.
Hartnett identifies early June as the likely peak for the current bull phase. Key dates to watch: OPEC meeting (7th June), FIFA World Cup begins (11th June), Trump's 80th birthday (14th June), G7 Summit (15th June), and the first FOMC meeting under Warsh (17th June). He explicitly writes that "bull capitulation into stocks & tech likely fully complete in next few weeks, early June ripe for taking some off table."
Copyright The Prehn Institute. Educational purposes only — not financial advice.
Section 5 • Capital Flows
Where the Big Money is Flowing — and Why it
Matters
reveal.
Bottom Line:
The weekly flow data is the core product of The Flow Show. This week shows continued strong inflows to stocks and bonds, with some notable divergences: crypto is seeing its biggest outflow since February, China is experiencing its largest equity outflow since January, while US large caps, tech, infrastructure, and investment-grade bonds are all seeing multi-month record inflows. These flows collectively paint a picture of institutional investors "maximum bidding" on US assets heading into the November elections.
Understanding Capital Flows
Capital flows tell you where real money — measured in billions of dollars — is actually moving across global financial markets each week. This is tracked by data firm EPFR Global, which monitors thousands of mutual funds and ETFs worldwide.
When flows are strongly positive into an asset class, it means institutional investors are buying. When they are negative, they are selling. These flows can be self-fulfilling: heavy buying pushes prices up, which attracts more buyers, creating the momentum-driven markets we are currently experiencing.
This Week's Top-level Flows
Asset Class
Weekly Flow
Signal
Bonds
+$28.1 billion
55th consecutive week of inflows
Stocks
+$20.5 billion
Strong; 7th consecutive week for US
Cash (Money Market)
+$5.8 billion
Moderate; total $244bn YTD
Gold
+$2.0 billion
First inflow in 3 weeks
Crypto
−$1.3 billion
Biggest outflow since Feb 2026
"Flows to Know" — The Notable
Highlights
Crypto outflows: $1.3 billion. This is the largest single-week outflow from crypto funds since February 2026. Institutional crypto enthusiasm —
28.1billiontobonds,
Copyright The Prehn Institute. Educational purposes only — not financial advice. which had been building — is showing signs of cooling. This is worth watching as a sentiment indicator for risk appetite broadly.
Investment-Grade (IG) Bonds: $14.0 billion
inflow. This is the largest weekly IG bond inflow in six weeks. The 4-week rolling inflow of $42.2 billion is the largest since March 2026. This tells us that institutional investors are simultaneously buying stocks AND high-quality bonds — a somewhat unusual combination that suggests they are hedging. They want equity upside but are also protecting themselves with safety.
China stock outflows: $22.2 billion. This is the largest outflow from Chinese equities since January 2026. Despite initial enthusiasm about Chinese tech stocks earlier this year, institutional money is leaving. This aligns with Hartnett's comment about hyperscalers (like Amazon and Google) heading to cheaper countries to raise debt — including China — which adds capital flight concerns.
US large-cap inflow: $24.4 billion. The largest inflow in 5 weeks. This is direct evidence of the "max bid" into US equities ahead of midterms. The pattern is unmistakeable: money is coming out of emerging markets and going into US large caps.
Infrastructure: Record $1.5 billion inflow. This is an all-time record inflow to infrastructure funds. This reflects multiple tailwinds: AI data centre construction, energy grid modernisation, and US government fiscal spending. Infrastructure is becoming an increasingly popular "real asset" play.
Treasuries: $5.6 billion inflow. The largest in 6 weeks. Investors are also buying the safety of US government bonds — another sign of the dual- hedging strategy being employed by institutions.
Equity Flows by Region: The US vs
The World
Region
Weekly Flow
YTD Flow
Streak
US Equities +$21.9bn +$166bn weeks of inflows
Japan +$4.6bn +$24bn weeks of inflows
International DM
+$228bn YTD
+$438bn
Strong DM bid
Europe Outflows +$3mn weeks of outflows
EM (Emerging Markets)
Outflows −$79bn weeks of outflows
China −$22.2bn −$185bn Largest since Jan'26
The clear message: Developed markets (especially US and Japan) are receiving strong inflows. Emerging markets — and China in particular — are seeing capital flee. This reflects a classic "risk reduction" rotation: into the perceived safety of US large caps and out of higher-risk emerging market names.
Equity Flows by Sector
Copyright The Prehn Institute. Educational purposes only — not financial advice.
Technology
+$5.4 billion
Biggest inflow since Feb 2026
Financials
+$0.7 billion
Steady
Real Estate
+$0.7 billion
Biggest since Dec 2025
Healthcare
+$0.5 billion
Biggest since Jan 2026
Materials
+$0.4 billion
Commodity theme
Consumer
−$1.0 billion
Outflows
Energy
−$0.5 billion
Despite high oil prices
Utilities
−$56 million
Rate-sensitive; light outflow Energy stocks are seeing outflows even as oil itself is up 76.6% YTD. This suggests institutional investors are taking profits in energy equities while still benefiting from oil exposure through commodity funds. A useful lesson: high commodity prices don't automatically translate into sustained demand for the stocks of companies that produce those commodities.
Copyright The Prehn Institute. Educational purposes only — not financial advice.
Section 6 • Sentiment Indicators
The Bull & Bear Indicator: Your Market Mood
Ring
Bottom Line:
The BofA Bull & Bear (B&B) Indicator has risen to 7.6 from 7.2 last week. The "automatic sell signal" triggers at 8.0. Hartnett estimates the indicator could hit 8.0 within the next two weeks if fund manager cash levels fall further and equity/EM/HY flows remain strong. When this indicator hits 8, history suggests it is time to reduce risk exposure. At 10, it would be an extreme sell. At 0–2, it's a buy signal.
What Is the Bull & Bear Indicator?
The BofA Bull & Bear Indicator is a proprietary sentiment gauge created by BofA's Global Investment Strategy team. It runs on a scale from
0 to 10 :
0–2: Extreme Bearish — "Automatic Buy Signal." Everyone is pessimistic. Markets are at their most attractive from a contrarian standpoint.
2–8: Neutral Zone — No automatic signal. Markets can go either way.
8–10: Extreme Bullish — "Automatic Sell Signal." Everyone is optimistic. This is when contrarians reduce exposure.
The logic is rooted in contrarian investing — one of the most powerful principles in finance. When everyone is bullish, all the buyers are already in the market, and there is nobody left to push prices higher. When everyone is bearish, all the sellers have already sold, and prices can only go up.
CURRENT BOFA BULL & BEAR READING
7.6 / 10
Up from 7.2 last week. Sell signal triggers at 8.0. Est. 1– 2 weeks away.
The Six Components
The B&B Indicator is constructed from six underlying inputs, each measuring a different dimension of market sentiment:
Component
Current Percentile
Signal
Hedge Fund Positioning 78th Bullish
Equity Flow 46th Neutral
Bond Flow 63rd Neutral
Credit Market Technicals
77th Bullish
Global Stock Index Breadth
74th Bullish
FMS (Fund Manager Survey) Positioning
88th
Very Bullish
Copyright The Prehn Institute. Educational purposes only — not financial advice.
Source: BofA Global Investment Strategy, Bloomberg, EPFR Global, CFTC, MSCI
The most alarming component: Fund Manager Survey (FMS) Positioning is at the 88th
percentile — labelled "Very Bullish." This means professional fund managers are more bullishly positioned than they have been 88% of all historical observations. Near the extreme.
The Conditions for a Sell Signal
Hartnett explicitly outlines the precise conditions that would push the B&B Indicator to 8.0 (the automatic sell signal) within the next two weeks:
- The May BofA Global Fund Manager Survey shows cash levels declining from 4.3% to 3.8% (managers deploying cash into markets)
- Global stock inflows of $15–20 billion over the next two weeks
- EM debt and high-yield bond inflows of approximately $2 billion each
None of these conditions are extreme — given current flow trends, all three appear quite achievable. This means the sell signal could trigger within the next two weekly flow reports.
The Bofa Global Fms Cash Rule
Separately, BofA tracks the Global Fund
Manager Survey (FMS) Cash Indicator . The rules are simple:
Buy signal: When average cash allocation is at or above 5.0%
Sell signal: When average cash allocation is at or below 4.0%
Current fund manager cash: 4.3%. This is already in neutral territory, approaching the sell-signal threshold. The implication: professional fund managers have already deployed most of their "dry powder" into markets. There is less cash available to push prices higher.
The Bofa Global Flow Trading
RULE
This rule applies to weekly fund flows as a percentage of assets under management (AUM):
Buy signal: When outflows from global equities and high-yield bonds exceed 1.0% of AUM over 4 weeks
Sell signal: When inflows exceed 1.0% of AUM over 4 weeks
Current reading: +0.5% AUM — in neutral territory, but trending toward the sell signal. The key point is that all of BofA's proprietary indicators are simultaneously trending in the same direction: toward extreme bullishness and closer to sell- signal territory.
HISTORICAL SELL SIGNAL PERFORMANCE When the B&B Indicator has previously reached 8.0 and triggered an automatic sell signal (notably Feb 2020, Feb 2026, and Oct 2025), markets have subsequently pulled back. The indicator is not infallible — it is a contrarian tool, and markets can remain irrational longer than most people expect. But the historical track record as a risk-reduction trigger is significant.
The EPS Growth Model: The One
Bullish Signal
In an otherwise cautious report, there is one genuinely positive macro signal: BofA's Global
EPS Growth Model currently shows earnings per share growth rising at approximately 9% year-on-
year . This is a healthy level of earnings growth that provides fundamental support for current stock valuations.
Copyright The Prehn Institute. Educational purposes only — not financial advice.
The signal has a 6–12 month duration and is currently "EPS growth rising." This is the primary reason Hartnett is not calling for an immediate market crash — fundamentals remain decent. The risk is that sentiment, positioning, and valuation have all run well ahead of those fundamentals.
Copyright The Prehn Institute. Educational purposes only — not financial advice.
Section 7 • Private Client Data
Private Client Positioning: What Wealthy Investors Are Doing
Bottom Line:
BofA's Global Wealth and Investment Management (GWIM) division tracks the investment allocations of approximately $4.5 trillion in private client assets. The current data shows a historically extreme position: stock allocation at an all-time high (65.7%), cash allocation at an all- time low (9.8%), and bond allocation near multi-year lows (17.3%). When wealthy investors are at maximum equity allocation and minimum cash, it historically signals limited upside and elevated downside risk.
THE
Private
CLIENT
Allocation:
Extreme Readings
Asset Class
Current Allocation
Historical Context
Equities (Stocks)
65.7%
Highest EVER recorded
Fixed Income (Bonds)
17.3%
Lowest since March 2022
Cash 9.8%
Lowest EVER recorded
Translating this for you: BofA's wealthiest private clients have more of their money in stocks than at any other point in history, and they are holding less cash than at any other point in history. These clients collectively represent $4.5 trillion in managed assets — so this is not an academic observation. It is one of the most significant positioning extremes in modern financial data.
WHY
Extreme
Positioning
IS
A
Warning
In financial markets, extreme positioning is a contrarian indicator. The logic is identical to the Bull & Bear Indicator: if everyone is already fully invested in stocks, who is left to buy? Markets need fresh buyers to continue rising. When everyone is already in, the next move is often down.
Consider the historical context shown by the BofA data:
September 2007 : Equity allocation was 57% — just before the Global Financial Crisis
October 2021 : Equity allocation peaked at 66% — just before the 2022 bear market
February 2009 : Equity allocation was at its low of 39% — the best buying opportunity in a generation
Current (May 2026): Equity allocation at 65.7% — higher than the pre-GFC peak
Copyright The Prehn Institute. Educational purposes only — not financial advice.
Cash allocation at 9.8% is the lowest ever
recorded in BofA's private client data going back to 2005. Cash serves as a buffer and a source of dry powder for buying dips. With cash at record lows, these wealthy investors have minimal capacity to buy market corrections — which means any selloff is likely to be amplified rather than absorbed.
What Are Private Clients Buying
Right Now?
In the past 4 weeks, BofA's private client data shows they have been:
Buying:
Energy ETFs Municipal bond ETFs (munis) Materials ETFs
Selling:
Utilities ETFs Financials ETFs Technology ETFs
What this rotation tells us: Wealthy private clients are rotating away from some of the more rate-sensitive and high-valuation sectors (tech, utilities, financials) and toward real assets (energy, materials) and tax-advantaged income (munis). This is a classic late-cycle defensive rotation — they are subtly reducing risk while remaining broadly invested in equities.
The Treasury Preference Shift
Another nuanced data point from the private client segment: since 2020, these clients have accumulated a cumulative $46 billion in T-notes (medium-term Treasury bonds) versus only billion in T-bonds (long-term).
This "barbell" preference for medium-term Treasuries reflects a deliberate strategy: locking in yields without taking on excessive duration risk. It suggests sophisticated investors are preparing for a scenario where short-term rates eventually fall (as the Fed cuts) but they don't want the volatility of long-term bonds.
THE KEY TAKEAWAY FROM PRIVATE CLIENT DATA The $4.5 trillion BofA private client base is simultaneously at maximum equity exposure AND minimum cash holdings. This is the most extreme positioning in the history of this dataset. History suggests this combination — peak optimism, zero dry powder — is a significant warning for forward equity returns over the next 6–12 months.
30billioninT −bills(short −term)and
Copyright The Prehn Institute. Educational purposes only — not financial advice.
Section 8 • Bond Markets
Bond Yields & the Nasdaq Echo — Ominous
Patterns
Bottom Line:
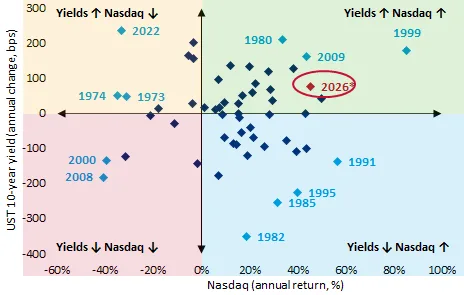
Hartnett flags that the Nasdaq and 10-year Treasury yields are both annualising large gains simultaneously — a pattern that has historically appeared at major turning points. Nasdaq annualising a 45% gain while the 10-year yield is on pace for +80bps is "an ominous echo to 2009 and 1999." In 1999, this preceded the dot-com crash. In 2009, it preceded a significant correction before the next leg higher.
The Dual Ominous Echo
In 2026, two simultaneous annualised trends are notable for their historical parallels:
Nasdaq annualising a 45% gain — strong speculative momentum in tech/AI 10-year Treasury yield on pace for
+80bps rise in 2026 — rising financing costs, inflation pressure
This combination of "stocks surging while rates rise" has historically been unstable. It requires corporate earnings to accelerate enough to justify higher valuations in a higher-rate environment. Often, something breaks — either rates pause (good for stocks) or stocks correct to reflect the higher discount rate (painful for investors).
The Japan parallel is equally striking. The Nikkei is annualising an 81% gain in 2026 while Japanese government bond yields are on pace for their largest annual rise in decades. In 1989 — the year the Japanese bubble peaked — the Nikkei rose dramatically as bond yields also rose. The following year, the Nikkei began a 30-year decline.
The 5% CPI Threshold — Why "4%
And There Be Dragons"
This phrase from Hartnett — "4% and there be dragons" — borrows from medieval cartographers who wrote "here be dragons" on maps beyond the known world. The message: once US CPI crosses 4%, you are in uncharted territory for risk assets in the current cycle.
Not because 4% CPI automatically causes a crash, but because:
- It removes the optionality of Fed rate cuts as a market rescue
- It forces the new Fed Chair to signal tightening 3. It erodes consumer confidence and discretionary spending
- It historically precedes above-average equity drawdowns
Copyright The Prehn Institute. Educational purposes only — not financial advice.
SECTION 9: POLITICS — EXTREME POLITICS = EXTREME WALL STREET
One of the most striking data points in this week's Flow Show comes from UK local elections — and its implications stretch far beyond Britain. In the most recent UK local elections, the vote share of "insurgent" parties (Reform and the Greens) surged from 3% to 41% of votes cast. Meanwhile, the established parties (Labour and the Conservatives) saw their combined share collapse from 92% to 54%.
Why does a UK election matter for global
markets? Because Hartnett frames it as part of a global megatrend: "2020s rule is you can't govern from the centre in a democracy." Voters across the developed world are expressing extreme dissatisfaction with the political establishment. This is a pattern now visible in the US, UK, France, Germany, Italy, and elsewhere.
THE POLITICAL RISK EQUATION Extreme political conditions — where established parties lose power and insurgent movements rise — historically correlate with extreme asset price behaviour on Wall Street. The reason: political extremes create unpredictable policy environments (tariffs, wealth taxes, nationalisation, fiscal excess), which in turn create volatility in financial markets. This is not a partisan observation — it is a market structure observation.
The inflation-politics feedback loop. Hartnett notes that Trump's approval rating on inflation is at just 30% — "near Biden lows." The electorate's anger about affordability and inequality is the most direct route to losing an election. This creates a potential political pivot in 2027: a shift from the current "Chips and Commodities" economic approach to a "Consumer relief" policy
- potentially meaning price controls, tariff reversals, or fiscal transfers. Such a pivot would be a major positive for consumer-oriented stocks and potentially negative for commodities and semiconductor capex.
For investors, this means the 2026–2027 period could see a significant sector rotation if political pressures mount. Watching inflation data and polling numbers between now and November becomes critical.
Copyright The Prehn Institute. Educational purposes only — not financial advice.
Section 10 • Market Performance
2026 Asset Class Winners & Losers: The Full
Scorecard
Bottom Line:
The headline story of 2026 is the dominance of REAL ASSETS: oil, commodities, and industrial metals lead all asset classes by a wide margin. Among equities, Korea, Taiwan, and Turkey lead country returns. Among sectors, Energy and Information Technology top the global leaderboard. In fixed income, TIPS (inflation-linked bonds) and T-Bills beat conventional bonds. Bitcoin is the worst performing major asset year-to-date.
Top-level Asset Class Rankings
(Ytd 2026)
Copyright The Prehn Institute. Educational purposes only — not financial advice.
Oil (WTI) +75.9%
EM Equities (broad) +22.2%
Industrial Metals +18.3%
Japan Equities +15.8%
Pacific Rim ex-Japan +10.5%
US Equities (SPX) +8.9%
Gold +8.4%
UK Equities +6.3%
Europe Equities +4.7%
High Yield Bonds +1.3%
EM Sovereign Bonds +0.6%
US Dollar +0.2%
Investment Grade Bonds
0.0%
Government Bonds −0.9%
Top Country Equity Returns (Ytd
2026)
Country YTD Return
Korea +99.5%
Taiwan +73.6%
Türkiye +62.5%
Brazil +25.9%
Mexico +13.3%
Japan +15.8%
US +8.9%
China −2.7%
India −12.8%
The Korea/Taiwan story: Both countries are AI- adjacent semiconductor superpowers. Korea (Samsung, SK Hynix) and Taiwan (TSMC) are the primary manufacturers of the advanced chips powering the AI boom. Their extraordinary returns in 2026 (+99.5% and +73.6% respectively) are direct expressions of the AI bubble Hartnett is warning about.
Top Global Sector Returns (Ytd
2026)
Rank Sector (ACWI Global) YTD Return
Energy +81.6%
Information Technology +39.7%
Materials +15.7%
Telecoms +15.5%
Industrials +13.0%
Utilities +12.2%
Banks +10.5%
Consumer Staples +9.9%
Fixed Income Rankings (Ytd 2026)
Copyright The Prehn Institute. Educational purposes only — not financial advice.
TIPS +26.6% Inflation-protected bonds — #1 fixed income
3-Month Bills
+22.6%
Ultra-short cash equivalent
US HY (High Yield)
+15.8% Junk bonds
EM Corporate
+12.6%
Emerging market companies
US Corp IG −1.3%
Investment grade corporate bonds
30-Year Treasury
−5.2%
Long-duration government bonds — worst
Japan Govt Bonds
Negative
Worst sovereign bond market
THE BOND MARKET VERDICT IN 2026 The fixed income market in 2026 delivers a clear verdict: inflation-protected instruments (TIPS) and very short-duration instruments (T- Bills) massively outperform conventional bonds. The worst performer is the 30-year US Treasury. This validates the inflation thesis — bond investors are demanding compensation for inflation risk, and those who went "safe" into long-dated government bonds have lost significant money.
Perhaps the most visually arresting element of each Flow Show is the annual asset class "quilt"
- a comprehensive table showing which asset class topped the performance rankings in every year from 2000 to 2026. Some key observations from this data:
No single asset class dominates consistently. Last decade's leader is often this decade's laggard.
Commodities had their worst period 2012– 2015 (falling as much as −29% in a year), but are now the top performer in 2026 (+62.5%). Mean reversion works over long periods.
EM equities were the top performer in 2003 (+56.3%), 2007 (+39.8%), and 2009 (+79%), but have gone from boom to bust repeatedly.
Gold topped the charts in 2010 (+29.2%) and again in 2024 (+26.7%) and 2025 (+60.7%) — a significant multi-year run that continues into 2026. The S&P 500 has been remarkably consistent since 2013: top-3 returns in many years, rarely the worst performer. But 2026 marks the first year since 2022 that US equities are not in the top 5.
Copyright The Prehn Institute. Educational purposes only — not financial advice.
Section 11 • Actionable Insights
Practical Takeaways for Retail Investors
Bottom Line:
The Flow Show's message this week can be distilled into a single sentence: institutional investors are in a maximum-risk, pre-election "bid everything" mode — and the evidence suggests this euphoria is approaching its peak. This does not mean sell everything today. But it does mean: review your exposure, understand your risks, and have a plan for what happens after the peak.
Takeaway 1: Understand What You
OWN
The most important lesson from this week's Flow Show is the value of understanding the composition of your portfolio. If you hold an S&P 500 index fund or any tech-heavy ETF, you have significant concentration in the semiconductor and AI stocks that Hartnett is flagging as bubble territory.
Action: Check what percentage of your portfolio is in tech and semiconductor names. If the answer makes you uncomfortable given the data in this report, that is useful information.
Takeaway
2:
Commodities
HAVE
Been the Real Story
If you followed only mainstream financial news in 2026, you might believe tech stocks were the dominant story. The Flow Show corrects this perception immediately: oil is up 76.6%, commodities are up 62.5%, gold is up 7.9%. Real assets have massively outperformed tech equities year-to-date.
Action: Review whether you have any meaningful allocation to commodity-related assets (energy stocks, materials stocks, commodity ETFs, gold). The data suggests this was the right call for 2026.
Takeaway 3: Watch the Bull & Bear
Indicator
The BofA Bull & Bear Indicator is at 7.6, approaching the "automatic sell signal" of 8.0. You don't need to act on it immediately, but understanding this tool gives you context for interpreting market moves over the coming weeks.
Action: When the indicator hits 8.0 (likely within 2 weeks based on Hartnett's projections), consider whether you want to reduce exposure to the most speculative, high-momentum positions in your portfolio. This is not a rule to follow blindly — it is a framework for managing risk.
Copyright The Prehn Institute. Educational purposes only — not financial advice.
Takeaway
4:
Inflation
Matters
More than Anything
The single most important variable to watch over the next 6 months is US CPI. If it breaks convincingly above 4% — and the trajectory strongly suggests it will — history says equities face headwinds. If the monthly inflation print somehow surprises to the downside (0.2% or less), the risk calculus changes dramatically.
Action: Put the US CPI release dates in your calendar. They occur approximately every 4 weeks. Each print will tell you whether Hartnett's 5%-by-November scenario is on track or cooling. The market's reaction to each CPI print will be the most important data point to monitor.
Takeaway 5: Cash Is Not "Safe"
EITHER
With inflation potentially heading toward 5%, holding cash at a money market rate of 4–4.5% means your real (after-inflation) return could be negative. Cash is not a safe harbour in an inflationary environment — it is a slowly melting asset.
Action: If you are holding cash waiting for a better entry point, consider TIPS (Treasury Inflation-Protected Securities) or short-duration T- Bills as a way to maintain liquidity while getting some inflation protection. The Flow Show data shows TIPS up 26.6% YTD — far better than cash.
Takeaway 6: "Peak June" — The
Next 6 Weeks Are Critical
Hartnett explicitly flags early June as a likely peak for the current bull phase. The combination of the World Cup beginning (risk-taking mood), Trump's birthday (political attention), the G7 summit (geopolitical focus), and the first Warsh FOMC meeting (policy uncertainty) creates a cocktail of potential market-moving events in a compressed window.
Action: If you have been considering taking profits in speculative or momentum positions, Hartnett's data suggests the window before mid- June may be the optimal time to do so. This is not a prediction — but it is a framework informed by comprehensive flow data.
WHAT THIS REPORT IS NOT SAYING This breakdown is not saying: "Sell everything immediately." The BofA data shows earnings growth is real (+9% EPS growth), the US economy is strong, and institutional flows remain positive. Hartnett's concern is about risk/reward at current price levels and the proximity to historical extremes — not an imminent crash prediction. The appropriate response is awareness and measured risk management, not panic.
Takeaway
7:
THE
Political
Calendar Is a Market Calendar
In 2026, the political calendar is the market calendar. The November midterm elections are the single most important event on the horizon. Understanding that the current "max bid" into US assets is partly a political strategy — designed to keep voters feeling wealthy — is essential context for interpreting every market move between now and November.
Action: When you see markets rally on no obvious news, consider whether that rally is being sustained by institutional positioning for the political cycle. And when the elections are decided — whatever the outcome — expect the political support for asset prices to shift dramatically in 2027.
Copyright The Prehn Institute. Educational purposes only — not financial advice.
A
FINAL
WORD
ON
Contrarian
Thinking
The single most valuable skill that professional investors develop is the ability to be comfortable being in the minority. Right now, the consensus is bullish. BofA's private clients are at maximum equity allocation. Fund managers are at near- minimum cash. The B&B Indicator is approaching a sell signal.
The courageous and profitable move in markets is almost always the less obvious one. That might mean holding some cash when everyone else is fully invested. It might mean owning some inflation protection when everyone says "inflation is over." It might mean being cautious about AI stocks when every headline celebrates the next trillion-dollar valuation.
The Flow Show exists precisely to give you data on what "everyone" is doing. And as Hartnett has shown across decades, what "everyone" is doing is the starting point for the contrarian trade.
Copyright The Prehn Institute. Educational purposes only — not financial advice.
Section 12 • Reference Guide
Glossary: Wall Street Terms in Plain English
Asset Classes & Instruments
ACWI (All Country World Index): An index that tracks stock markets in 47 countries around the world — both developed (like the US, UK, Japan) and emerging markets (like China, India, Brazil). It's a global stock market barometer.
SPX / S&P 500: An index of the 500 largest companies listed on US stock exchanges, weighted by market capitalisation. The world's most watched equity index and a common benchmark for US equities.
SOX (Philadelphia Semiconductor Index): An index tracking the world's largest semiconductor (chip) companies, including NVIDIA, AMD, TSMC, Intel, and Qualcomm. It is the best proxy for the AI investment theme in equity markets.
Nikkei 225: Japan's primary stock market index, tracking the 225 largest companies on the Tokyo Stock Exchange. Notable for the catastrophic 1989 bubble and subsequent 30-year recovery journey.
IG Bonds (Investment Grade): Bonds issued by companies or governments rated highly by credit agencies (typically BBB- or above). Considered relatively safe. Lower yield than high-yield bonds.
HY Bonds (High Yield / "Junk Bonds"): Bonds issued by companies with lower credit ratings. They offer higher interest payments to compensate investors for higher default risk. Also called "junk bonds."
TIPS (Treasury Inflation-Protected Securities): US government bonds whose principal adjusts with inflation. If CPI rises 3%, your TIPS principal rises by 3%. The best fixed income hedge against inflation.
T-Bills (Treasury Bills): Ultra-short-term US government debt, typically maturing in 4–52 weeks. Considered the "risk-free" rate. In 2026, they are yielding around 4–4.5%.
JGB (Japanese Government Bond): A bond issued by the Japanese government. The 10-year JGB yield rising dramatically in 2026 signals that Japan's era of ultra-low interest rates may be ending — with potentially large global implications.
MBS (Mortgage-Backed Securities): Bonds backed by pools of home mortgages. Sensitive to interest rates. Rising MBS inflows suggest some investors expect mortgage rates to stabilise or fall.
Economic Indicators
CPI (Consumer Price Index): The most widely used measure of inflation. It tracks the average change in prices paid by consumers for a basket of goods and services. A 4% CPI means prices are 4% higher than they were a year ago.
PPI (Producer Price Index): Measures inflation from the perspective of producers/wholesalers — before goods reach consumers. PPI is a leading
Copyright The Prehn Institute. Educational purposes only — not financial advice. indicator of CPI: when producers' costs rise, they eventually pass those costs on to consumers.
Basis Points (bps): One hundredth of one percent. 50 basis points = 0.5%. Used to describe changes in interest rates and bond yields with precision.
200-Day Moving Average (200dma): The average closing price of an index or stock over the past 200 trading days (roughly 10 months). Used as a long-term fair value reference. Trading far above it is a sign of overextension; far below it suggests oversold conditions.
Institutional
Investors
&
Structures
AUM (Assets Under Management): The total market value of assets that a fund manager or financial institution manages on behalf of clients. BofA's private clients have $4.5 trillion AUM.
GWIM
(Global Wealth and Investment
Management): BofA's division that manages money for high-net-worth private clients. Their investment allocations are tracked as a sentiment indicator.
FMS (Fund Manager Survey): BofA's monthly Global Fund Manager Survey polls several hundred professional fund managers worldwide about their expectations, allocations, and biggest fears. One of the most widely cited institutional sentiment surveys.
EPFR Global: A data firm that tracks capital flows into and out of thousands of mutual funds and ETFs globally. The primary data source for the BofA Flow Show's weekly flow statistics.
ETF (Exchange-Traded Fund): A type of investment fund that trades on a stock exchange like a stock. ETFs can track indices (like the S&P 500), sectors, commodities, or bond markets. They offer instant diversification at low cost.
Hyperscalers: The world's largest cloud computing companies that operate massive data centres: Amazon Google (Cloud), Microsoft (Azure), Meta, and others. They are among the largest buyers of AI chips and are driving much of the semiconductor demand.
Market Concepts
Contrarian Investing: An investment strategy that deliberately goes against prevailing market sentiment. When everyone is bullish, contrarians reduce risk. When everyone is bearish, contrarians buy. The underlying insight is that extreme sentiment leads to extreme prices — which eventually mean-revert.
Melt-Up: A rapid and euphoric rise in asset prices driven primarily by investor fear of missing out (FOMO) rather than fundamental improvements. Melt-ups are characterised by accelerating gains, collapsing volatility, and broad investor participation. They typically end suddenly and sharply.
Boom Loop: A self-reinforcing economic cycle where rising asset prices create wealth effects that stimulate consumer spending, which boosts corporate profits, which drive asset prices even higher. Can be highly persistent but typically ends abruptly when the wealth effect reverses.
Duration (Bond Duration): A measure of a bond's sensitivity to interest rate changes. A 30- year Treasury bond has much higher duration than a 2-year T-bill — meaning a 1% rise in interest rates will cause a 30-year bond's price to fall far more than a 2-year bond's price.
Dry Powder: Cash or liquid assets held in reserve for the purpose of making investments when opportunities arise, particularly during market corrections. When dry powder is low (as with BofA private clients currently), less cash is available to buy dips.
Copyright The Prehn Institute. Educational purposes only — not financial advice.

Mean Reversion: The tendency of asset prices, valuations, or indicators to return to their long- term historical average over time. When the SOX index is 62% above its 200dma, mean reversion suggests it will eventually return to — or below — the average.
F R E E E D U C AT I O N A L W O R K S H O P • L I V E & O N L I N E
"How to Find the Next 10X Bagger"
Join Felix Prehn live for a free workshop where he reveals the exact framework institutional investors use to identify the market's biggest winners — before they become obvious. Learn the checklist, the signals, and the mindset that separates 10X returns from average ones.
Copyright The Prehn Institute. Educational purposes only — not financial advice. affiliates. All original data, research, and analysis in the source document is copyright Bank of America Corporation 2026.
This document is provided for educational purposes only. Nothing herein constitutes financial advice, a solicitation, or a recommendation to buy or sell any security or financial instrument. All investments carry risk, including the total loss of principal. Past performance is not indicative of future results. Always consult a qualified financial adviser before making investment decisions.
Copyright © 2026 The Prehn Institute. All rights reserved.
Trading ideas and investment strategies discussed herein may give rise to significant risk and are not suitable for all investors. Investors should have experience in relevant markets and the financial resources to absorb any losses arising from applying these ideas or strategies. BofA Securities does and seeks to do business with issuers covered in its research reports. As a result, investors should be aware that the firm may have a conflict of interest that could affect the objectivity of this report. Investors should consider this report as only a single factor in making their investment decision. Refer to important disclosures on page 11 to 13.


The Flow Show
The Bidterms
Scores on the Doors : oil 76.6%, commodities 62.5%, ACWI 12.3%, SPX 9.5%, gold 7.9%, cash 1.3%, HY 1.3%, US$ 0.5%, IG 0.0%, govt bonds -0.9%, bitcoin -7.1% YTD.
Zeitgeist : “Guess we’re gonna find out if a bubble can win you an election.”
Zeitgeist : “The one thing Xi defiantly has that Trump wants is low interest rates.”
The Biggest Picture : US household equity wealth up $4tn YTD (using BofA private client equity holdings data – Chart 2); follows $10tn gain in ’25, $9tn gain in ’24, $8tn gain in ’23…wealth key to US “boom loop”, only ended by politics and bonds.
The Price is Right : SOX semiconductor index remarkably trading 62% above 200dma, comparable only to French market at peak Mississippi bubble, Nasdaq at peak dotcom bubble (Table 2)…exponential price action, market concentration, collapsing vol, stocks bossing bond yields higher, why melt-up everyone’s new base case…here we go.
Tale of the Tape : US CPI on course for >5% by mid-terms, but few expect Warsh to hike in ’26…no Fed hikes why investors positioning for stocks & commodities max bid into Nov; and why bond yields breaking up (note yields up ~50bps in 3 months after new Fed chair…2-year UST yield at 4.53%, 10-year yield at 4.93% by mid-Aug - Table 1). Chart 2: Another outsized $4tn gain in household equity wealth YTD US household equity holdings q/q ($tn) vs GWIM equity holdings q/q ($bn)
Source: BofA Global Investment Strategy, Bloomberg
BofA GLOBAL RESEARCH
More on page 2…
| 10 US household equity holdings (q/q chg, $tn) 400 8 GWIM equity holdings (q/q, $bn) - RHS 300 6 200 4 100 2 0 0 -2 -100 -4 -200 | ||
|---|---|---|
| -6 -300 -8 -10 -400 '14 '15 '16 '17 '18 '19 '20 '21 '22 '23 '24 '25 '26 |
14 May 2026 Investment Strategy Global
Chart 1: BofA Bull & Bear Indicator Up to 7.6 from 7.2
Source: BofA Global Investment Strategy. The indicator identified above as the BofA Bull & Bear Indicator is intended to be an indicative metric only and may not be used for reference purposes or as a measure of performance for any financial instrument or contract, or otherwise relied upon by third parties for any other purpose, without the prior written consent of BofA Global Research. This indicator was not created to act as a benchmark.
BofA GLOBAL RESEARCH
Buy Sell
Extreme Bearish
Extreme Bullish
7.6
The Flow Show | 14 May 2026
Weekly Flows : $28.1bn to bonds, $20.5bn to stocks, $5.8bn to cash, $2.0bn to gold, $1.3bn from crypto.
Flows to Know :
• Crypto: $1.3bn outflow, biggest since Feb’26,
• Treasuries: $5.6bn inflow, biggest in 6 weeks,
• IG bonds: $14.0bn inflow (Chart 8), biggest 4-week inflow ($42.2bn) since Mar’26,
• China stocks: $22.2bn outflow, biggest since Jan’26 (Chart 9),
• US large cap stocks: $24.4bn inflow, biggest in 5 weeks,
• MBS: $1.2bn inflow, biggest since Oct’25,
• Tech: $5.4bn inflow, biggest since Feb’26,
• Healthcare: $0.5bn inflow, biggest since Jan’26,
• Real estate: $0.7bn inflow, biggest since Dec’25,
• Infrastructure: record $1.5bn inflow (Chart 10).
BofA Private Clients : $4.5tn AUM…allocation to stocks 65.7% (highest ever - Chart 15), to bonds 17.3% (lowest since Mar’22), 9.8% cash (lowest ever – Chart 16); past 4 weeks private clients buying energy, muni bond, materials ETFs vs selling utilities, financials, tech ETFs.
BofA Bull & Bear Indicator1 : rises to 7.6 from 7.2 on inflows to HY and EM debt; B&B Indicator likely rises to “sell signal” level of 8 next two weeks if May BofA Global Fund Manager Survey shows cash levels down from 4.3% to 3.8%, and flows next 2 weeks show inflows of $15-20bn to global stocks and ~$2bn to EM debt and HY bonds.
Peak June : bull capitulation into stocks & tech likely fully complete in next few weeks, early June ripe for taking some off table…7th OPEC meeting, 11th World Cup begins, 14th Trump 80th birthday, 15th G7 summit, 17th first FOMC under Warsh.
4% and there be dragons : US PPI running at 6%, CPI almost 4% as energy, electricity, transportation, goods prices, rents on rise; US CPI on course for >5% by midterm elections unless 0.4% monthly gains of past 6 months slow pronto (Chart 3); above 4% on CPI where risk assets get twitchy...past 100 years once CPI crosses 4% on average SPX -4% next 3 months, -7% next 6 months.
Prices to Know : Nikkei annualizing big 86% gain and 10-year JGB yields on pace for near 150bps rise in '26…reminiscent of ‘89 and ‘25 – Chart 4); Nasdaq and 10-year UST yields both annualizing gains in ominous echo to ‘09 and ‘99 (Chart 5); other price action reminiscent of the start of a cycle or the end of a cycle...financial stocks relative to S&P500...now below the Mar’00 dotcom bubble lows, the Mar’09 GFC lows, and Oct’20 lows (Chart 6); fab tech EPS, but hyperscalers now heading to cheaper countries (e.g., Switzerland, China next) to raise debt, and IG tech bond prices -1.5% YTD, HY tech bonds -3.7% YTD.
On Politics : UK local elections vote share of insurgent (Reform & Green) parties surge from 3% to 41%, at expense of established (Labour & Conservative) parties (92% to 54% - Chart 7)…2020s you can’t govern from center; extreme politics = extreme Wall St price action; but Main St anger on affordability and inequality quickest route to lose
1 “Old” BofA Bull & Bear Indicator rises to 5.3 from 5.2; for more info see BofA Bull & Bear Indicator revamp.
The Flow Show | 14 May 2026 electorate (Trump approval on inflation 30% near Biden lows); slow-burner but likely political pivot to whip-inflation could cause mass pivot for Chips and Commodities to Consumer in 2027.
3-month change in UST yields after Fed chair term start
| UST 2-yr | UST 10-yr | ||||
|---|---|---|---|---|---|
| New Fed | next | next | |||
| Chair Pr | esident | Start of term | 3mos (bps) | 3mos (bps) |
Miller Carter 3/8/1978 Volcker Carter 8/6/1979 Greenspan Reagan 8/11/1987 (8) Bernanke Bush 2/1/2006 Yellen Obama 2/3/2014 Powell Trump 2/5/2018 Warsh Trump 5/15/2026 - -
| Average (bps) | 55 | 48 |
|---|
Source: BofA Global Investment Strategy, Bloomberg
BofA GLOBAL RESEARCH Paths for US CPI assuming pace of monthly change
| 10% US CPI (YoY %) assuming: 9% 0.1% MoM 8% 0.2% MoM 0.3% MoM 7% 0.4% MoM 6% 5% 5.2% 4.4% 4% 3.7% 3% 3.0% 2% 2% inflation target 1% 0% '20 '21 '22 '23 '24 '25 '26 Source: BofA Global Investment Strategy, Bloomberg BofA GLOBAL RESEARCH |
|---|
Chart 4: Nikkei annualizing 81%, 10Y JGB yield on pace for +150bps Nikkei annual return (%) vs annual change in 10Y JGB yield (bps)
Source: BofA Global Investment Strategy, Bloomberg. *2026 YTD annualized
BofA GLOBAL RESEARCH
| Chart 5: Nasdaq annualizing 45%, 10Y UST on pace for +80bps Nasdaq annual return (%) vs annual change in 10Y UST yield (bps) | |
|---|---|
| Source: BofA Global Investment Strategy, Bloomberg. *2026 YTD annualized BofA GLOBAL RESEARCH |
The Flow Show | 14 May 2026
Source: BofA Global Investment Strategy, Bloomberg
BofA GLOBAL RESEARCH Bubble Index Start Peak at peak Mississippi Co. CAC All-Tradable 7/31/1718 1/31/1720 73% Roaring 20s Dow Jones 3/30/1926 9/3/1929 21% Black Monday Dow Jones 9/20/1985 8/25/1987 21% Japan Nikkei 225 10/23/1986 12/29/1989 12% Dotcom Nasdaq 9/23/1998 3/10/2000 55% Saudi Arabia Tadawul 5/27/2004 2/26/2006 28% China Shanghai 6/6/2005 10/16/2007 37% Average 35%
Semiconductors (SOX) 62%
Source: BofA Global Investment Strategy, Bloomberg, GFD Finaeon
BofA GLOBAL RESEARCH
Chart 7: 2020s rule is you can’t govern from center in a democracy UK local elections vote share of insurgent vs established parties
Source: BofA Global Investment Strategy, UK Parliament Insurgent (Greens, Reform), Established (Labour, Tories, Lib Dems)
BofA GLOBAL RESEARCH Chart 8: Biggest 4-week inflow to IG bond funds since Mar’26 IG bond fund flows (weekly & 4-week moving average, $bn)
Source: BofA Global Investment Strategy, EPFR
BofA GLOBAL RESEARCH
Chart 9: Biggest outflow from China since Jan’26 China equities fund flows (weekly & 4-week moving average, $bn)
Source: BofA Global Investment Strategy, EPFR
BofA GLOBAL RESEARCH Chart 10: Record inflow to infrastructure funds Infrastructure fund flows (weekly & 4-week moving average, $bn)
Source: BofA Global Investment Strategy, EPFR
BofA GLOBAL RESEARCH
0.05
0.07
0.09
0.11
0.13
0.15
0.17
0.19
'99 '01 '03 '05 '07 '09 '11 '13 '15 '17 '19 '21 '23 '25 '27
GFC CV'19
Bubble
3%
41%
92%
54%
0%
10%
20%
30%
40%
50%
60%
70%
80%
90%
100%
Before election After election Before election After election
Vote share of insurgent parties* Vote share of established parties*
-70
-60
-50
-40
-30
-20
-10
'17 '18 '19 '20 '21 '22 '23 '24 '25 '26
Corp IG flows ($bn) Corp IG flows 4-week MA ($bn)
-65
-55
-45
-35
-25
-15
-5
'17 '18 '19 '20 '21 '22 '23 '24 '25 '26
China equities flows ($bn) China equities flows 4-week MA ($bn)
-1.0
-0.8
-0.6
-0.4
-0.2
0.0
0.2
0.4
0.6
0.8
1.0
1.2
1.4
1.6
1.8
'17 '18 '19 '20 '21 '22 '23 '24 '25 '26
Infrastructure flows ($bn) Infrastructure flows 4-week MA ($bn)
The Flow Show | 14 May 2026
Asset Class Flows (Table 3)
Equities: $20.5bn inflow ($35.4bn to ETFs, $15.0bn from mutual funds)
Bonds: inflows past 55 weeks ($28.1bn)
Precious metals : 1st inflow in 3 weeks ($2.0bn)
| Table 3: Cumulative YTD flows by asset class Global flows by asset class, $mn | |||||||||
|---|---|---|---|---|---|---|---|---|---|
| Wk % AUM | YTD | YTD %AUM | |||||||
| Equities 0.1% 358,614 1.3% ETFs 0.2% 533,892 3.3% LO -0.1% -175,766 -1.4% Bonds 0.3% 300,728 3.2% Commodities 0.1% 29,643 2.9% Money-market 0.1% 244,538 2.2% *week ended 05/13/2026: Source: EPFR Global BofA GLOBAL RESEARCH |
Fixed Income Flows (Chart 11)
IG Bond inflows past 6 weeks ($14.0bn)
HY Bond inflows resume ($1.8bn)
EM Debt inflows past 5 weeks ($2.3bn)
Munis inflows past 4 weeks ($1.9bn)
Govt/Tsy inflows past 3 weeks ($5.6bn)
TIPS inflows past 15 weeks ($0.8bn)
Bank loan inflows past 7 weeks ($0.7bn)
Equity Flows (Table 4)
US : inflows past 7 weeks ($21.9bn)
Japan : inflows past 3 weeks ($4.6bn)
Europe : outflows past 5 weeks ($1.5bn)
EM : outflows past 5 weeks ($25.4bn)
By styleUS large cap US value By style: inflows US large cap ($24.4bn); outflows US value ($0.3bn), US growth ($0.7bn), US small cap ($1.5bn).
By sectortechfinancialsreal estate By sector: inflows tech ($5.4bn), financials ($0.7bn), real estate ($0.6bn), hcare ($0.5bn), materials ($0.4bn), com svs ($90mn); outflows utilities ($56mn), energy ($0.5bn), consumer ($1.0bn).
| Table 4: Big YTD inflows to DM international stocks Global equity flows by region, $mn | ||||||||
|---|---|---|---|---|---|---|---|---|
| Wk % AUM | YTD | |||||||
| Total Equities | 0.1% | 358,614 |
| Chart 11: FICC inflows to TIPS, bank loans, Treasuries Weekly FICC flows as a % AUM | ||
|---|---|---|
| TIPS Bank loan Govt/Tsy EM debt Gold & Silver Corp IG Corp HY Commodities Money-market 0.0% 0.1% 0.2% 0.3% 0.4% 0.5% Source: BofA Global Investment Strategy, EPFR Global BofA GLOBAL RESEARCH |
The Flow Show | 14 May 2026
BofA private client flows & allocations
| Chart 12: Private clients bought energy, muni, materials ETFs Chart 13: GWIM equity allocation at 66% BofA private clients 4-week ETF flows as % of AUM BofA private client equity holdings as % of AUM MunE in cie pr ag ly s 68% Oct'21 Materials 66% 66% IG EM debt 63% HY MLP Sep'07 Japan Oct'23 TIPS 58% 57% 58% Healthcare Cons. Disc. Industrials Avg DiS vt ia dp el ne ds 53% Mar'20 Value 54% US BaG nr ko lw oath n BofA GWIM private clients 48% Precious Cumulative 4w flows as % AUM REITs Low-vol Tech 43% GWIM Equity as % AUM Financials Feb'09 Utilities 39% -8% -6% -4% -2% 0% 2% 4% 6% 8% 10% 12% 14% 38% '05 '07 '09 '11 '13 '15 '17 '19 '21 '23 '25 Source: BofA Global investment Strategy BofA GLOBAL RESEARCH Source: BofA Global investment Strategy BofA GLOBAL RESEARCH | ||||
|---|---|---|---|---|
| 68% Oct'21 66% 66% 63% Sep'07 Oct'23 57% 58% 58% Avg 53% Mar'20 54% 48% 43% GWIM Equity as % AUM Feb'09 39% 38% '05 '07 '09 '11 '13 '15 '17 '19 '21 '23 '25 | ||||
| Source: BofA Global investment Strategy BofA GLOBAL RESEARCH |
| Chart 14: GWIM debt allocation at 17% BofA private client debt holdings as % of AUM | ||
|---|---|---|
| 35% Feb'09 GWM Debt as % AUM 33% 34% 31% 29% 27% May'08 Avg 26% 25% 23% Oct'23 22% 21% 19% 17% Mar'22 17% 17% 15% '05 '07 '09 '11 '13 '15 '17 '19 '21 '23 '25 Source: BofA Global investment Strategy BofA GLOBAL RESEARCH |
| Chart 15: GWIM cash allocation at 10% BofA private client cash holdings as % of AUM | |||
|---|---|---|---|
| Feb'09 GWM cash as % AUM 21% 20% 16% Mar'20 14% Avg 12% Jun'07 11% 10% 8% '05 '07 '09 '11 '13 '15 '17 '19 '21 '23 '25 | |||
| Source: BofA Global investment Strategy BofA GLOBAL RESEARCH |
| Chart 16: GWIM equity ETFs 21%, debt ETFs 18% of AUM BofA private client ETF holdings as % of AUM | ||
|---|---|---|
| 25% Debt ETFs % debt holdings Equity ETFs % equity holdings 21% 20% 18% 15% 10% 5% 0% '05 '07 '09 '11 '13 '15 '17 '19 '21 '23 '25 '27 Source: BofA Global investment Strategy BofA GLOBAL RESEARCH |
| Chart 17: $46bn to T-notes vs $30bn to T-bills since 2020 BofA private client cumulative inflow to Treasuries since 2020 ($bn) | |||
|---|---|---|---|
| 80 Cumulative inflow to T-bills since 2020 70 T-notes 60 T-bonds 50 $46bn 40 30 $30bn 20 10 $3bn 0 -10 -20 '20 '21 '22 '23 '24 '25 '26 | |||
| Source: BofA Global investment Strategy BofA GLOBAL RESEARCH |
| The Flow Show | 14 May 2026 |
|---|
| The Asset Class Quilt of Total Returns Chart 18: Historical asset class performance by year Ranked cross asset returns by year 2000 2001 2002 2003 2004 2005 2006 2007 2008 2009 2010 2011 2012 2013 2014 2015 2016 2017 2018 2019 2020 2021 2022 2023 2024 2025 2026* US US US Commodities Commodities MSCI EM REITS MSCI EM REITS MSCI EM MSCI EM Gold REITS S&P 500 S&P 500 S&P 500 Commodities MSCI EM Cash S&P 500 Gold CommoditiesCommodities S&P 500 Gold Gold Commodities Treasuries Treasuries Treasuries 58.2% 39.5% 56.3% 32.0% 34.5% 37.5% 39.8% 79.0% 29.2% 23.8% 32.4% 13.7% 1.4% 17.5% 37.8% 1.8% 31.5% 24.8% 46.3% 31.1% 26.3% 26.7% 60.7% 62.5% 6.7% 14.0% 9.8% US US US Global IG Gold MSCI EAFECommoditiesCommodities MSCI EM Commodities Gold Global HY MSCI EM Gold Global HY MSCI EAFE REITS Global HY MSCI EAFE REITS MSCI EM REITS Cash MSCI EAFE S&P 500 MSCI EM MSCI EM Treasuries Treasuries Treasuries 4.6% 25.6% 39.2% 28.7% 33.7% 32.6% 33.0% 4.3% 62.0% 19.2% 8.9% 19.3% 23.3% 11.7% 14.8% 25.9% 27.4% 18.8% 37.1% 1.5% 18.9% 25.0% 32.0% 22.2% 13.4% 0.8% 0.8% US REITS Cash Global IG REITS MSCI EM Gold MSCI EAFE Gold Cash MSCI EAFE REITS Global IG MSCI EM Global HY Cash S&P 500 S&P 500 Gold MSCI EAFE S&P 500 S&P 500 Gold Global HY MSCI EM MSCI EAFE REITS Treasuries 8.5% 4.4% 14.9% 33.5% 26.0% 17.8% 26.9% 31.9% 2.1% 32.5% 15.9% 4.5% 18.6% 8.0% 0.1% 12.0% 22.0% -1.9% 22.8% 18.4% 28.7% -0.8% 13.4% 8.0% 29.0% 12.2% 6.0% US US Cash Global HY Commodities MSCI EAFE MSCI EAFE Gold MSCI EAFE Global IG REITS S&P 500 Global HY MSCI EAFE REITS Global IG MSCI EAFE MSCI EM Gold Global HY Commodities Global IG MSCI EAFE Gold Global HY S&P 500 S&P 500 Treasuries Treasuries 6.2% 3.1% 30.1% 20.7% 14.0% 23.2% 11.6% -8.3% 31.7% 15.1% 2.6% 17.9% 0.7% 3.2% -0.8% 11.2% 12.9% -3.3% 20.1% 10.3% 11.9% 12.7% 7.5% 18.5% 9.2% 11.6% -12.9% US Global IG Gold Cash Global HY Global HY REITS S&P 500 Global HY S&P 500 Global HY S&P 500 S&P 500 Global IG Gold REITS Gold REITS Global IG MSCI EM MSCI EAFE Global HY Global HY REITS Commodities Global HY Gold Treasuries 3.1% -0.7% 1.8% 30.7% 12.4% 10.7% 15.8% -27.9% 26.5% 13.9% 2.1% 16.0% 0.1% 0.1% -3.4% 8.6% 11.5% -3.4% 18.6% 8.4% 1.4% -13.2% 11.3% 5.5% 9.9% 8.6% 9.1% US Gold MSCI EM Global HY S&P 500 S&P 500 S&P 500 Global HY Global IG S&P 500 CommoditiesCommodities Cash Global IG Cash Cash Global IG Global IG Global HY REITS Gold Cash MSCI EAFE MSCI EM Cash Global IG MSCI EAFE Treasuries -5.4% -2.4% -1.1% 28.7% 10.9% 4.9% 13.5% 7.3% -37.0% 26.1% 13.3% 0.1% 11.1% 0.1% 0.0% -3.8% 4.3% 10.2% -3.9% 17.9% 0.0% -13.9% 10.1% 5.3% 9.8% 7.9% 8.2% US Global HY REITS REITS Gold Global IG Cash Global IG S&P 500 Commodities Gold MSCI EAFECommodities Gold Commodities Global HY Global HY REITS Global IG S&P 500 Global HY Global HY MSCI EM Global IG Global IG MSCI EAFE Cash Treasuries -5.8% -7.8% -2.4% 19.9% 9.4% 3.1% 7.2% 5.5% -42.6% 25.0% 8.2% -2.6% 8.3% -2.1% -0.1% -4.2% 1.3% 9.3% -4.3% 13.7% 8.0% -2.3% -16.7% 9.5% 4.4% 1.3% 6.1% US US US US S&P 500 S&P 500 MSCI EM Global IG Gold Cash Cash MSCI EAFE Global IG Global IG REITS MSCI EM MSCI EM Gold CommoditiesCommodities Global IG Cash S&P 500 Cash REITS Commodities Global HY Treasuries Treasuries Treasuries Treasuries -9.1% -11.9% -6.0% 14.5% 4.6% 4.9% 5.0% -43.1% 19.2% 6.0% -9.4% -2.3% -1.8% -10.4% 7.6% -13.1% 11.4% 0.5% -18.1% 5.1% 3.2% 5.9% 1.3% 2.8% 2.2% 1.1% -2.4% US US US US US US US US MSCI EAFE MSCI EAFE MSCI EAFE Global HY Global HY REITS Cash MSCI EAFE Cash MSCI EAFE MSCI EM MSCI EAFE MSCI EAFE REITS Global IG MSCI EM Global IG Cash Global IG Treasuries Treasuries Treasuries Treasuries Treasuries Treasuries Treasuries Treasuries -14.0% -21.2% -15.7% 1.5% 3.0% -50.2% 0.2% -11.7% 0.1% -4.5% -14.9% 1.0% -13.2% -4.4% -3.0% -19.8% 1.2% 4.0% 0.1% 2.3% 3.5% 3.1% 5.9% -3.3% 2.4% 7.0% 3.9% US US US MSCI EM Commodities S&P 500 Cash Cash Global IG Commodities REITS MSCI EM Cash MSCI EM Commodities Gold CommoditiesCommodities Cash Cash MSCI EM Cash Commodities Gold REITS Commodities REITS Treasuries Treasuries Treasuries -30.6% -21.4% -22.1% 1.1% 1.3% -3.0% -0.2% -10.0% -53.2% 0.1% -18.2% -0.3% -27.3% -29.3% -29.4% 0.3% 0.8% -14.3% 2.2% -15.0% -4.1% -25.2% -3.5% 3.5% -3.7% 0.5% -0.2% Source: BofA Global Investment Strategy, Bloomberg. *2026 YTD BofA GLOBAL RESEARCH | The Asset Class Quilt of Total Returns | ||||||||||||||||||||||||||||
|---|---|---|---|---|---|---|---|---|---|---|---|---|---|---|---|---|---|---|---|---|---|---|---|---|---|---|---|---|---|
| 2000 2001 2002 2003 2004 2005 2006 2007 2008 2009 2010 2011 2012 2013 2014 2015 2016 2017 2018 | 2019 2020 2021 2022 2023 2024 2025 2026* | ||||||||||||||||||||||||||||
| Commodities 58.2% | US Treasuries 6.7% | Commodities 39.5% | MSCI EM 56.3% | REITS 32.0% | MSCI EM 34.5% | REITS 37.5% | MSCI EM 39.8% | US Treasuries 14.0% | MSCI EM 79.0% | Gold 29.2% | US Treasuries 9.8% | REITS 23.8% | S&P 500 32.4% | S&P 500 13.7% | S&P 500 1.4% | Commodities 17.5% | MSCI EM 37.8% | Cash 1.8% | S&P 500 31.5% | Gold 24.8% | Commodities 46.3% | Commodities 31.1% | S&P 500 26.3% | Gold 26.7% | Gold 60.7% | Commodities 62.5% | |||
| US Treasuries 13.4% | Global IG 4.6% | Gold 25.6% | MSCI EAFE 39.2% | Commodities 28.7% | Commodities 33.7% | MSCI EM 32.6% | Commodities 33.0% | Gold 4.3% | Global HY 62.0% | MSCI EM 19.2% | Gold 8.9% | Global HY 19.3% | MSCI EAFE 23.3% | REITS 11.7% | US Treasuries 0.8% | Global HY 14.8% | MSCI EAFE 25.9% | US Treasuries 0.8% | REITS 27.4% | MSCI EM 18.8% | REITS 37.1% | Cash 1.5% | MSCI EAFE 18.9% | S&P 500 25.0% | MSCI EM 32.0% | MSCI EM 22.2% | |||
| REITS 8.5% | Cash 4.4% | Global IG 14.9% | REITS 33.5% | MSCI EM 26.0% | Gold 17.8% | MSCI EAFE 26.9% | Gold 31.9% | Cash 2.1% | MSCI EAFE 32.5% | REITS 15.9% | Global IG 4.5% | MSCI EM 18.6% | Global HY 8.0% | US Treasuries 6.0% | Cash 0.1% | S&P 500 12.0% | S&P 500 22.0% | Gold -1.9% | MSCI EAFE 22.8% | S&P 500 18.4% | S&P 500 28.7% | Gold -0.8% | Global HY 13.4% | MSCI EM 8.0% | MSCI EAFE 29.0% | REITS 12.2% | |||
| Cash 6.2% | Global HY 3.1% | US Treasuries 11.6% | Commodities 30.1% | MSCI EAFE 20.7% | MSCI EAFE 14.0% | Gold 23.2% | MSCI EAFE 11.6% | Global IG -8.3% | REITS 31.7% | S&P 500 15.1% | Global HY 2.6% | MSCI EAFE 17.9% | REITS 0.7% | Global IG 3.2% | MSCI EAFE -0.8% | MSCI EM 11.2% | Gold 12.9% | Global HY -3.3% | Commodities 20.1% | Global IG 10.3% | MSCI EAFE 11.9% | US Treasuries -12.9% | Gold 12.7% | Global HY 7.5% | S&P 500 18.5% | S&P 500 9.2% | |||
| Global IG 3.1% | Gold -0.7% | Cash 1.8% | Global HY 30.7% | Global HY 12.4% | REITS 10.7% | S&P 500 15.8% | US Treasuries 9.1% | Global HY -27.9% | S&P 500 26.5% | Global HY 13.9% | S&P 500 2.1% | S&P 500 16.0% | Global IG 0.1% | Gold 0.1% | REITS -3.4% | Gold 8.6% | REITS 11.5% | Global IG -3.4% | MSCI EM 18.6% | MSCI EAFE 8.4% | Global HY 1.4% | Global HY -13.2% | REITS 11.3% | Commodities 5.5% | Global HY 9.9% | Gold 8.6% | |||
| Gold -5.4% | MSCI EM -2.4% | Global HY -1.1% | S&P 500 28.7% | S&P 500 10.9% | S&P 500 4.9% | Global HY 13.5% | Global IG 7.3% | S&P 500 -37.0% | Commodities 26.1% | Commodities 13.3% | Cash 0.1% | Global IG 11.1% | Cash 0.1% | Cash 0.0% | Global IG -3.8% | Global IG 4.3% | Global HY 10.2% | REITS -3.9% | Gold 17.9% | US Treasuries 8.2% | Cash 0.0% | MSCI EAFE -13.9% | MSCI EM 10.1% | Cash 5.3% | Global IG 9.8% | MSCI EAFE 7.9% | |||
| Global HY -5.8% | REITS -7.8% | REITS -2.4% | Gold 19.9% | Global IG 9.4% | Cash 3.1% | Global IG 7.2% | S&P 500 5.5% | Commodities -42.6% | Gold 25.0% | MSCI EAFE 8.2% | Commodities -2.6% | Gold 8.3% | Commodities -2.1% | Global HY -0.1% | Global HY -4.2% | REITS 1.3% | Global IG 9.3% | S&P 500 -4.3% | Global HY 13.7% | Global HY 8.0% | MSCI EM -2.3% | Global IG -16.7% | Global IG 9.5% | MSCI EAFE 4.4% | US Treasuries 6.1% | Cash 1.3% | |||
| S&P 500 -9.1% | S&P 500 -11.9% | MSCI EM -6.0% | Global IG 14.5% | Gold 4.6% | US Treasuries 2.8% | Cash 4.9% | Cash 5.0% | MSCI EAFE -43.1% | Global IG 19.2% | Global IG 6.0% | REITS -9.4% | US Treasuries 2.2% | MSCI EM -2.3% | MSCI EM -1.8% | Gold -10.4% | US Treasuries 1.1% | Commodities 7.6% | Commodities -13.1% | Global IG 11.4% | Cash 0.5% | US Treasuries -2.4% | S&P 500 -18.1% | Cash 5.1% | REITS 3.2% | Commodities 5.9% | Global HY 1.3% | |||
| MSCI EAFE -14.0% | MSCI EAFE -21.2% | MSCI EAFE -15.7% | US Treasuries 2.3% | US Treasuries 3.5% | Global HY 1.5% | US Treasuries 3.1% | Global HY 3.0% | REITS -50.2% | Cash 0.2% | US Treasuries 5.9% | MSCI EAFE -11.7% | Cash 0.1% | US Treasuries -3.3% | MSCI EAFE -4.5% | MSCI EM -14.9% | MSCI EAFE 1.0% | US Treasuries 2.4% | MSCI EAFE -13.2% | US Treasuries 7.0% | REITS -4.4% | Global IG -3.0% | MSCI EM -19.8% | US Treasuries 3.9% | Global IG 1.2% | Cash 4.0% | Global IG 0.1% | |||
| MSCI EM -30.6% | Commodities -21.4% | S&P 500 -22.1% | Cash 1.1% | Cash 1.3% | Global IG -3.0% | Commodities -0.2% | REITS -10.0% | MSCI EM -53.2% | US Treasuries -3.7% | Cash 0.1% | MSCI EM -18.2% | Commodities -0.3% | Gold -27.3% | Commodities -29.3% | Commodities -29.4% | Cash 0.3% | Cash 0.8% | MSCI EM -14.3% | Cash 2.2% | Commodities -15.0% | Gold -4.1% | REITS -25.2% | Commodities -3.5% | US Treasuries 0.5% | REITS 3.5% | US Treasuries -0.2% |
The Flow Show | 14 May 2026
BofA Rules & Tools
| Table 5: BofA Global Investment Strategy Proprietary Indicators Current reading of all BofA Global Investment Strategy Proprietary Indicators | |||||||
|---|---|---|---|---|---|---|---|
| Current Duration of Proprietary Indicators Category reading Current signal signal | |||||||
| Contrarian | |||||||
| BofA Bull & Bear Indicator (B&B) | Contrarian | 7.6 Neutral | 1-3 months | ||||
| Sell when investor sentiment > 8.0; Buy when investor sentiment < 2.0 | |||||||
| BofA Global FMS Cash Indicator | Contrarian | 4.3% Neutral | 4 weeks | ||||
| Buy when cash at or above 5.0%; Sell when cash at or below 4.0% | |||||||
| BofA Global Breadth Rule | Contrarian | 54.5% Neutral | 3 months | ||||
| Buy when net 88% of markets in MSCI ACWI trading below 200-day moving & 50-day moving averages | |||||||
| BofA Global Flow Trading Rule | Contrarian | 0.5% Neutral | 8 weeks | ||||
| Buy when outflows from global equities & HY > 1.0% AUM over 4wks; Sell when inflows > 1.0% AUM over 4wks | |||||||
| BofA EM Flow Trading Rule | Contrarian | -1.8% Neutral | 8 weeks | ||||
| Buy when outflows from EM equities > 3.0% of AUM; Sell when inflows > 1.5% of AUM over 4 wks | |||||||
| Macro | |||||||
| BofA Global EPS Growth Model | Macro | 9% EPS growth ris | ing 6-12 months | ||||
| Model indicates trend in year-on-year change in 12-month forward global EPS growth. Source: BofA Global Investment Strategy. See Global Investment Strategy: Rules & Tools, 12 November 2020 and BofA Bull & Bear Indicator revamp reports BofA GLOBAL RESEARCH |
BofA Bull & Bear Indicator (B&B)
Our BofA Bull & Bear Indicator is at 7.6… signal is Neutral.
| Chart 19: BofA Bull & Bear at 7.6 Up to 7.6 from 7.2 | ||
|---|---|---|
| 7.6 LATEST 4 6 M0 ar.4 '23 Buy 2 8 Sell 0.0 0 10 9.6 Mar'20 Extreme Extreme Feb'20 Oct'22 Bearish Bullish Feb'26 Source: BofA Global Investment Strategy BofA GLOBAL RESEARCH |
| Table 6: BofA B&B Indicator BofA Bull & Bear current component readings | |||||||
|---|---|---|---|---|---|---|---|
| Components | Percentile | Sentiment | |||||
| Hedge Fund Positioning | 78% | Bullish | |||||
| Equity Flow | 46% | Neutral | |||||
| Bond Flow | 63% | Neutral | |||||
| Credit Market Technicals | 77% | Bullish | |||||
| Global Stock Index Breadth | 74% | Bullish | |||||
| FMS Positioning | 88% | V Bullish | |||||
| Source: BofA Global Investment Strategy, Bloomberg, EPFR Global, Lipper FMI, Global FMS, CFTC, MSCI BofA GLOBAL RESEARCH |
| Chart 20: BofA Bull & Bear Indicator at 7.6 BofA Bull & Bear Indicator since 2002 | |||
|---|---|---|---|
| 10 Jan'04 Mar'06 Feb'18 Dec'20 Feb'26 89 May'10 Ext Br uem lle Oct'17 Feb'20 Oct'25 7 6 5 4 3 2 Extreme 1 Bear 0'02 '04 '06 '08 '10 '12 '14 '16 Ja '1n 8'19 Ma '2r' 020May' '2 22 2 Ma '2r' 42O 3ct'23 '26 | |||
| Source: BofA Global Investment Strategy, EPFR Global, FMS, CFTC, MSCI. BofA GLOBAL RESEARCH |
Disclaimer: The indicators identified above as the BofA Bull & Bear Indicator, MVP Model, BofA Global Breadth Rule, BofA EM Flow Trading Rule, BofA Global Flow Trading Rule, BofA Global FMS Macro Indicator, BofA Global FMS Cash Rule, Global Wave, Sell-Side Indicator, and Global Financial Stress Indicator are intended to be indicative metrics only and may not be used for reference purposes or as a measure of performance for any financial instrument or contract, or otherwise relied upon by third parties for any other purpose, without the prior written consent of BofA Global Research. These indicators were not created to act as a benchmark. The analysis of the BofA Bull & Bear Indicator in this report is back-tested and does not represent the actual performance of any account or fund. Back-tested performance depicts the hypothetical back-tested performance of a particular strategy over the time period indicated. In future periods, market and economic conditions will differ and the same strategy will not necessarily produce the same results. No representation is being made that any actual portfolio is likely to have achieved returns similar to those shown herein. In fact, there are frequently sharp differences between back-tested returns and the actual results realized in the actual management of a portfolio. Back- tested performance results are created by applying an investment strategy or methodology to historical data and attempts to give an indication as to how a strategy might have performed during a certain period in the past if the product had been in existence during such time. Back-tested results have inherent limitations including the fact that they are calculated with the full benefit of hindsight, which allows the security selection methodology to be adjusted to maximize the returns. Further, the results shown do not reflect actual trading or the impact that material economic and market factors might have had on a portfolio manager's decision-making under actual circumstances. Back-tested returns do not reflect advisory fees, trading costs, or other fees or expenses.
The Flow Show | 14 May 2026
2026 Cross-Asset Winners & Losers
| Table 7: 2026 YTD ranked returns Year-to-date cross asset returns in US dollar terms | ||||||||||||||||||||||||||
|---|---|---|---|---|---|---|---|---|---|---|---|---|---|---|---|---|---|---|---|---|---|---|---|---|---|---|
| Ranked Returns, USD-terms (YTD 2026) | ||||||||||||||||||||||||||
| Assets | Equities | Sectors | Fixed Income | FX vs. USD | Commodities | |||||||||||||||||||||
| 1 | Oil | 75.9% | 1 | Korea Equities | 99.5% | 1 | ACWI Energy | 26.6% | 1 | TIPS | 1.6% | 1 | Norwegian krone | 9.9% | 1 | WTI Crude Oil | 75.9% | |||||||||
| 2 | EM Equities | 22.2% | 2 | Taiwan Equities | 47.3% | 2 | ACWI Info Tech | 22.6% | 2 | 3-Month T-Bills | 1.3% | 2 | Brazilian real | 9.2% | 2 | Brent Crude Oil | 73.6% | |||||||||
| 3 | Industrial Metals | 18.3% | 3 | Türkiye Equities | 26.8% | 3 | ACWI Materials | 15.8% | 3 | US Corp HY | 1.1% | 3 | Australian dollar | 8.8% | 3 | Commodities | 62.5% | |||||||||
| 4 | Japan Equities | 15.8% | 4 | Brazil Equities | 17.7% | 4 | ACWI Industrials | 12.6% | 4 | EM Corporate | 1.0% | 4 | Mexican peso | 4.9% | 4 | Silver | 25.9% | |||||||||
| 5 | Pacific Rim xJapan | 10.5% | 5 | Mexico Equities | 17.2% | 5 | ACWI Real Estate | 7.5% | 5 | EM Sovereign | 0.6% | 5 | NZ dollar | 3.1% | 5 | Copper | 13.3% | |||||||||
| 6 | US Equities | 8.9% | 6 | Japan Equities | 15.8% | 6 | ACWI Telecoms | 7.5% | 6 | US Mortgage Master | 0.6% | 6 | Chinese renminbi | 2.9% | 6 | Gold | 8.4% | |||||||||
| 7 | Gold | 8.4% | 7 | Hong Kong Equities | 13.3% | 7 | ACWI Utilities | 7.3% | 7 | BBB IG | 0.4% | 7 | Swiss franc | 1.4% | 7 | Platinum | 8.0% | |||||||||
| 8 | UK Equities | 6.3% | 8 | Portugal Equities | 12.9% | 8 | ACWI Consumer Staples | 5.8% | 8 | European HY | 0.4% | 8 | Singapore dollar | 1.0% | 8 | Iron Ore | 3.5% | |||||||||
| 9 | Europe Equities | 4.7% | 9 | Australia Equities | 11.0% | 9 | ACWI Banks | 0.9% | 9 | 2-year Treasury | 0.3% | 9 | South African rand | 0.9% | ||||||||||||
| 10 | High Yield Bonds | 1.3% | 10 | US Equities | 8.9% | 10 | ACWI Cons. Discretionary | -1.3% | 10 | US Corp IG | 0.2% | 10 | British pound | 0.4% | ||||||||||||
| 11 | EM Sovereign Bonds | 0.6% | 11 | Italy Equities | 8.2% | 11 | ACWI Financials | -2.0% | 11 | CCC HY | -0.2% | 11 | Canadian dollar | 0.1% | ||||||||||||
| 12 | US Dollar | 0.2% | 12 | Canada Equities | 7.3% | 12 | ACWI BioTechnology | -4.2% | 12 | Treasury Master | -0.2% | 12 | Euro | -0.3% | ||||||||||||
| 13 | IG bonds | 0.0% | 13 | UK Equities | 6.3% | 13 | ACWI Healthcare | -5.2% | 13 | German Govt | -1.0% | 13 | Taiwanese dollar | -0.3% | ||||||||||||
| 14 | Government Bonds | -0.9% | 14 | Singapore Equities | 5.5% | 14 | 30-year Treasury | -1.2% | 14 | Japanese yen | -0.7% | |||||||||||||||
| 15 | Greece Equities | 4.5% | 15 | Non-US IG Govt | -1.4% | 15 | Swedish krona | -1.3% | ||||||||||||||||||
| 16 | S. Africa Equities | 3.8% | 16 | UK Govt | -2.3% | 16 | Korean won | -3.3% | ||||||||||||||||||
| 17 | Switzerland Equities | 3.7% | 17 J | apan Govt | -3.3% | 17 | Indonesian rupiah | -4.4% | ||||||||||||||||||
| 18 | Spain Equities | 2.7% | 18 | Turkish lira | -5.4% | |||||||||||||||||||||
| 19 | France Equities | -0.2% | 19 | Indian rupee | -6.1% | |||||||||||||||||||||
| 20 | Germany Equities | -0.9% | 20 | Bitcoin | -9.1% | |||||||||||||||||||||
| 21 | China Equities | -2.7% | ||||||||||||||||||||||||
| 22 | India Equities | -12.8% | ||||||||||||||||||||||||
| Source: BofA Global Investment Strategy, Bloomberg, as of 13 May 2026 BofA GLOBAL RESEARCH |
| Table 8: The Overbought & Oversold Ranked deviation from 200-day moving averages in US dollar terms | |||||||||||||||||||||||
|---|---|---|---|---|---|---|---|---|---|---|---|---|---|---|---|---|---|---|---|---|---|---|---|
| Ranked Deviation from 200-Day Moving Average, USD-terms | |||||||||||||||||||||||
| Assets | Equities | Sectors | Fixed Income | FX vs. USD | Commodities | ||||||||||||||||||
| 1 | Oil | 43.7% | 1 | Korea Equities | 81.6% | 1 | ACWI Info Tech | 23.1% | 1 | US Corp HY | 1.6% | 1 | Norwegian krone | 7.5% 1 | WTI Crude Oil | 43.7% | |||||||
| 2 | Industrial Metals | 21.5% | 2 | Taiwan Equities | 39.7% | 2 | ACWI Energy | 16.8% | 2 | EM Sovereign | 1.6% | 2 | Australian dollar | 7.3% 2 | Brent Crude Oil | 40.8% | |||||||
| 3 | EM Equities | 19.6% | 3 | Türkiye Equities | 15.7% | 3 | ACWI Materials | 14.0% | 3 | 3-Month T-Bills | 1.4% | 3 | Brazilian real | 5.6% 3 | Silver | 37.5% | |||||||
| 4 | Japan Equities | 13.0% | 4 | Mexico Equities | 15.5% | 4 | ACWI Telecoms | 9.5% | 4 | EM Corporate | 1.2% | 4 | Mexican peso | 4.7% 4 | Copper | 20.3% | |||||||
| 5 | US Equities | 9.9% | 5 | Japan Equities | 13.0% | 5 | ACWI Industrials | 9.3% | 5 | TIPS | 1.1% | 5 | Chinese renminbi | 3.2% 5 | Platinum | 18.5% | |||||||
| 6 | Gold | 7.9% | 6 | Brazil Equities | 12.2% | 6 | ACWI Utilities | 4.1% | 6 | European HY | 0.9% | 6 | South African rand | 2.8% 6 | Gold | 8.3% | |||||||
| 7 | Pacific Rim xJapan | 7.2% | 7 | Italy Equities | 10.5% | 7 | ACWI Banks | 4.0% | 7 | US Mortgage Master | 0.8% | 7 | NZ dollar | 1.7% 7 | Iron Ore | 3.4% | |||||||
| 8 | UK Equities | 6.7% | 8 | US Equities | 9.9% | 8 | ACWI Consumer Staples | 2.9% | 8 | 2-year Treasury | 0.6% | 8 | Swiss franc | 1.3% 8 | Natural Gas | -16.8% | |||||||
| 9 | Europe Equities | 6.0% | 9 | Hong Kong Equities | 9.6% | 9 | ACWI Financials | 1.1% | 9 | BBB IG | 0.5% | 9 | Argentine peso | 1.3% | |||||||||
| 10 | High Yield Bonds | 1.7% | 10 | Canada Equities | 9.2% | 10 | ACWI Cons. Discretionary | 0.7% | 10 | US Corp IG | 0.4% | 10 | Singapore dollar | 0.9% | |||||||||
| 11 | EM Sov Bonds | 1.6% | 11 | Portugal Equities | 8.4% | 11 | ACWI Real Estate | 0.0% | 11 | CCC HY | 0.0% | 11 | Canadian dollar | 0.8% | |||||||||
| 12 | IG Bonds | 0.3% | 12 | S. Africa Equities | 8.0% | 12 | ACWI Healthcare | -1.7% | 12 | Treasury Master | -0.2% | 12 | British pound | 0.7% | |||||||||
| 13 | US Dollar | 0.0% | 13 | Spain Equities | 7.3% | 13 | ACWI BioTechnology | -2.6% | 13 | German Govt | -1.1% | 13 | Euro | 0.2% | |||||||||
| 14 | Govt Bonds | -1.0% | 14 | Australia Equities | 7.1% | 14 | UK Govt | -1.6% | 14 | Swedish krona | -0.2% | ||||||||||||
| 15 | UK Equities | 6.7% | 15 | Non-US IG Govt | -1.8% | 15 | Taiwanese dollar | -1.1% | |||||||||||||||
| 16 | Switzerland Equities | 6.4% | 16 | 30-year Treasury | -2.0% | 16 | Japanese yen | -2.1% | |||||||||||||||
| 17 | Singapore Equities | 4.9% | 17 | Japan Govt | -3.1% | 17 | Korean won | -2.8% | |||||||||||||||
| 18 | Greece Equities | 2.9% | 18 | Indonesian rupiah | -4.0% | ||||||||||||||||||
| 19 | France Equities | 1.3% | 19 | Turkish lira | -5.5% | ||||||||||||||||||
| 20 | Germany Equities | 0.9% | 20 | Indian rupee | -5.5% | ||||||||||||||||||
| 21 | China Equities | -3.2% | |||||||||||||||||||||
| 22 | India Equities | -9.0% | |||||||||||||||||||||
| Source: BofA Global Investment Strategy, Bloomberg, as of 13 May 2026 BofA GLOBAL RESEARCH |
The Flow Show | 14 May 2026
Acronyms
FMS – Fund Manager Survey GWIM – Global Wealth and Investment Management MA – Moving average AUM – Assets Under Management
The Flow Show | 14 May 2026
Disclosures
Important Disclosures
FUNDAMENTAL EQUITY OPINION KEY: Opinions include a Volatility Risk Rating, an Investment Rating and an Income Rating. VOLATILITY RISK RATINGS, indicators of potential price fluctuation, are: A - Low, B - Medium and C - High. INVESTMENT RATINGS reflect the analyst’s assessment of both a stock’s absolute total return potential as well as its attractiveness for investment relative to other stocks within its Coverage Cluster (defined below). Our investment ratings are: 1 - Buy stocks are expected to have a total return of at least 10% and are the most attractive stocks in the coverage cluster; 2 - Neutral stocks are expected to remain flat or increase in value and are less attractive than Buy rated stocks and 3 - Underperform stocks are the least attractive stocks in a coverage cluster. An investment rating of 6 (No Rating) indicates that a stock is no longer trading on the basis of fundamentals. Analysts assign investment ratings considering, among other things, the 0- 12 month total return expectation for a stock and the firm’s guidelines for ratings dispersions (shown in the table below). The current price objective for a stock should be referenced to better understand the total return expectation at any given time. The price objective reflects the analyst’s view of the potential price appreciation (depreciation). Investment rating Total return expectation (within 12-month period of date of initial rating) Ratings dispersion guidelines for coverage clusterR1
Buy ≥ 10% ≤ 70% Neutral ≥ 0% ≤ 30%
Underperform N/A ≥ 20%
R1Ratings dispersions may vary from time to time where BofA Global Research believes it better reflects the investment prospects of stocks in a Coverage Cluster. INCOME RATINGS, indicators of potential cash dividends, are: 7 - same/higher (dividend considered to be secure), 8 - same/lower (dividend not considered to be secure) and 9 - pays no cash dividend. Coverage Cluster is comprised of stocks covered by a single analyst or two or more analysts sharing a common industry, sector, region or other classification(s). A stock’s coverage cluster is included in the most recent BofA Global Research report referencing the stock.
Due to the nature of strategic analysis, the issuers or securities recommended or discussed in this report are not continuously followed. Accordingly, investors must regard this report as providing stand-alone analysis and should not expect continuing analysis or additional reports relating to such issuers and/or securities. BofA Global Research personnel (including the analyst(s) responsible for this report) receive compensation based upon, among other factors, the overall profitability of Bank of America Corporation, including profits derived from investment banking. The analyst(s) responsible for this report may also receive compensation based upon, among other factors, the overall profitability of the Bank’s sales and trading businesses relating to the class of securities or financial instruments for which such analyst is responsible.
Other Important Disclosures
The Flow Show | 14 May 2026 authorized and regulated by the DFSA. Information prepared and issued by Merrill Lynch (DIFC) is done so in accordance with the requirements of the DFSA conduct of business rules. BofA Europe (Frankfurt) distributes this information in Germany and is regulated by BaFin, the ECB and the CBI. BofA Securities entities, including BofA Europe and BofASE (France), may outsource/delegate the marketing and/or provision of certain research services or aspects of research services to other branches or members of the BofA Securities group. You may be contacted by a different BofA Securities entity acting for and on behalf of your service provider where permitted by applicable law. This does not change your service provider. Please refer to the Electronic Communications Disclaimers for further information. This information has been prepared and issued by BofAS and/or one or more of its non-US affiliates. The author(s) of this information may not be licensed to carry on regulated activities in your jurisdiction and, if not licensed, do not hold themselves out as being able to do so. BofAS and/or MLPF&S is the distributor of this information in the US and accepts full responsibility for information distributed to BofAS and/or MLPF&S clients in the US by its non-US affiliates. Any US person receiving this information and wishing to effect any transaction in any security discussed herein should do so through BofAS and/or MLPF&S and not such foreign affiliates. Hong Kong recipients of this information should contact Merrill Lynch (Asia Pacific) Limited in respect of any matters relating to dealing in securities or provision of specific advice on securities or any other matters arising from, or in connection with, this information. Singapore recipients of this information should contact Merrill Lynch (Singapore) Pte Ltd in respect of any matters arising from, or in connection with, this information. For clients that are not accredited investors, expert investors or institutional investors Merrill Lynch (Singapore) Pte Ltd accepts full responsibility for the contents of this information distributed to such clients in Singapore. General Investment Related Disclosures: Taiwan Readers: Neither the information nor any opinion expressed herein constitutes an offer or a solicitation of an offer to transact in any securities or other financial instrument. No part of this report may be used or reproduced or quoted in any manner whatsoever in Taiwan by the press or any other person without the express written consent of BofA Securities. This document provides general information only, and has been prepared for, and is intended for general distribution to, BofA Securities clients. Neither the information nor any opinion expressed constitutes an offer or an invitation to make an offer, to buy or sell any securities or other financial instrument or any derivative related to such securities or instruments (e.g., options, futures, warrants, and contracts for differences). This document is not intended to provide personal investment advice and it does not take into account the specific investment objectives, financial situation and the particular needs of, and is not directed to, any specific person(s). This document and its content do not constitute, and should not be considered to constitute, investment advice for purposes of ERISA, the US tax code, the Investment Advisers Act or otherwise. Investors should seek financial advice regarding the appropriateness of investing in financial instruments and implementing investment strategies discussed or recommended in this document and should understand that statements regarding future prospects may not be realized. Any decision to purchase or subscribe for securities in any offering must be based solely on existing public information on such security or the information in the prospectus or other offering document issued in connection with such offering, and not on this document. Securities and other financial instruments referred to herein, or recommended, offered or sold by BofA Securities, are not insured by the Federal Deposit Insurance Corporation and are not deposits or other obligations of any insured depository institution (including, Bank of America, N.A.). Investments in general and, derivatives, in particular, involve numerous risks, including, among others, market risk, counterparty default risk and liquidity risk. No security, financial instrument or derivative is suitable for all investors. Digital assets are extremely speculative, volatile and are largely unregulated. In some cases, securities and other financial instruments may be difficult to value or sell and reliable information about the value or risks related to the security or financial instrument may be difficult to obtain. Investors should note that income from such securities and other financial instruments, if any, may fluctuate and that price or value of such securities and instruments may rise or fall and, in some cases, investors may lose their entire principal investment. Past performance is not necessarily a guide to future performance. Levels and basis for taxation may change. This report may contain a short-term trading idea or recommendation, which highlights a specific near-term catalyst or event impacting the issuer or the market that is anticipated to have a short-term price impact on the equity securities of the issuer. Short-term trading ideas and recommendations are different from and do not affect a stock's fundamental equity rating, which reflects both a longer term total return expectation and attractiveness for investment relative to other stocks within its Coverage Cluster. Short-term trading ideas and recommendations may be more or less positive than a stock's fundamental equity rating. BofA Securities is aware that the implementation of the ideas expressed in this report may depend upon an investor's ability to "short" securities or other financial instruments and that such action may be limited by regulations prohibiting or restricting "shortselling" in many jurisdictions. Investors are urged to seek advice regarding the applicability of such regulations prior to executing any short idea contained in this report. Foreign currency rates of exchange may adversely affect the value, price or income of any security or financial instrument mentioned herein. Investors in such securities and instruments, including ADRs, effectively assume currency risk. BofAS or one of its affiliates is a regular issuer of traded financial instruments linked to securities that may have been recommended in this report. BofAS or one of its affiliates may, at any time, hold a trading position (long or short) in the securities and financial instruments discussed in this report. BofA Securities, through business units other than BofA Global Research, may have issued and may in the future issue trading ideas or recommendations that are inconsistent with, and reach different conclusions from, the information presented herein. Such ideas or recommendations may reflect different time frames, assumptions, views and analytical methods of the persons who prepared them, and BofA Securities is under no obligation to ensure that such other trading ideas or recommendations are brought to the attention of any recipient of this information. In the event that the recipient received this information pursuant to a contract between the recipient and BofAS for the provision of research services for a separate fee, and in connection therewith BofAS may be deemed to be acting as an investment adviser, such status relates, if at all, solely to the person with whom BofAS has contracted directly and does not extend beyond the delivery of this report (unless otherwise agreed specifically in writing by BofAS). If such recipient uses the services of BofAS in connection with the sale or purchase of a security referred to herein, BofAS may act as principal for its own account or as agent for another person. BofAS is and continues to act solely as a broker-dealer in connection with the execution of any transactions, including transactions in any securities referred to herein. Flows data from the Wealth Management division of MLPF&S presented herein represents the investments and trading activity associated with all self-directed, advisor-assisted, and fully managed wealth management relationships, as well as 401(k) plan and employee stock purchase plan accounts custodied through MLPF&S. Copyright and General Information: Copyright 2026 Bank of America Corporation. All rights reserved. iQdatabase® is a registered service mark of Bank of America Corporation. This information is prepared for the use of BofA Securities clients and may not be redistributed, retransmitted or disclosed, in whole or in part, or in any form or manner, without the express written consent of BofA Securities. This document and its content is provided solely for informational purposes and cannot be used for training or developing artificial intelligence (AI) models or as an input in any AI application (collectively, an AI tool). Any attempt to utilize this document or any of its content in connection with an AI tool without explicit written permission from BofA Global Research is strictly prohibited. BofA Global Research utilizes AI, including machine learning and other technologies, to enhance the services we provide to our clients. These technologies assist our analysts in various aspects of their work, including but not limited to data analysis, content extraction, content creation, data aggregation and summarization and identifying relevant information from diverse sources. All AI-driven processes are subject to review by BofA Global Research employees. BofA Global Research information is distributed simultaneously to internal and client websites and other portals by BofA Securities and is not publicly-available material. Any unauthorized use or disclosure is prohibited. Receipt and review of this information constitutes your agreement not to redistribute, retransmit, or disclose to others the contents, opinions, conclusion, or information contained herein (including any investment recommendations, estimates or price targets) without first obtaining express permission from an authorized officer of BofA Securities. Materials prepared by BofA Global Research personnel are based on public information. Facts and views presented in this material have not been reviewed by, and may not reflect information known to, professionals in other business areas of BofA Securities, including investment banking personnel. BofA Securities has established information barriers between BofA Global Research and certain business groups. As a result, BofA Securities does not disclose certain client relationships with, or compensation received from, such issuers. To the extent this material discusses any legal proceeding or issues, it has not been prepared as nor is it intended to express any legal conclusion, opinion or advice. Investors should consult their own legal advisers as to issues of law relating to the subject matter of this material. BofA Global Research personnel’s knowledge of legal proceedings in which any BofA Securities entity and/or its directors, officers and employees may be plaintiffs, defendants, co-defendants or co-plaintiffs with or involving issuers mentioned in this material is based on public information. Facts and views presented in this material that relate to any such proceedings have not been reviewed by, discussed with, and may not reflect information known to, professionals in other business areas of BofA Securities in connection with the legal proceedings or matters relevant to such proceedings.
The Flow Show | 14 May 2026
Any information relating to the tax status of financial instruments discussed herein is not intended to provide tax advice or to be used by anyone to provide tax advice. Investors are urged to seek tax advice based on their particular circumstances from an independent tax professional. The information herein (other than disclosure information relating to BofA Securities and its affiliates) was obtained from various sources and we do not guarantee its accuracy. This information may contain links to third-party websites. BofA Securities is not responsible for the content of any third-party website or any linked content contained in a third-party website. Content contained on such third-party websites is not part of this information and is not incorporated by reference. The inclusion of a link does not imply any endorsement by or any affiliation with BofA Securities. Access to any third-party website is at your own risk, and you should always review the terms and privacy policies at third-party websites before submitting any personal information to them. BofA Securities is not responsible for such terms and privacy policies and expressly disclaims any liability for them. All opinions, projections and estimates constitute the judgment of the author as of the date of publication and are subject to change without notice. Prices also are subject to change without notice. BofA Securities is under no obligation to update this information and BofA Securities ability to publish information on the subject issuer(s) in the future is subject to applicable quiet periods. You should therefore assume that BofA Securities will not update any fact, circumstance or opinion contained herein. Certain outstanding reports or investment opinions relating to securities, financial instruments and/or issuers may no longer be current. Always refer to the most recent research report relating to an issuer prior to making an investment decision. In some cases, an issuer may be classified as Restricted or may be Under Review or Extended Review. In each case, investors should consider any investment opinion relating to such issuer (or its security and/or financial instruments) to be suspended or withdrawn and should not rely on the analyses and investment opinion(s) pertaining to such issuer (or its securities and/or financial instruments) nor should the analyses or opinion(s) be considered a solicitation of any kind. Sales persons and financial advisors affiliated with BofAS or any of its affiliates may not solicit purchases of securities or financial instruments that are Restricted or Under Review and may only solicit securities under Extended Review in accordance with firm policies. Neither BofA Securities nor any officer or employee of BofA Securities accepts any liability whatsoever for any direct, indirect or consequential damages or losses arising from any use of this information.