
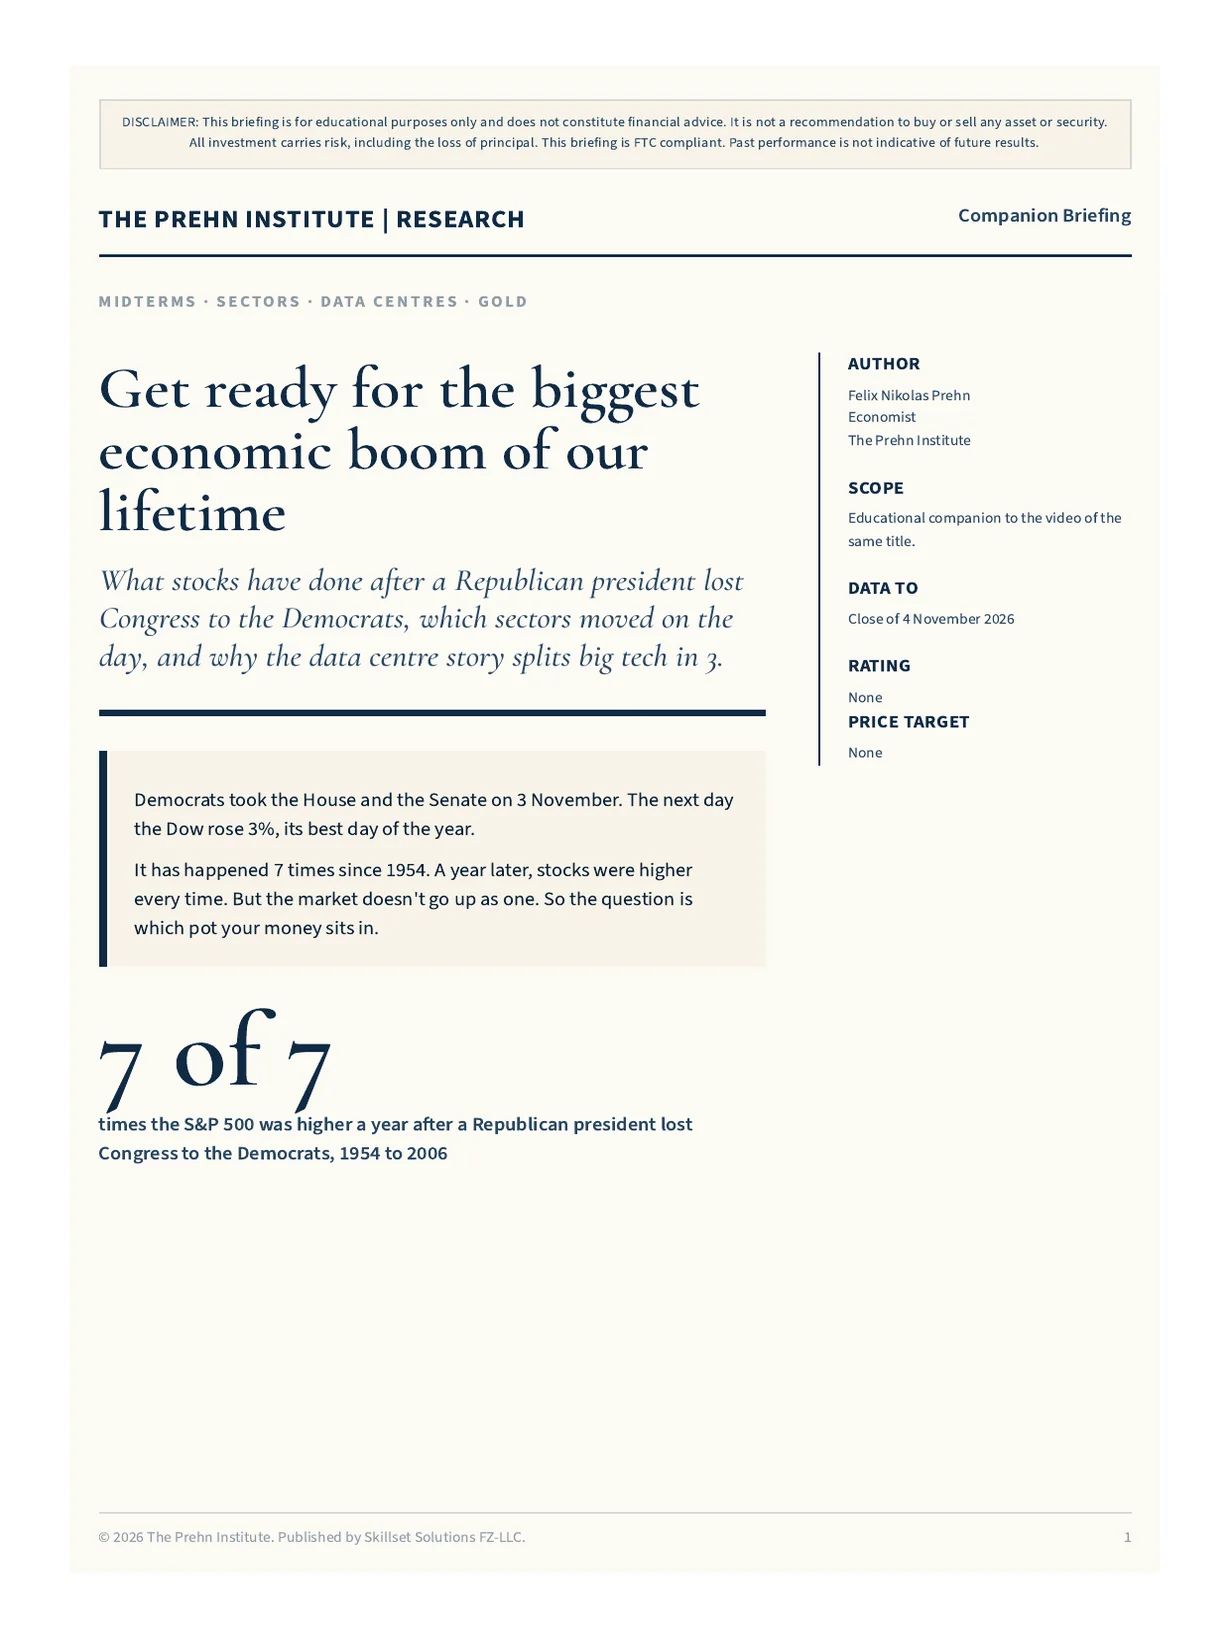
Get ready for the biggest economic boom of our lifetime
What stocks have done after a Republican president lost Congress to the Democrats, which sectors moved on the day, and why the data centre story splits big tech in 3.
Felix Nikolas Prehn · 5 November 2026 · 15 pages
Bottom line
Democrats took the House and the Senate on 3 November. The next day the Dow rose 3%, its best day of the year. It has happened 7 times since 1954. A year later, stocks were higher every time. But the market doesn't go up as one. So the question is which pot your money sits in.
7 of 7times the S&P 500 was higher a year after a Republican president lost Congress to the Democrats, 1954 to 2006
The Crash That Never Came
Everyone was told this result would crash stocks
- +3.0%
- Dow Jones, 4 November. Its best day of the year.
- +1.6%
- S&P 500
- +1.4%
- Nasdaq

For months you couldn't open social media without someone saying stocks would crash if the Democrats took Congress. So some people sold. They went to cash.
Then the result came in. And the Dow rose nearly 1,600 points in a day.
But look underneath the index. In a single session energy fell 6.29% against the market. The chip stocks broke a line the professionals watch closely. And the smaller AI builders fell 7%, 10% and 11%.
So the index looked calm. The pots inside it did not. Do you know which pots your money is in?
Do Democrats Crash Markets?
7 elections, 7 years higher
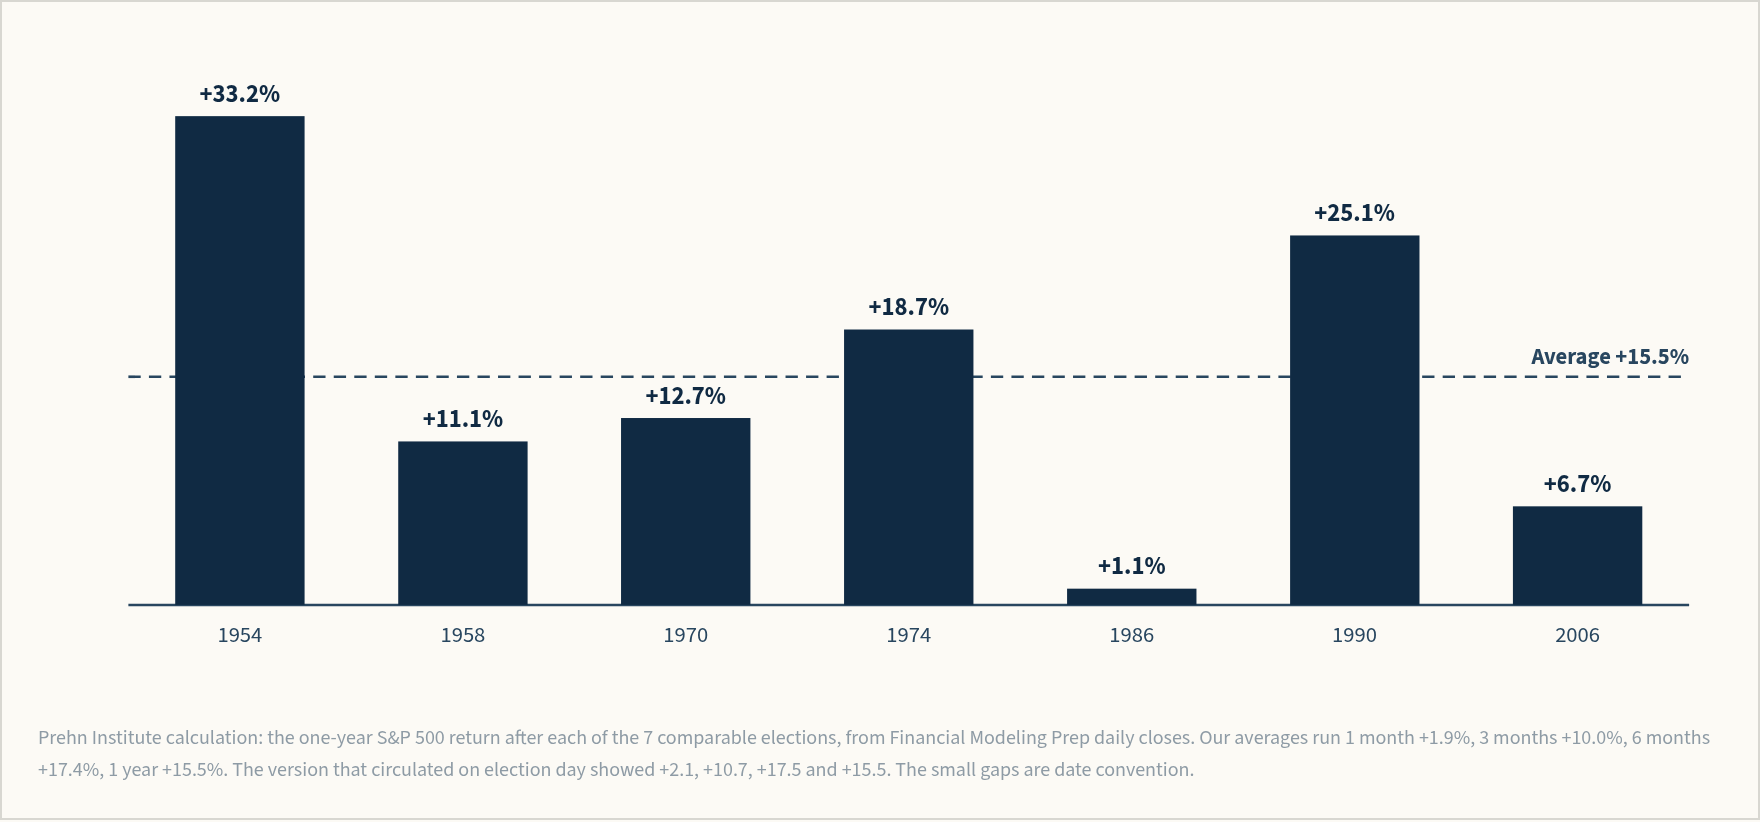
| Midterm | President | 1 month | 3 months | 6 months | 1 year |
|---|---|---|---|---|---|
| 1954 | Eisenhower | +7.5% | +15.5% | +18.6% | +33.2% |
| 1958 | Eisenhower | +1.9% | +7.2% | +12.0% | +11.1% |
| 1970 | Nixon | +5.6% | +14.5% | +23.2% | +12.7% |
| 1974 | Ford | −12.0% | +3.3% | +18.0% | +18.7% |
| 1986 | Reagan | +2.8% | +12.1% | +20.0% | +1.1% |
| 1990 | G.H.W. Bush | +5.6% | +12.7% | +21.1% | +25.1% |
| 2006 | G.W. Bush | +1.8% | +4.7% | +9.0% | +6.7% |
| Average | +1.9% | +10.0% | +17.4% | +15.5% |
Table: Prehn Institute calculation from S&P 500 daily closes (Financial Modeling Prep), election day close to the last close on or before the calendar date 1, 3, 6 and 12 months later. Price only, dividends excluded. Small differences from the circulated chart come from date conventions.
So the pattern held every time at a year. But look at 1974. A month on, the market was down 12%. High oil and sticky inflation. Sound familiar? And 1986 gave just 1.1% after a year, because of the 1987 crash.
What JPMorgan Found
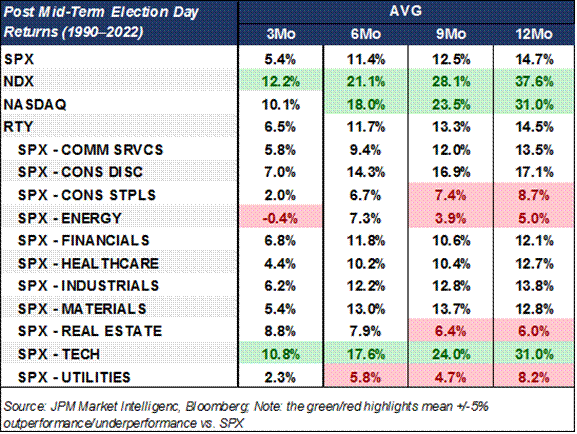
Up a year after every midterm since 1950
- 5.4%
- S&P 500, 3 months after a midterm, average since 1990
- 11.4%
- 6 months
- 14.7%
- 12 months
Why would Wall Street cheer a government that can't agree on anything? Because almost nothing big gets through. Taxes mostly stay put. So do the rules.
And companies can plan around that, which matters more than you might think, because when you can see the rules for the next two years you can build a factory, hire people and set prices without guessing. Less change means less risk. Investors pay more for less risk.
But a pattern isn't a promise. So never trade it blind.
The Market Doesn't Go Up As One
Same day, same market, a 9 point gap
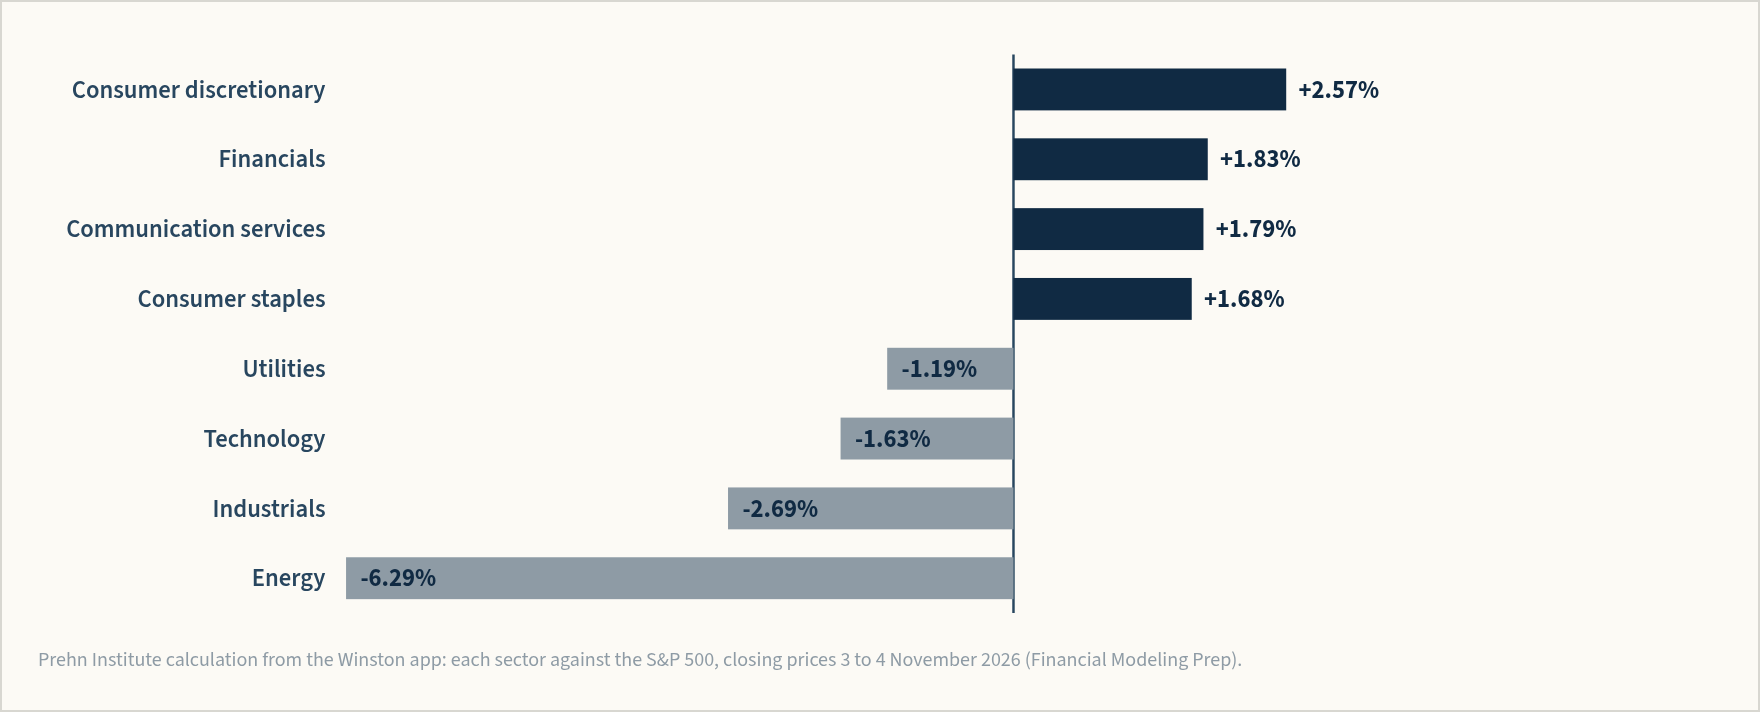
| Sector | Against the S&P 500 | Sector | Against the S&P 500 |
|---|---|---|---|
| Consumer discretionary | +2.57% | Energy | −6.29% |
| Financials | +1.83% | Industrials | −2.69% |
| Communication services | +1.79% | Technology | −1.63% |
| Consumer staples | +1.68% | Utilities | −1.19% |
Energy fell hardest. Its fund, XLE, dropped 4.74% on a day the S&P rose 1.65%. Why? Oil. Brent fell 8.7% and WTI 8.3%, as traders bet the White House would look harder for a way out of the war with Iran.
And JPMorgan's sector table backs up the history. A year after midterms since 1990, energy averaged 5%, the weakest. Technology averaged 31%. If you own energy, that's worth knowing.
Money doesn't leave the market. It moves. And if you hold the pot it moves out of, you can lose money on a day when the headlines tell you everyone is winning.
The Chip Stocks Break A Line
Below the 200-day line
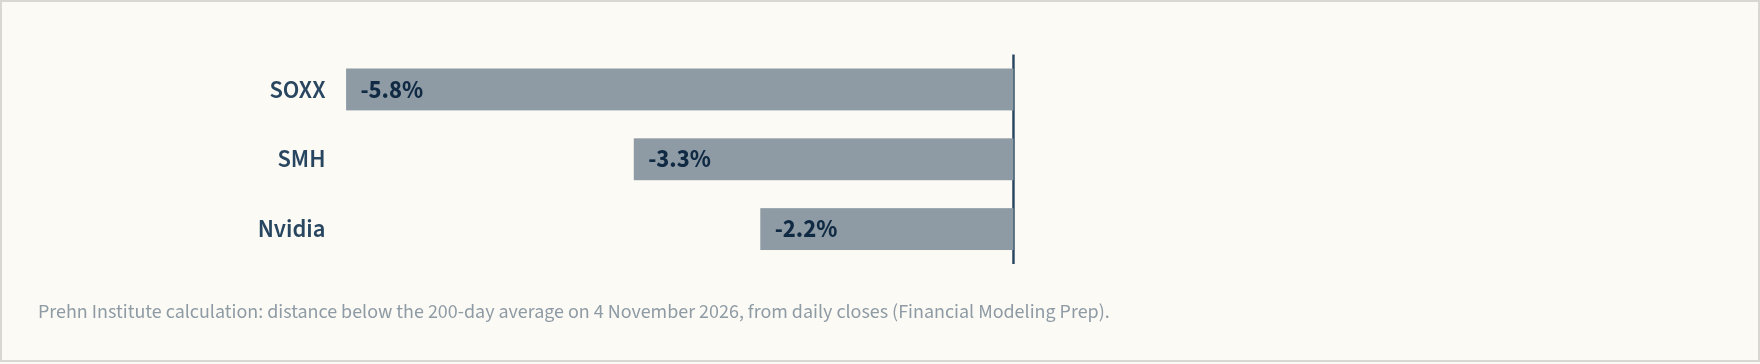
The 200-day line is just the average price over the last 200 trading days, roughly 10 months. Above it, most professionals call the trend up. Below it, down. You don't need to trade on it, but you should know where your own shares sit.
- −5.8%
- SOXX against its 200-day line, 4 Nov. 31% below its June high.
- −3.3%
- SMH against its 200-day line
- −2.2%
- Nvidia against its 200-day line, after a 3.2% fall on the day
Prehn Institute calculation from daily closes (Financial Modeling Prep), simple 200-day average to 4 November 2026.
So technology has the best record after a midterm. Why did the chips get hit? The answer is data centres.
The Data Centre Split
Fewer new data centres. Who wins, who loses.
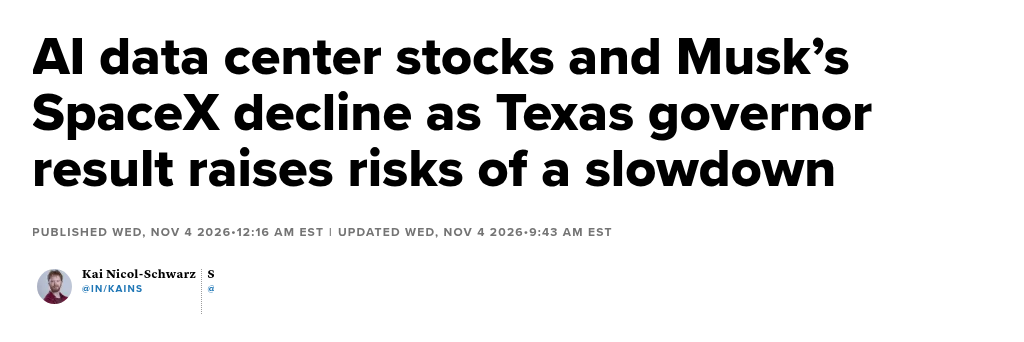
Wells Fargo estimates Texas holds 27% of planned American data centre capacity. The Democrat who won the governor's race, Gina Hinojosa, campaigned on a moratorium. She would still need a Republican legislature. And Democrats also won the governor's races in Georgia, Ohio and Pennsylvania.
| Group | Why | 4 Nov move |
|---|---|---|
| Own existing data centres Microsoft, Amazon, Alphabet, Meta | Existing capacity is worth more when new building is harder | +6.7%, +6.1%, +3.2%, +1.4% |
| Chip suppliers SOXX, SMH, Nvidia | Big buyers spread their spending over more years | −3.1%, −2.8%, −3.2% |
| Neoclouds CoreWeave, Nebius, IREN | Already heavy borrowers. More to give back to local communities, so thinner returns. | −9.9%, −6.7%, −11.2% |
Your index fund can't show you any of that. It averages the winners and the losers together, so you only find out which side you were on when you open your statement.
Is the chip sell-off an overreaction or a warning? It could be either. So check what you own. In Winston Daily, the danger zone filter flags names whose trend has turned down.
Gold's Margin Calls
Forced selling has a habit of running out
- Borrowed to buy tech shares
- Shares fall. The broker calls.
- Sell what sells fastest: gold
Gold hit its lowest level in more than a year this week, in the middle of a war. Odd? Commerzbank looked into it. Its analyst Carsten Fritsch said tech losses forced some investors to sell gold to meet margin calls.
Once the forced sellers have sold, there's nobody left who has to. And on 4 November the big gold fund, GLD, rose 3.7%.
Education, not advice. Gold is not a recommendation in this briefing.
Learn To Invest
Lenders kept up. Owners built wealth.
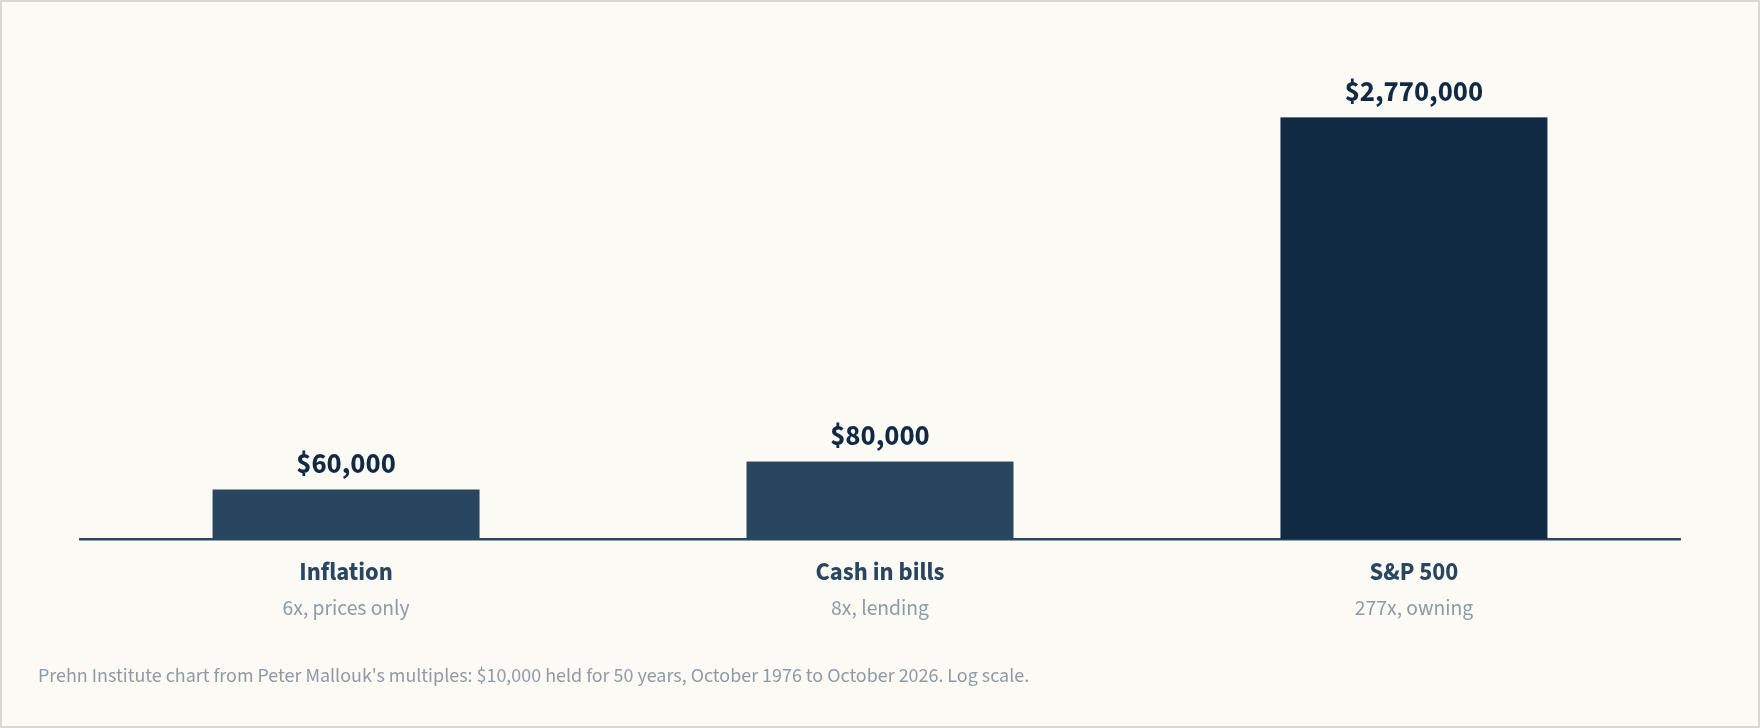
- 6x
- Inflation
- 8x
- Cash in short-term government bills
- 277x
- S&P 500 with dividends reinvested
Cash in the bank is lending. You lend the bank your money and it pays you about enough to keep up with prices, and in some years not even that, so your savings can shrink in real terms while the balance on your screen looks fine.
But owning shares means owning part of businesses that grow. So a boom only makes you richer if you own something when it happens.
What Could Spoil It
Plan for being wrong
| What could spoil it | Window | What it would do | Nearest analogue |
|---|---|---|---|
| Funding deadline | 11 December 2026 | A split Washington fights over the debt ceiling and the government shuts. | 2011: the S&P 500 fell 17.3% from 7 July to 8 August, and America lost its top credit rating. |
| A December rate rise | 10 December, FOMC | The Fed held last time, but 2 officials voted to raise and markets price a real chance. | Higher rates lower what investors will pay for future earnings, and the chips fall first. |
| The AI trade rolls over | Now, watch daily | The chip funds are already below their 200-day line. | SOXX sat 5.8% below the line and 31% below its June high on 4 November. |
| Oil spikes again | If the Iran talks stall | A war that drags on keeps oil bid, which feeds back into inflation. | Brent fell 8.7% on 4 November purely on hopes of a deal. |
Your own checklist
- List every holding you own, including what sits inside your funds.
- Mark each one by sector. How much is energy? How much is chips?
- Do you own the data centre owners, the chip suppliers or the neoclouds? They moved in different directions.
- Check which names sit below their 200-day line.
- If you're in cash, write down the plan that gets you back in. Then follow it.
Learn To Spot Where The Money Goes Next
The Great Pivot
Spotting where the money is going next is a skill. A skill you were never taught. Which is not your fault at all, but your responsibility to learn if you want to be on the right side of this boom.
Check The Work
Data room
Every number in this briefing comes from one price source, Financial Modeling Prep, read as daily closing prices. This page gives the method and the raw figures, so you can rebuild any chart yourself rather than take our word for it.
Method
Returns after an election. Measured from the election day close to the last close on or before the same calendar date 1, 3, 6 and 12 months later. Price only, dividends excluded. The 7 elections are the comparable ones where a Republican president lost Congress: 1954, 1958, 1970, 1974, 1986, 1990 and 2006.
Distance from the 200-day line. The simple average of the last 200 daily closes to 4 November 2026, with the latest close then measured against it as a percentage.
A sector against the S&P 500. Each sector fund's one-day move on 4 November 2026, minus the S&P 500's move on the same day.
The one-year return behind the elections chart
| Election | 1 year S&P 500 | Election | 1 year S&P 500 |
|---|---|---|---|
| 1954 | +33.2% | 1986 | +1.1% |
| 1958 | +11.1% | 1990 | +25.1% |
| 1970 | +12.7% | 2006 | +6.7% |
| 1974 | +18.7% | Average | +15.5% |
Distance from the 200-day line, 4 November 2026
SOXX 5.8% below, SMH 3.3% below, Nvidia 2.2% below. The full sector spread, from consumer discretionary at +2.57% to energy at 6.29% below the S&P 500, sits in the table on page 7.
The source call
Daily closes were read from financialmodelingprep.com/stable/historical-price-eod/light for each symbol and index, and every average and distance above was computed from those closes.
Disclaimer
This briefing is for educational purposes only and does not constitute financial advice. It is not a recommendation to buy or sell any asset or security. All investment carries risk, including the loss of principal. Past performance is not indicative of future results. The Prehn Institute takes no sponsorships or endorsements.