
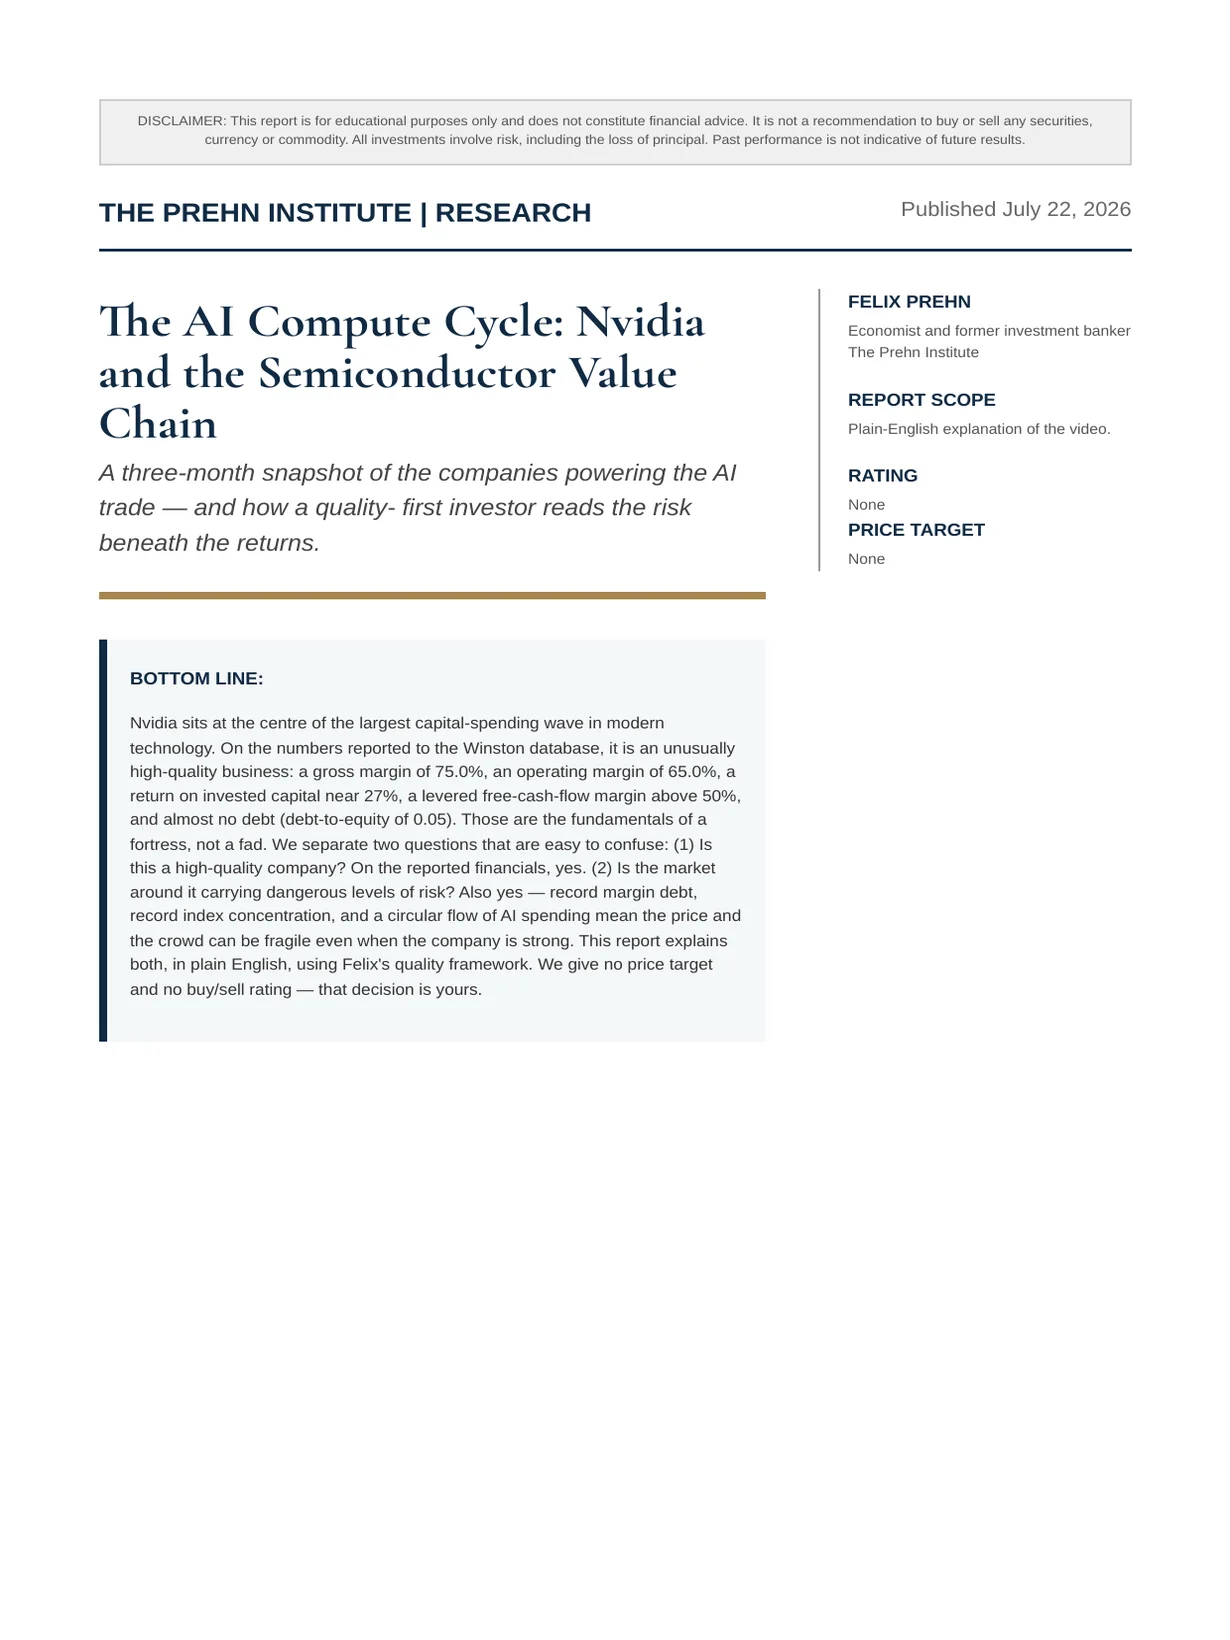
The AI Compute Cycle: Nvidia and the Semiconductor Value Chain
A three-month snapshot of the companies powering the AI trade — and how a quality- first investor reads the risk beneath the returns.
Felix Nikolas Prehn · 22 July 2026 · 21 pages
Bottom line
Nvidia sits at the centre of the largest capital-spending wave in modern technology. On the numbers reported to the Winston database, it is an unusually high-quality business: a gross margin of 75.0%, an operating margin of 65.0%, a return on invested capital near 27%, a levered free-cash-flow margin above 50%, and almost no debt (debt-to-equity of 0.05). Those are the fundamentals of a fortress, not a fad. We separate two questions that are easy to confuse: (1) Is this a high-quality company? On the reported financials, yes. (2) Is the market around it carrying dangerous levels of risk? Also yes — record margin debt, record index concentration, and a circular flow of AI spending mean the price and the crowd can be fragile even when the company is strong. This report explains both, in plain English, using Felix's quality framework. We give no price target and no buy/sell rating — that decision is yours.
Overview
an endorsement of its stock.
Winston · The Prehn Institute
Contents
- Executive Summary — The Bottom Line
- Investment Thesis: The AI Compute Cycle
- Industry Overview: The AI Semiconductor Value Chain
- How We Pick Great Stocks — Felix's Quality Framework
- Nvidia: Is the Business Profitable?
- Nvidia: Is It Generating Cash?
- Nvidia: Is It Financially Stable?
- Nvidia: Valuation & Earnings Consistency
- Nvidia: The Moat
- The Competitive Landscape: AMD, Broadcom, TSMC
- The Memory Link: Why Korea Matters to US Investors
- The Circular Capex Loop
- Concentration & Leverage: The Market-Level Risk
- Risk Factors
- Opportunities
- Lower-Risk Exposure: Sector ETFs
- Felix's Growth-Stock Criteria, Applied
- Conclusion
- How to Use This Report With the Winston App
- Citations & Sources
- About Felix Prehn and The Prehn Institute
Winston · The Prehn Institute
The Engine Room of the AI Trade
Reading the quality of the businesses everyone is betting on — before you bet on them
too.
BOTTOM LINE:
Nvidia sits at the centre of the largest capital-spending wave in modern technology. On the numbers reported to the Winston database, it is an unusually high-quality business: a gross margin of 75.0%, an operating margin of 65.0%, a return on invested capital near 27%, a levered free-cash-flow margin above 50%, and almost no debt (debt-to-equity of 0.05). Those are the fundamentals of a fortress, not a fad. We separate two questions that are easy to confuse: (1) Is this a high-quality company? On the reported financials, yes. (2) Is the market around it carrying dangerous levels of risk? Also yes — record margin debt, record index concentration, and a circular flow of AI spending mean the price and the crowd can be fragile even when the company is strong. This report explains both, in plain English, using Felix's quality framework. We give no price target and no buy/sell rating — that decision is yours.
1. INVESTMENT THESIS: THE AI COMPUTE
CYCLE
The one-sentence thesis. The world's largest technology companies are spending unprecedented amounts of money to build artificial-intelligence infrastructure, and a small number of semiconductor companies — with Nvidia first among them — convert that spending into revenue, cash, and very high margins.
Why it matters now. Combined 2026 capital expenditure by the major cloud “hyperscalers” is running at roughly $725 billion, up from about $400–410 billion in 2025 — an increase of nearly 77% in a single year. When one company spends on AI data centres, that spending becomes another company's revenue. Nvidia is the largest single beneficiary of that flow.
The two-sided view. Our analysis suggests the businesses at the core of this cycle are genuinely high quality by the fundamental measures that matter. At the same time, the market pricing those businesses shows classic late-cycle stress: record use of borrowed money and record concentration in a handful of names. A great company and an over-heated market can exist at the same time. A disciplined investor holds both ideas at once.
IN PLAIN ENGLISH Imagine the whole town suddenly decides to build swimming pools. One company sells almost all the pumps every pool needs. That company (Nvidia) is going to do very well while everyone is building. The question isn't “is the pump company good?” — it clearly is. The question is “what happens to the share price if the town suddenly stops building pools, especially if people borrowed money to buy the pump company's stock?”
2.
INDUSTRY
OVERVIEW:
THE
AI
SEMICONDUCTOR VALUE CHAIN
A chain, not a single company. The AI trade is often described as “Nvidia,” but it is really a chain of specialised companies, each doing one job. Understanding the chain is the fastest way to understand where the profit — and the risk — actually sits.
The designers. Companies such as Nvidia (NVDA), AMD (AMD), and Broadcom (AVGO) design the chips and systems that train and run AI models. They own the intellectual property and capture very high margins, but they do not own the factories.
The manufacturer. Taiwan Semiconductor Manufacturing Company (TSM) physically produces the most advanced chips for nearly all of the designers. This makes TSMC a shared dependency — and a shared risk — for the entire industry.
The memory makers. AI accelerators need enormous amounts of high-bandwidth memory, supplied by a handful of firms including Micron (MU), SK Hynix, and Samsung. As Section 11 explains, this is exactly where the recent South Korea scare began.
The buyers. At the end of the chain sit the hyperscalers — Microsoft, Alphabet, Amazon, and Meta — whose capital budgets fund the whole system.
| Layer | Role in the chain | Representative companies | Where the risk concentrates |
|---|---|---|---|
| Buyers (demand) | Fund AI build-out through capital spending | Microsoft, Alphabet, Amazon, Meta | A capex cut here ripples down the whole chain |
| Chip & system | |||
| designers | |||
| Design AI accelerators and | |||
| networking | |||
| Nvidia, AMD, Broadcom | Demand concentration; competitive | ||
| displacement | |||
| Foundry | |||
| (manufacturing) | |||
| Produce the most advanced chips | TSMC | Single-point dependency; geographic risk | |
| Memory | Supply high-bandwidth memory for | ||
| AI | |||
| Micron, SK Hynix, Samsung | Cyclical pricing; the recent Korea trigger |
Reading the chain. We expect the designers to keep the highest margins while demand is strong, because they own the intellectual property. But the same feature that makes the chain profitable — every layer depending on the layer above — is what makes it fragile. A slowdown at the “buyers” layer flows all the way down.
3. How We Pick Great Stocks — Felix's Quality Framework
We do not analyse a company by guessing where its share price will go. We analyse the business. Felix's framework asks four simple questions in order: Is it profitable? Is it generating cash? Is it financially stable? And only then: is it reasonably valued? The table below is the exact checklist we apply to every name in this report.
IN PLAIN ENGLISH Before you buy a lemonade stand, you'd ask: does it make money, does that money actually end up in the cash box, could it survive a bad week, and are you paying a fair price? Same idea — just for real companies.
IS THE BUSINESS PROFITABLE?
Gross Margin Indicates the size of the moat. Reveals core efficiency and its ability to absorb shocks.
Operating Margin Reveals profitability after all operational costs. A good measure of cost control.
ROCE Reveals the return to all financial stakeholders (equity and debt). A good measure of management effectiveness.
IS IT GENERATING CASH?
Cash conversion Ability to convert profits into cash. A good measure of efficiency and flexibility.
| Levered Free Cash Flow Margin | Reveals what portion of sales ends up as cash. |
|---|---|
| IS IT FINANCIALLY STABLE? | |
| Leverage | A measure of financial risk. Tells a story about the volatility of returns. |
| Interest cover | Degree of financial comfort regarding debt. A high ratio suggests financial stability and flexibility. |
| VALUATION | |
| P/E + Forward P/E | Short-term valuation snapshot plus a forward-looking view. This is the least important of our metrics. |
| Is earnings growth consistent? | Shows whether management and the business are reliable or cyclical. |
| Are EPS increasing consistently? | Reveals whether shareholder value is increasing or being diluted. |
| MOAT — A UNIQUE EDGE OVER COMPETITORS | |
| Cost advantage | The ability to produce more cheaply than rivals. |
| Size advantage | Economies of scale that competitors cannot match. |
| High switching cost | Customers find it painful or expensive to leave. |
| Patents, brand, licenses | Legal or brand protection that keeps competitors out. |
4. Nvidia: Is the Business Profitable?
Gross margin — the moat test. In its most recent reported quarter (period ended January 25, 2026), Nvidia posted a gross margin of 75.0%. A company that keeps 75 cents of gross profit on every sales dollar has enormous pricing power — a signal, in Felix's framework, of a wide moat and an ability to absorb shocks.
Operating margin — cost control. Operating margin was 65.0% in the same quarter. It is unusual for a company of this size to convert nearly two-thirds of revenue into operating profit; it tells us the business scales without a matching rise in costs.
Return on invested capital. ROIC (our read of Felix's ROCE test) was approximately 26.7%. In simple terms, for every $100 the business puts to work, it generated roughly $27 of return — a strong sign of management effectiveness.
The trend, not just the snapshot. Over the four most recent quarters, revenue rose from $44.1bn to $68.1bn, while gross margin expanded from about 60.5% to 75.0%. Rising revenue and rising margins together is the profile of a company still in the strong part of its cycle. We note this is a trailing observation, not a forecast.
IN PLAIN ENGLISH For every $1 Nvidia sells, about 75 cents is left after making the product, and about 65 cents is left after running the whole company. That's exceptionally high — most companies would be thrilled with a fraction of that.
Q1 (Apr ’25) Q2 (Jul ’25) Q3 (Oct ’25) Q4 (Jan ’26)
| Quarter (FY2026) | Period end | Revenue | Gross margin | Operating margin | ROIC | EPS |
|---|---|---|---|---|---|---|
| Q1 | Apr 27, 2025 | $44.06B | 60.5% | 49.1% | 23.4% | $0.77 |
| Q2 | Jul 27, 2025 | $46.74B | 72.4% | 60.8% | 26.2% | $1.08 |
| Q3 | Oct 26, 2025 | $57.01B | 73.4% | 63.2% | 28.3% | $1.31 |
| Q4 | Jan 25, 2026 | $68.13B | 75.0% | 65.0% | 26.7% | $1.77 |
$44.1B
$46.7B $57.0B $68.1B
5. Nvidia: Is It Generating Cash?
Why cash beats profit. Reported profit is an accounting figure; cash is what a company can actually spend, save, or return to shareholders. Felix's framework insists that profit must turn into cash. A company that reports profits but never produces cash is a warning sign.
Levered free-cash-flow margin. In the most recent quarter, Nvidia's levered free-cash-flow margin was 51.2% — meaning just over half of every sales dollar converted into free cash after operating costs, capital spending, and financing costs. For context, across the four most recent quarters the figure moved between roughly 28.8% and 59.4%, which reflects the timing of large capital and working- capital movements rather than any weakness in the underlying model.
Cash conversion. A levered FCF margin above 50% alongside a net margin near 63% indicates strong cash conversion: the profit the company reports is largely showing up as real cash. In Felix's terms, that is efficiency and flexibility — the company can fund its own growth, weather a downturn, and return capital without borrowing.
IN PLAIN ENGLISH Some companies look profitable on paper but the money never actually arrives. Nvidia's cash box fills up roughly in line with its profits — that's the healthy version.
| Quarter (FY2026) | Period end | Net margin | Levered FCF margin |
|---|---|---|---|
| Q1 | Apr 27, 2025 | 42.6% | 59.4% |
| Q2 | Jul 27, 2025 | 56.5% | 28.8% |
| Q3 | Oct 26, 2025 | 56.0% | 38.8% |
| Q4 | Jan 25, 2026 | 63.1% | 51.2% |
6. Nvidia: Is It Financially Stable?
Leverage — the survival test. The single most dangerous thing in the market right now is borrowed money (see Sections 11–13). So we look hard at how much debt a company itself carries. Nvidia's debt-to-equity ratio in the latest quarter was 0.05 — effectively a rounding error relative to its equity base of about $157bn. The company is not dependent on borrowing to operate.
Interest cover. Because debt is so small relative to profit, Nvidia's operating income covers its interest expense many hundreds of times over. In Felix's framework, that is the maximum degree of financial comfort: the company could withstand a severe downturn in earnings without any threat from its lenders.
Why this matters for the bubble debate. There is an important distinction in this report. The company Nvidia carries almost no leverage. The risk in the AI trade comes from leverage held by investors — people buying the stock (and leveraged funds tracking it) with borrowed money. A rock-solid balance sheet at the company does not protect a shareholder who bought on margin.
IN PLAIN ENGLISH Nvidia the company barely borrows — it's financially bulletproof. But if you borrow money to buy its shares, your position is fragile even though the company isn't. Never confuse the two.
| Quarter (FY2026) | Period end | Total debt | Total equity | Debt / Equity | Interest cover |
|---|---|---|---|---|---|
| Q1 | Apr 27, 2025 | $8.46B | $83.84B | 0.10 | >340x |
| Q2 | Jul 27, 2025 | $8.47B | $100.13B | 0.08 | >450x |
| Q3 | Oct 26, 2025 | $8.47B | $118.90B | 0.07 | >590x |
| Q4 | Jan 25, 2026 | $8.47B | $157.29B | 0.05 | >600x |
7. Nvidia: Valuation & Earnings Consistency
Valuation is the least important test — but not unimportant. Felix's framework treats the price-to-earnings ratio as the last question, not the first. A great business bought at an extreme price can still be a poor investment; a fair price paid for a quality business is the goal. We deliberately give no price target and no rating. We note only the principle: the higher the multiple the market pays, the more of the future is already priced in, and the less room there is for disappointment.
Earnings consistency. On the reported figures, Nvidia's earnings per share rose in each of the four most recent quarters ($0.77, $1.08, $1.31, $1.77). Consistently rising EPS — rather than a single lucky quarter — is what Felix's framework wants to see: evidence that shareholder value is increasing and not being diluted away.
The cyclicality caveat. Semiconductors are historically a cyclical industry. Four strong quarters do not repeal that cycle. The key forward risk (Section 14) is that today's earnings are being driven by a capital-spending wave that may not repeat at the same pace.
IN PLAIN ENGLISH Even the best company can be a bad buy if you pay too much. We're not telling you what to pay — we're reminding you to check the price in the Winston app and to remember that a very high price leaves little room for bad news.
8. NVIDIA: THE MOAT
Size advantage. Nvidia's scale lets it invest more in each new chip generation than almost any rival, spreading enormous research costs across a huge revenue base.
High switching costs. Nvidia's software ecosystem (the tools developers use to build AI on its chips) is deeply embedded in how AI is built. Moving to a competitor means rewriting and re-testing large amounts of work — a powerful lock-in.
Brand and patents. Nvidia holds extensive intellectual property and a brand that has become shorthand for AI compute, reinforcing both pricing power and customer preference.
Our read. On all four of Felix's moat tests, Nvidia scores strongly. The moat is the best explanation for why the margins in Section 4 are so high — and why they have, so far, been durable. A moat can still narrow if a credible competitor's software ecosystem matures, which is why we watch AMD and the hyperscalers' in-house chips closely.
9. The Competitive Landscape: AMD, Broadcom, TSMC
We selected the three competitors we consider most relevant to Nvidia's position: AMD (its closest direct rival in AI accelerators), Broadcom (custom AI chips and networking), and TSMC (the foundry that manufactures for all of them). Comparing them on the same quality metrics shows just how unusual Nvidia's current profitability is.
AMD. A genuine technology competitor, but the reported numbers show a different quality tier today: gross margin around 54.3% and operating margin around 17.1% in its most recent quarter, with ROIC near 2.6%. AMD is growing, but it converts far less of each sales dollar into profit and return than Nvidia.
Broadcom. A high-margin, cash-generative business (gross margin about 65.6%, operating margin about 45.0%, levered FCF margin about 41.5%). The key difference is the balance sheet: Broadcom carries meaningful debt, with a debt-to- equity ratio around 0.83 — a legacy of acquisitions — versus Nvidia's 0.05. Higher leverage means more financial risk if conditions tighten.
TSMC. The manufacturer at the heart of the chain, with a gross margin around 66.2% and operating margin around 58.0%. TSMC's figures are reported in New Taiwan dollars, so we compare it on margins and ratios rather than absolute dollars. Its importance is structural: if TSMC stumbles, every designer stumbles with it.
IN PLAIN ENGLISH Think of four companies in the same race. Nvidia is keeping the most profit out of every sale, Broadcom is close but carries more debt, TSMC makes the parts for everyone, and AMD is competitive but earning much thinner margins right now.
| Metric | Nvidia (NVDA) | Broadcom (AVGO) | AMD (AMD) | TSMC (TSM) |
|---|---|---|---|---|
| Period end | Jan 25, 2026 | Feb 1, 2026 | Dec 27, 2025 | Mar 31, 2026 |
| Gross margin | 75.0% | 65.6% | 54.3% | 66.2% |
| Operating margin | 65.0% | 45.0% | 17.1% | 58.0% |
| Net margin | 63.1% | 38.1% | 14.7% | 50.5% |
| ROIC | 26.7% | 5.9% | 2.6% | 9.6% |
| Levered FCF margin | 51.2% | 41.5% | 23.2% | 32.9% |
| Debt / Equity | 0.05 | 0.83 | 0.06 | 0.17 |
| Interest cover | >600x | ~12x | ~49x | very high |
| EPS (latest Q) | $1.77 | $1.55 | $0.93 | NT$111.55 |
10. The Memory Link: Why Korea Matters to US Investors
The trigger came from memory. The recent scare that hit South Korea's market began in the memory-chip corner of the value chain. A wobble in US memory-maker sentiment fed straight into the shares of Samsung and SK Hynix — which, together, make up more than half of South Korea's entire KOSPI index.
Why a two-stock market broke so hard. When just two companies are more than 50% of an index, the whole market moves like those two stocks. There is no diversification underneath the surface. When memory sentiment turned, there was nothing to cushion the fall — and the index dropped roughly 25% from its June 2026 peak.
The US relevance. The same memory names supply the high-bandwidth memory that Nvidia's accelerators need. So the memory layer is both a dependency for the US AI trade and a live example of how quickly a concentrated, leveraged market can unwind. The fuse that lit Korea runs through the same industry the US is betting on.
The lesson, not the panic. We are not predicting a US crash. We are pointing out a structural similarity: concentration plus leverage equals fragility. Korea is the worked example; Sections 12–13 show where the equivalent US pressure points are.
IN PLAIN ENGLISH South Korea's stock market was basically two companies in a trench coat. When one part of the chip world sneezed, the whole market caught a cold — because there was nothing else holding it up.
11. The Circular Capex Loop
One company's spending is another's revenue. The engine of the AI trade is a loop. The hyperscalers — Microsoft, Alphabet, Amazon, and Meta — are spending roughly $725 billion in 2026 on AI infrastructure, up from about $400–410 billion in 2025. A large share of that spending becomes revenue for chip designers and manufacturers, which supports their share prices, which supports the confidence to keep spending.
Why loops are powerful — and fragile. While the loop spins forward, everyone wins and the numbers look spectacular. But loops can spin in reverse. If one major buyer signals it is cutting AI spending, the revenue underneath the whole chain wobbles at once — because it is the same money circulating.
The historical rhyme. In 2000, when a small number of large buyers cut technology spending, the earnings assumptions holding up the whole sector unravelled; the Nasdaq ultimately fell about 78% from its peak. We are not forecasting a repeat. We are noting that capital-spending cycles have turned before, and the one number that matters most is the buyers' capex intentions.
IN PLAIN ENGLISH Four giant customers are handing hundreds of billions to the chip makers, whose soaring stock prices make everyone feel rich enough to keep spending. It works beautifully — until one big customer says “we're spending less,” and the music slows for everyone at the same time.
| Item | 2025 | 2026 | Change |
|---|---|---|---|
| Combined hyperscaler AI capex | ~$400–410B | ~$725B | +~77% |
| What it funds | AI data centres, accelerators, networking, memory — the demand behind chip-maker revenue | — |
12. Concentration & Leverage: The Market-level Risk
Your index fund may be an AI bet in disguise. The top 10 stocks now make up roughly 36–37% of the S&P 500 (they peaked above 40% at the end of 2025), versus a historic norm of about 18–23%. The three largest — Nvidia, Apple, and Microsoft — are around 18% of the entire index between them. A “diversified” index fund is now heavily tied to a small group of AI-exposed names making a similar bet.
Record borrowed money. US margin debt reached roughly $1.5 trillion in mid-2026, an all-time record. As a share of the economy that is about 4.5–5% of GDP — higher than at the dot-com peak (~2.0%) or in 2007 (~2.3%). Every previous margin-debt extreme (1968, 1972, 1987, 2000, 2007, 2018, 2021) preceded a market correction or crash.
The Korea comparison. At its peak, South Korea's margin debt was about $26 billion — roughly 1.3% of its economy. The US figure, at roughly 4.7% of GDP, is proportionally around three to four times higher — before counting leveraged ETFs and options that do not even appear in the official margin number.
IN PLAIN ENGLISH Two hidden risks sit under the AI trade: (1) “safe” index funds are now packed with the same few AI stocks, and (2) investors are using more borrowed money than ever before. Neither is about Nvidia's quality — both are about how crowded and leveraged the bet has become.
| Measure | South Korea (peak) | United States (mid-2026) |
|---|---|---|
| Margin debt (approx.) | ~$26 billion | ~$1.5 trillion |
| As a share of GDP | ~1.3% | ~4.7% (record) |
| Market concentration | 2 stocks > 50% of KOSPI | Top 10 ≈ 36–37% of S&P 500 |
| Outcome / status | ~25% drawdown from June 2026 peak | Elevated risk; not a prediction |
13. Risk Factors
Capex-cycle risk. The largest single risk is that hyperscaler capital spending slows. Because so much chip-maker revenue depends on a handful of buyers, a spending cut would hit reported earnings across the value chain quickly.
Concentration risk. With the top 10 names near record weights in the S&P 500, a decline in a few AI leaders can drag down the whole index — including funds investors believe are diversified.
Leverage risk (market, not company). Record margin debt and the popularity of leveraged and single-stock leveraged ETFs (for example products tracking 2x a single AI stock) mean forced selling can accelerate a downturn. This risk sits with investors, not with Nvidia's balance sheet.
Cyclicality & memory pricing. Semiconductors are historically cyclical. Memory pricing in particular can swing sharply, as the Korea episode showed.
Competitive & customer-concentration risk. Nvidia faces competition from AMD and from hyperscalers designing their own chips. Its largest customers are also, increasingly, potential competitors.
Geopolitical & supply risk. The chain depends heavily on TSMC and on globally sensitive supply routes; export rules and regional tensions are real, hard-to-model risks.
Valuation risk. When a great deal of future growth is already reflected in the price, even a small disappointment can produce a large price reaction.
14. OPPORTUNITIES
Genuine, durable demand. Unlike some past manias, the AI build-out is backed by real revenue and real cash generation at the core companies, as the fundamentals in this report show. This is not a story with no earnings behind it.
Quality compounding. A business with 75% gross margins, high ROIC, strong cash conversion, and almost no debt has the ingredients to keep reinvesting through a cycle — the profile Felix's framework prizes.
Preparation turns crashes into sales. The investor who keeps some cash and a written plan can treat a sell-off as an opportunity rather than a catastrophe. In Korea, disciplined and foreign buyers stepped in during the forced selling. A plan lets other people's panic become your entry.
Lower-risk ways to participate. For those who want exposure to the theme without betting on a single name, a diversified sector ETF (Section 15) spreads risk across the whole chain.
15. Lower-risk Exposure: Sector ETFs
Why an ETF can lower single-stock risk. Buying one stock concentrates your outcome in one company. A sector exchange-traded fund (ETF) spreads your money across many companies in the same industry, so a stumble at any single name matters less. It does not remove market risk — if the whole sector falls, the ETF falls — but it removes the risk of being wrong about one specific company.
Two semiconductor ETFs we selected for illustration. The VanEck Semiconductor ETF (SMH) and the iShares
Semiconductor ETF (SOXX) both give broad, diversified exposure to the semiconductor industry — including the designers, the foundry, and the memory names discussed in this report — in a single holding. We selected these two as representative, liquid, well-established sector funds; this is illustrative, not a recommendation to buy them.
Read the concentration inside the ETF. One caution ties directly to Section 12: because these ETFs are weighted by company size, the largest AI names can still dominate the fund. “Diversified” does not always mean “equally weighted.” Always check the current top holdings and their weights — you can review the live holdings, weights, and metrics for SMH, SOXX, and their constituents in the Winston app at
IN PLAIN ENGLISH An ETF is like buying a fruit basket instead of a single apple. If one apple is bad, you've still got the rest. But if the whole orchard has a bad season, every basket suffers — and some baskets are mostly one giant apple, so check what's really inside.
| ETF | Ticker | What it holds | Why an investor might use it |
|---|---|---|---|
| VanEck Semiconductor ETF | SMH | A basket of leading semiconductor companies (designers, foundry, memory) | Broad single-industry exposure without picking one stock |
| iShares Semiconductor | |||
| ETF | |||
| SOXX | A diversified group of US-listed semiconductor companies | An alternative broad semiconductor basket |
16. Felix's Growth-stock Criteria, Applied
Because much of the AI trade is priced for growth, Felix applies a separate, stricter checklist to growth stocks. The table opposite is that exact checklist. Briefly applied to Nvidia on the reported data: operating margin is very high; revenue growth is strong and sector-leading; debt is very low; the cash position is strong; the target market (AI compute) is large; the brand and technology leadership are strong; and R&D spending is heavy. The main cautions are the ones this whole report stresses — valuation and cyclicality — not the quality of the business itself.
IN PLAIN ENGLISH Growth companies are harder to judge because you're betting on the future. Felix's rule: only pay up for growth when the company is highly profitable, barely borrows, leads its field, and is chasing a genuinely huge market. Then make sure you actually understand why it's better than its rivals.
ADDITIONAL CRITERIA FOR GROWTH STOCKS
Same valuation method applies.
More challenging — and therefore more risky — to pick growth stocks, as we lack data.
Need a longer time horizon to judge success by.
FOCUS ON THE METRICS THAT ARE AVAILABLE
High operating margin.
Strong revenue growth — it must beat others in the sector.
Low debt.
Good cash position to survive a crash.
Large target market with 25x TAM or more.
Strong, clean brand.
Technology leadership.
High R&D spend to build a moat.
CEO / FOUNDER HEAVILY INVESTED e.g. Tesla, Square, Spotify, MercadoLibre, AMD.
FULLY UNDERSTAND THE BUSINESS MODEL
Can you write down three reasons why this company is better than its competitors?
17. CONCLUSION
Two truths at once. Our analysis suggests Nvidia is, on the reported financials, one of the highest-quality large businesses in the market: exceptional margins, high returns on capital, strong cash conversion, and a fortress balance sheet. It passes Felix's quality tests comfortably.
And yet. The market pricing these businesses shows record concentration and record leverage, funded increasingly by borrowed money and amplified by leveraged products. South Korea is a live reminder of how quickly a concentrated, leveraged market can unwind — even when nothing is wrong with the underlying companies.
What we are and are not saying. We are not predicting a crash, and we are not telling you to buy or sell anything. We give no price target and no rating. We are saying: judge the company and the market separately, know exactly how much hidden leverage and concentration you are carrying, and decide your plan before the next headline — not during it.
The disciplined path. A quality business, bought at a sensible price, held without borrowed money, inside a plan you wrote in advance, is what turns other people's panic into your opportunity. That is the whole point of Felix's framework.
18. HOW TO USE THIS REPORT WITH THE
WINSTON APP
This report is a snapshot; the app is live. Every company figure here comes from the Winston app at
Check the ETF internals. Before using a sector ETF, use the app to review its current top holdings and weights — the single most important check for hidden concentration (Section 12).
Run your own quality screen. Apply Felix's checklist yourself: profitability, cash generation, stability, then valuation. The app is built to surface exactly these metrics.