
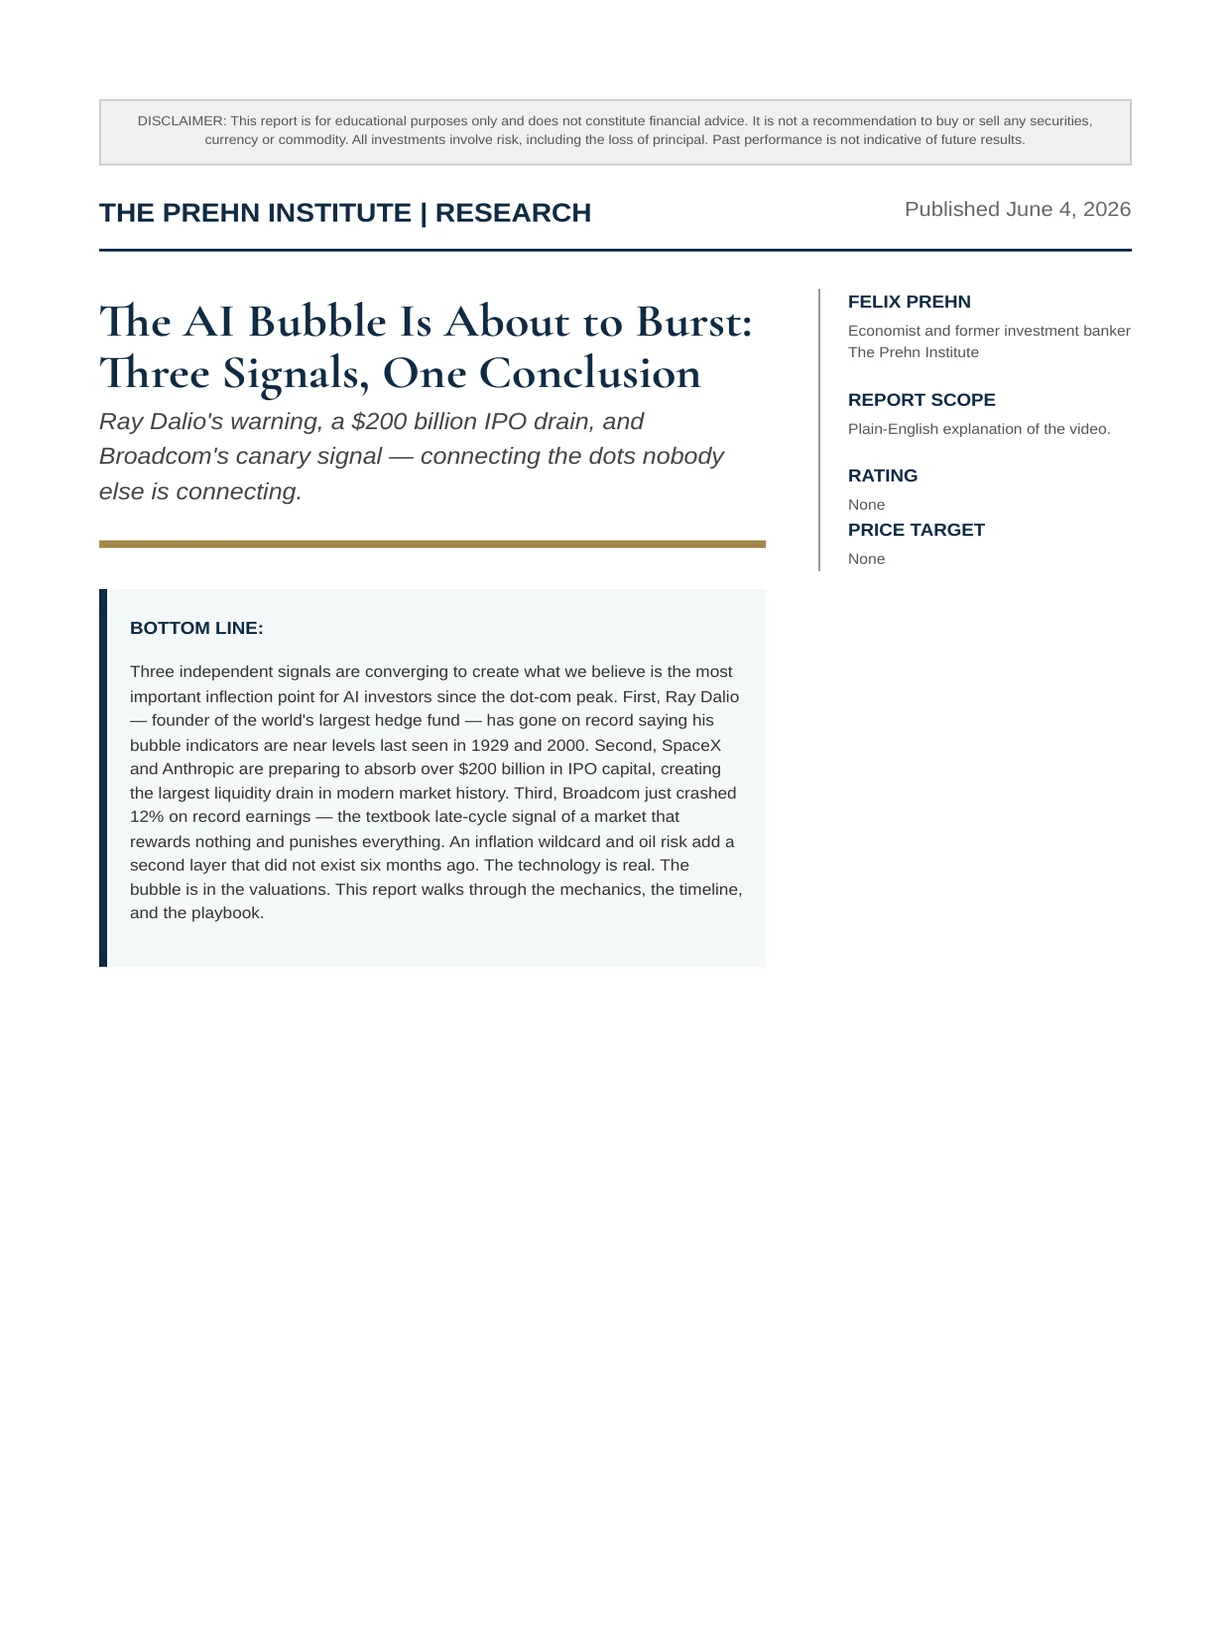
The AI Bubble Is About to Burst: Three Signals, One Conclusion
Ray Dalio's warning, a $200 billion IPO drain, and Broadcom's canary signal — connecting the dots nobody else is connecting.
Felix Nikolas Prehn · 4 June 2026 · 26 pages
Bottom line
Three independent signals are converging to create what we believe is the most important inflection point for AI investors since the dot-com peak. First, Ray Dalio — founder of the world's largest hedge fund — has gone on record saying his bubble indicators are near levels last seen in 1929 and 2000. Second, SpaceX and Anthropic are preparing to absorb over $200 billion in IPO capital, creating the largest liquidity drain in modern market history. Third, Broadcom just crashed 12% on record earnings — the textbook late-cycle signal of a market that rewards nothing and punishes everything. An inflation wildcard and oil risk add a second layer that did not exist six months ago. The technology is real. The bubble is in the valuations. This report walks through the mechanics, the timeline, and the playbook.
The Thesis: Three Signals, One
CONCLUSION
The Convergence. Our analysis identifies three independent signals that, when viewed together, form a coherent picture of a market approaching a critical inflection point. Each signal alone is noteworthy. Together, they describe a liquidity bubble with a specific mechanism, a specific timeline, and a specific set of risks that investors can prepare for.
Signal One: The Oracle Speaks. Ray Dalio, founder of Bridgewater Associates — the largest hedge fund in the world — went on Bloomberg and stated that his proprietary bubble indicators are near levels last seen in 1929 and 2000. His specific warning: "All great technology changes produce bubbles." He was careful to note that AI is real and transformative. The bubble is not in the technology. It is in the valuations.
Signal Two: The Liquidity Drain. SpaceX is listing on June 12 at a $1.77 trillion valuation. Anthropic has filed a confidential S-1 targeting October at $965 billion. Combined, these two IPOs need over $200 billion in capital — more than every US IPO since 2022 combined. That money must come from somewhere. Our analysis suggests it will come from existing AI proxy positions, creating structural selling pressure on the very stocks that have led this rally.
Signal Three: The Canary. On June 3, Broadcom reported record revenue (+48% YoY), semiconductor revenue that more than doubled (+143%), and earnings that beat estimates. The stock crashed 12% after hours. When a market sells good news, it is looking for reasons to exit. This is a textbook late-cycle signal.
The Wildcard. An inflation surprise and an oil risk from the Strait of Hormuz add a second dimension that did not exist six months ago. If inflation re- accelerates, the Federal Reserve loses the ability to rescue the market through rate cuts or money printing. Goldman Sachs has modelled oil at $150/barrel in a severely adverse scenario — a price that would function as a tax on every business and consumer on the planet.
Dalio Bubble Warning
▼
$200B+ IPO Liquidity Drain
▼
Broadcom Late-Cycle Signal
▼
Inflation + Oil Wildcard
▼
Danger Zone: Late 2026 → Early 2027
Exhibit 1: Signal convergence flow — three independent inputs pointing to a single conclusion.
Signal 1: Ray Dalio's Bubble
WARNING
Who Is Ray Dalio. Ray Dalio is the founder of Bridgewater Associates, the largest hedge fund in the world. He has been managing money through every major bubble, crash, and crisis for the last fifty years. When Dalio speaks about market structure, we listen.
What He Said. In a Bloomberg Television interview on June 3, 2026, Dalio made two critical statements. First: "All great technology changes produce bubbles." Second: "The pricking is the converting of wealth into money." The second quote is the more important one. It describes the exact mechanism by which bubbles burst — not through technological failure, but through a liquidity event where paper wealth must become real cash.
The Indicator Levels. Dalio confirmed that his proprietary bubble indicators — a composite measure he has refined over decades — are near levels last seen in 1929 and 2000. These are the two most significant market peaks in modern financial history. The 1929 peak preceded an 89% decline in the Dow Jones. The 2000 peak preceded a 78% decline in the
The AI Capex Problem. Dalio also referenced Bridgewater's estimate that the major technology companies — Alphabet, Amazon, Meta, and Microsoft — will spend approximately $650 billion on AI infrastructure in 2026, up from $410 billion in 2025. That is a 59% increase in a single year. The critical question: will this spending produce commensurate revenue? If it does not, we are looking at a $650 billion problem with no easy exit.
Key Data Point: Big Tech AI capex is estimated at $650 billion in 2026, up from $410 billion in 2025 — a 59% increase. This spending must convert to revenue, or it becomes the catalyst for a repricing event. (Source: Bridgewater Associates via Bloomberg, June 2026)
| Metric | Detail |
|---|---|
| Dalio Bubble Indicator | Near 1929 and 2000 levels |
| Big Tech AI Capex 2025 | ~$410 billion |
| Big Tech AI Capex 2026 (est.) | ~$650 billion |
| YoY Capex Increase | +59% |
| Companies Cited | Alphabet, Amazon, Meta, Microsoft |
Exhibit 2: AI capex estimates from Bridgewater Associates via Bloomberg Television, June 3, 2026.
The Liquidity Bubble Mechanic
Paper Wealth Is Not Money. The central insight of Dalio's warning — and the core thesis of this report
- is the distinction between paper wealth and actual money. AI companies have created trillions of dollars in paper wealth through rising valuations. But a valuation is not cash. You cannot pay taxes with a stock price. You cannot meet fund redemptions with a market capitalisation.
The Lemonade Stand. Consider a simple analogy. Imagine a lemonade stand is "worth" one million dollars because a neighbour said he would pay that much. But there is only ten thousand dollars in cash in the entire neighbourhood. If the owner tries to sell, who has the money to buy it? Nobody. The price collapses — not because the lemonade is bad, but because there is not enough actual money to support the valuation.
The Mechanism. The bubble bursts through a specific sequence. Insiders need actual cash — for taxes, for debt payments, for fund redemptions. They must sell. If many insiders need cash at the same time, there are not enough buyers. The selling pressure drives the price down, which triggers more selling, which drives the price down further. This is not a solvency crisis where companies go bankrupt. It is a liquidity crisis where paper wealth evaporates because there is not enough real money to absorb the selling.
Why This Matters Now. The IPO wave we are about to describe creates exactly this scenario. SpaceX and Anthropic are about to pull over $200 billion out of the market. After lockup periods expire, insiders and early investors will be legally permitted to sell for the first time. The question is not whether selling pressure will emerge — it is whether the market has enough liquidity to absorb it.
AI creates trillions in paper wealth
▼
Insiders need actual cash (taxes, debt, redemptions)
▼
Many sellers arrive at the same time
▼
Not enough buyers → Price collapses
Exhibit 3: The liquidity bubble mechanic — how paper wealth converts to real losses.
The Dot-com Parallel
The Technology Was Real. The critical lesson from 2000 is not that the technology failed — the internet did change everything. The lesson is that most of the companies built on that technology went to zero anyway. The technology survived. The investors who bought at the top did not. Amazon lost 93% of its value. Cisco lost 86%. Both companies were real businesses with real revenue. But their valuations had outrun their cash flows.
Market Concentration Today. Today, market concentration is at its highest level in fifty years. The top 10 stocks now make up 36% of the entire S&P 500. In 2000, that figure was 27%. We are more concentrated now than we were at the peak of the dot-com bubble.
The Key Difference. In 2000, only 14% of technology companies were profitable. Today's AI leaders — NVIDIA, Microsoft, Alphabet — are real businesses with real cash flows. This is not a solvency bubble where the companies go bankrupt. This is a liquidity bubble where the companies survive but the investors who buy at the top get hurt. The distinction is critical for positioning.
| Metric | Dot-Com (2000) | AI Bubble (2026) |
|---|---|---|
| Top 10 as % of S&P 500 | 27% | 36% |
| Tech Companies Profitable | 14% | AI leaders are cash machines |
| NASDAQ Peak-to-Trough | −78% | TBD |
| Wealth Destroyed | ~$5 trillion | TBD |
| Bubble Type | Solvency (companies went bankrupt) | Liquidity (companies survive, top-buyers don't) |
Signal 2: The $200 Billion IPO
DRAIN
SpaceX: The Largest IPO in History
The Numbers. SpaceX is listing on the Nasdaq on June 12 under ticker SPCX. The company is targeting a $1.77 trillion valuation and aims to raise approximately $75 billion. The offering uses a dual- class share structure. At $1.77 trillion, SpaceX would be valued at approximately 60 times its estimated revenue — a multiple that prices in decades of growth.
Why It Matters. This is the single largest IPO in history by a significant margin. $75 billion in fresh capital must be allocated by institutional investors, pension funds, and index funds. This capital does not appear from nowhere — it must be redirected from existing positions.
Anthropic: The AI Pure Play
The Numbers. Anthropic — the maker of Claude, the AI assistant — has filed a confidential S-1 with the SEC, targeting an October 2026 IPO. The company's valuation rose from $380 billion in February to $965 billion in May following its Series H raise of $65 billion. Its annualised revenue run rate is approximately $47 billion.
Valuation Velocity. A 150% valuation increase in three months — from $380 billion to $965 billion — is extraordinary even by AI standards. We note that this velocity of repricing typically occurs in the late stages of a hype cycle, when investors are competing to own the last remaining private asset before it goes public.
The Combined Capital Requirement
$200 Billion+. Combined, SpaceX and Anthropic alone need over $200 billion in new capital. To put this in perspective, this figure exceeds the total capital raised by every US IPO since 2022 combined. The sheer scale of this demand creates a structural liquidity problem that the market has never faced before.
The Signal. When the smartest founders in the world are all rushing to sell equity at the same time, that is not a coincidence. It is a signal. They are reading the same data. They want to sell at the top. And they want investors to be the buyers.
| IPO | Ticker | Target Date | Valuation | Capital Raise | Key Metric |
|---|---|---|---|---|---|
| SpaceX | SPCX | June 12, 2026 | $1.77 trillion | ~$75 billion | 60× revenue |
| Anthropic | TBD | ~October 2026 | $965 billion | ~$65B (Series H) | +150% in 3 months |
| Combined Capital Requirement | $200 billion+ |
The Proxy-to-direct Rotation
The Three-Year Proxy Trade. For the last three years, the only way to "play" AI through public markets was through the Magnificent Seven — Microsoft, NVIDIA, Alphabet, Amazon, and others. You could not buy OpenAI, so you bought Microsoft. You could not buy SpaceX, so you bought defence stocks and satellite companies. These were proxy trades — imperfect substitutes for the real thing.
Now You Can Buy the Real Thing. With SpaceX and Anthropic going public, investors can own the actual companies instead of proxies. Why own NVIDIA as an AI proxy when you can own Anthropic directly? Why own defence stocks as a space proxy when you can own SpaceX directly? We expect capital to rotate out of the proxies and into the direct plays.
The Structural Pressure. When SpaceX enters the Nasdaq 100 — which is likely given its market capitalisation — passive index funds are forced to buy SpaceX at whatever the market price is. They are literally forced to sell existing index constituents to make room. This is not discretionary selling. It is mandatory structural selling pressure on every other stock in the index.
Where Does $200 Billion Come From? There are only three sources. One: investors sell existing positions. Two: they borrow on margin. Three: they redirect new capital. In practice, the dominant mechanism is the first — selling existing positions. The question is not whether rotation will occur, but which stocks bear the brunt of it.
Mag 7 = AI proxy for 3 years
▼
SpaceX & Anthropic go public
▼
"Why own the proxy when you can own the real thing?"
▼
Capital rotates OUT of proxies → INTO direct plays
▼
Nasdaq 100 rebalancing = forced selling
Exhibit 6: The proxy-to-direct rotation mechanism.
SIGNAL
3:
BROADCOM
—
THE
Canary in the Coal Mine
The Earnings. On June 3, 2026, Broadcom reported Q2 FY2026 earnings that exceeded expectations on virtually every metric. Revenue came in at $22.19 billion, up 48% year over year. AI semiconductor revenue hit $10.8 billion, up 143% year over year. Earnings per share of $2.44 beat the consensus estimate of $2.40.
The Crash. And the stock dropped approximately 12% in after-hours trading. Record revenue. Beat estimates. AI revenue more than doubled. And the stock crashed 12% in a single session.
Why. Broadcom had already rallied approximately 40% year to date before the earnings report. Investors had priced in perfection. When the company guided strongly but maintained — rather than raised — its full-year AI revenue target of over $100 billion, investors took profits. This is textbook late-cycle behaviour: buy the rumour, sell the news.
The Deeper Signal. On the earnings call, Broadcom CEO Hock Tan named six core AI customers. Among them: Google, Meta, Anthropic, and OpenAI. Two of Broadcom's six biggest customers are companies that are about to IPO. The money is already flowing toward the new thing and away from the companies that used to be the only way to play AI.
What This Means. If a stock can report record revenue, beat estimates, and still crash 12%, that tells us the market is no longer rewarding good news. It is looking for reasons to sell. Historically, this is one of the most reliable signals of a late-cycle market — a market where the smart money is quietly heading for the exits.
| Broadcom Q2 FY2026 | Actual | YoY Change |
|---|---|---|
| Revenue | $22.19 billion | +48% |
| AI Semiconductor Revenue | $10.8 billion | +143% |
| Earnings Per Share | $2.44 | Beat $2.40 est. |
| Stock Move (After Hours) | −12% | |
| YTD Rally (Pre-Earnings) | ~+40% | |
| Full-Year AI Revenue Target | Maintained >$100 billion (not raised) |
Late-Cycle Signal: When good earnings are sold, the market is looking for the exit. This pattern — buy the rumour, sell the news — has historically preceded significant market corrections.
💡
First & Only LIVE Training on 'The Greatest Stock Market
Opportunity Before SpaceX IPO'
Get your free seat at
greatestplaybook.com
The Inflation Wildcard
The Macro Surprise. Everything described above assumes the Federal Reserve continues to provide liquidity support to the market. But recent macro data challenges that assumption. ADP jobs came in better than expected. Services PMI came in strong. Factory orders soared. The US Macro Surprise Index — which measures how much the economy is outperforming expectations — ripped to its strongest level since September 2023.
ISM Manufacturing. The ISM Manufacturing PMI hit 54.0, a four-year high and the fifth consecutive month of expansion. This is unambiguously strong economic data.
Good News Is Bad News. For the stock market, a hot economy is a problem. Strong economic data means inflation. Inflation means the Fed has less room to cut interest rates, less room to print money, and less room to bail out the market when things go sideways. This is the phenomenon Wall Street calls "good news is bad news" — where economic strength paradoxically hurts equities by constraining the Fed's ability to provide support.
The Safety Net Disappears. In our January analysis, we assumed the Fed would continue to print its way through any correction. The macro data now suggests this assumption may no longer hold. If inflation re-accelerates, the Fed may not be able to rescue the market even if it wants to. The safety net disappears.
Economy running hot (ISM PMI: 54.0, 4-year high)
▼
Inflation pressure increases
▼
Fed can't cut rates → Can't print → No safety net
| Macro Indicator | Reading | Significance |
|---|---|---|
| ISM Manufacturing PMI | 54.0 | 4-year high, 5th consecutive expansion |
| US Macro Surprise Index | Strongest since Sept 2023 | Economy beating expectations |
| ADP Jobs | Above expectations | Labour market remains tight |
| Services PMI | Strong | Services sector expanding |
Exhibit 9: Macro data summary.
The Oil Wildcard
The Strait of Hormuz. The Strait of Hormuz — the narrow waterway between Iran and Saudi Arabia — handles approximately 20% of the world's oil supply. Following the conflict with Iran, oil flows through the Strait dropped to 10% of normal levels. Goldman Sachs characterises this disruption as 17 times worse than the impact of the Ukraine war on energy markets.
Goldman's Worst Case. Goldman Sachs has modelled a severely adverse scenario in which oil reaches $150 per barrel. Their base case is more moderate — $80 to $90 for Brent crude by year end. But the worst case is the scenario that changes everything.
If Oil Spikes to $150. At $150 per barrel, inflation explodes. The Fed cannot cut rates. It may have to hike. Every business faces higher input costs. Every consumer pays more at the pump, at the grocery store, and on their heating bill. Rising oil is effectively a tax on every business and every consumer on the planet.
This Was Not in the January Thesis. Six months ago, the thesis was straightforward: Fed prints, market rallies, IPOs hit, lockups expire, correction comes. That sequence is still playing out. But inflation and oil add a second risk that was not part of the original framework. The Fed might not be able to rescue the market even if it wanted to — and an oil shock could break the entire setup before the lockup- driven correction even begins.
GOLDMAN BASE CASE
Brent crude: $80–$90/barrel by year end.
Manageable. Fed retains some flexibility.
GOLDMAN WORST CASE
Brent crude: $150/barrel.
Strait of Hormuz disruption. 17× worse than Ukraine impact. Inflation explodes. Fed forced to hike.
Exhibit 10: Goldman Sachs oil scenarios. Sources: The Guardian (March 2026), Yahoo Finance, Reuters (April 2026).
THE
Three-stage
TIMELINE
—
UPDATED
The January Model. In January 2026, we presented a three-stage model for how the year would unfold. Here is the update with what we know now.
Stage 1: The Fed Prints Happened Stage 1: The Fed Prints ✅ Happened We predicted that economic weakness would force the Federal Reserve to resume printing. This happened. The Fed initiated what it calls "reserve management purchases" at approximately $40 billion per month — $480 billion per year. Bank reserves had dropped to a four-year low. The Fed's emergency lending window hit record usage. Banks were running so low on cash that they had to borrow emergency money. So the Fed started pumping liquidity.
Stage 2: Money Floods In → IPOs Launch
✅ Happening Now We predicted that the liquidity injection would inflate asset prices, drive valuations to extremes, and prompt founders to rush to IPO at the top. This is exactly where we are. The market has been rallying. Broadcom was up 40% year-to-date before its earnings crash. SpaceX is IPO-ing next week. Anthropic has filed. The party is in full swing.
Stage 3: Lockups Expire → Correction ⏳
Coming
This is what lies ahead. SpaceX lists on June 12. For six months after the IPO, insiders and early investors are locked up — they cannot sell. That lockup expires around December 2026. Anthropic is targeting October 2026, with a lockup expiry around April 2027.
What Changed. Two things we did not anticipate in January. First: inflation running hot, which may prevent the Fed from rescuing the market. Second: the oil wildcard from the Strait of Hormuz. These add a parallel risk that could accelerate the correction or make it deeper than the base case.
STAGE 1 HAPPENED STAGE 1 ✅ HAPPENED Fed prints $40B/month ($480B/year) Bank reserves at 4-year low · Emergency lending at record
STAGE 2 HAPPENING NOW — WE ARE HERE STAGE 2 ✅ HAPPENING NOW — WE ARE HERE Money floods in → IPOs launch → Market rallies SpaceX IPO next week · Anthropic filed · Broadcom +40% YTD before crash
STAGE 3 COMING STAGE 3 ⏳ COMING Lockups expire → Insiders sell → Correction SpaceX lockup ~Dec 2026 · Anthropic lockup ~Apr 2027
Exhibit 11: Three-stage model, updated June 2026.
The Danger Zone: Late 2026 →
EARLY 2027
The Timeline. Based on the IPO and lockup schedule, we identify the period from approximately December 2026 through April 2027 as the primary danger zone. This is when the structural selling pressure from lockup expirations converges with midterm election uncertainty and the market's first real test of whether AI revenue justifies AI valuations.
JUNE 12, 2026 SpaceX IPO on Nasdaq (SPCX)
~OCTOBER 2026 Anthropic IPO (target)
~DECEMBER 2026 SpaceX 6-month lockup expires Insiders can sell for the first time
NOVEMBER 2026 US Midterm Elections Presidential cycle Year 2: historically weak (90% accurate since 1933)
~APRIL 2027 Anthropic lockup expires
⚠️ Danger Zone: December 2026 → April 2027. Lockup expirations + midterm uncertainty + AI revenue reality check. This is the window where the thesis gets tested. The question is not whether selling pressure arrives — it is whether the market can absorb it.
Thesis Confirmed. Our January forecast is now confirmed on multiple fronts. Dalio has validated the bubble thesis. Broadcom has shown us the late-cycle signal. SpaceX has actually filed. The IPO wave is not coming — it is here.
Two Scenarios
The Playbook Must Account for Both. Given the inflation wildcard and oil risk, we now model two distinct scenarios rather than one.
SCENARIO 1: BASE CASE
The classic correction.
Market rallies into the IPOs. Enthusiasm peaks around the SpaceX listing. After lockup periods expire (Dec 2026 → Apr 2027), insiders sell. The correction is orderly but meaningful. Quality companies get cheaper. The Fed retains some ability to provide support.
Implication: Patient investors with cash get to buy quality at a discount.
SCENARIO 2: INFLATION BREAK
The accelerated correction.
Inflation and/or an oil shock break the setup before lockups even expire. The Fed cannot cut rates. It may have to hike. The correction is deeper and faster than the base case. Both overvalued growth stocks and "safe" index positions suffer.
Implication: Cash and defensive positioning become essential before the lockup window.
Exhibit 12: Two-scenario framework.
The Playbook: Four Rules
IMPORTANT: The following reflects Felix Prehn's personal approach. It is not financial advice. Every investor's situation is different. Consult a qualified financial advisor before making investment decisions.
Rule 1: Don't Buy IPOs
There are approximately 5,000 stocks listed in the US with years of audited returns, proven management, and real track records. Why would one brand new stock that has never been analysed in public markets deserve more attention than those 5,000? Always ask: why are the smartest people in the world honouring me by letting me be their exit liquidity? The founders and early investors — the people with the most information — have decided that right now is the perfect time to sell. That should give every investor pause.
Rule 2: Stay Invested, But With Stops
This market could go higher from here — money printing and lower rates are good for stocks in the short term. But having stops on all positions and keeping position sizes relatively small means not giving back gains because of stubbornness. Stops are the difference between a controlled exit and a panicked one.
Rule 3: Watch for the Signals
There are specific indicators that tell you the market is shifting from risk to safety. When ARK ETFs start rolling over, that is the canary in the coal mine — the speculative end of the market breaks first. When good earnings get sold (as Broadcom just demonstrated), the market is looking for reasons to exit. And when your barber starts telling you about his SpaceX allocation, that is when it is time to be very concerned.
Rule 4: The Opportunity Is in the
Correction
When the market corrects — and it will — higher- quality companies become cheaper. Companies with real cash flows, real margins, and real competitive advantages. Those are the companies you want to own for the next decade. You buy them when they are on sale, not when they are at all-time highs. The crash is not the enemy. Buying at the top is the enemy.
"The crash isn't the enemy. Buying at the top is the enemy." — The central principle of the playbook. Quality companies become available at discount prices during corrections. The key is having the cash, the patience, and the discipline to act when others are panicking.
| Warning Signal | What to Watch | What It Means |
|---|---|---|
| 🐤 ARK ETFs Rolling Over | ARKK, ARKW declining while broader market holds | Speculative end breaks first — canary in the coal mine |
| 📉 Good Earnings | ||
| Sold | ||
| Stocks dropping on beats (e.g., Broadcom | ||
| −12%) | ||
| Market looking for the exit — late-cycle behaviour | ||
| 💈 Barber Test | ||
| Non-investors talking about SpaceX | ||
| allocation | ||
| Retail euphoria has peaked — historically precedes | ||
| corrections |
Exhibit 13: Three warning signals framework.
💡
First & Only LIVE Training on 'The Greatest Stock Market
Opportunity Before SpaceX IPO'
Get your free seat at
greatestplaybook.com
Relevant ETFs for Lower-risk
EXPOSURE
For Investors Seeking Exposure Without Single-
Stock Risk. Given the concentration risks and late- cycle signals described in this report, some investors may prefer diversified exposure through ETFs. We highlight the following for consideration — noting that each carries its own risks and is subject to the same macro forces described above.
| ETF | Ticker | Relevance | Consideration |
|---|---|---|---|
| Invesco QQQ Trust | QQQ | Nasdaq 100 exposure — the index most directly impacted by SpaceX inclusion and AI proxy rotation | Most exposed to the concentration and rotation risks described in this report |
| iShares | |||
| Semiconductor ETF | |||
| SOXX | |||
| Semiconductor sector — includes Broadcom, | |||
| NVIDIA, and other AI infrastructure plays | |||
| Directly exposed to the "sell the news" | |||
| dynamic and AI capex repricing risk |
ARK Innovation ETF ARKK
High-growth/speculative tech — the canary in the coal mine Historically the first to break in risk-off environments. Watch for early warning signals
SPDR S&P 500 ETF SPY
Broad market — 36% concentrated in top 10 stocks Less volatile than sector ETFs but still exposed to concentration risk
Vanguard Value ETF VTV
Value stocks — potential beneficiary of rotation away from growth/AI Historically outperforms during late-cycle and correction phases iShares 20+ Year Treasury Bond ETF
TLT
Long-duration treasuries — traditional flight-to- safety asset Inversely correlated with inflation expectations. Performs well if rates fall; poorly if they rise.
Exhibit 14: ETF landscape relevant to the AI bubble thesis. For educational reference only — not a recommendation.
Important: ETF selection depends entirely on your individual circumstances, risk tolerance, and investment goals. This table is provided for educational context only. Consult a qualified financial advisor before making investment decisions.