DISCLAIMER: This report is for educational purposes only and does not constitute financial advice. It is not a recommendation to buy or sell any security, currency or commodity. All investments involve risk, including the loss of principal. This report is FTC compliant. Past performance is not indicative of future results.
The Prehn Institute | Research
Companion Report
Global Markets · Inflation, Debt & Hard Assets

The Unthinkable
and the Dollar

Why raising rates into an oil shock echoes the 1970s — and why the smartest money is quietly moving into gold and silver
Bottom line:

The Federal Reserve has started raising rates into an energy shock, the same combination that produced stagflation in the 1970s. With debt-to-GDP back near 120%, the authorities cannot hold rates high enough to kill inflation, so the likely path is to let inflation quietly erode the debt — and the value of cash savings along with it. This report explains the mechanism and what history says tends to protect purchasing power.

8×
how far gold rose (roughly $100 to $850) the last time a central bank raised rates into an oil shock
The Prehn Institute | Research
About

About Felix Prehn and The Prehn Institute

Felix Prehn

Felix Nikolas Prehn is an economist and former investment banker, trained in London and Hong Kong.

Felix founded The Prehn Institute, where former Wall Street and City of London professionals teach. On his initiative the Institute runs a free financial education programme for U.S. military veterans. He co-founded TradeVision.io, a stock screening and charting tool.

Felix has appeared alongside Jim Rogers, Tom Bilyeu, and other prominent figures in finance and business. Yahoo Finance and the Associated Press have covered Felix and his work.

The Prehn Institute

The Prehn Institute is an independent financial education institution founded by Felix Prehn, economist and former investment banker. It publishes research and provides instruction.

The Institute exists to raise the standard of financial education available to the public. Its published research is open to any reader, and its instruction is given by people who have worked in professional markets.

The Institute does not manage money and does not advise on investments. Its interest is in how markets work and in how professional practice may be taught.

Felix Prehn on YouTube

youtube.com/felixfriends

The Institute online

winstoninstitute.com

The Prehn Institute | Research
Contents

Contents

Bottom line: the 1970s setup, again4
Two kinds of rate rise5
The oil shock, on the ground6
Why supply-side inflation is so stubborn7
25 years of the “safe” asset8
The debt trap and the rollover wall9–10
The old playbook: inflate, then hike11
Who buys all this debt?12–13
What the smart money is doing14
Why cash is the trap15
Gold, silver and real diversification16–17
Action checklist & free live session18
Sources & disclosures19
How to use this report.

Read it beside the video. The sections follow the script's information and order. The goal is not to predict the exact next market move. It is to explain the machine — how inflation, government debt and the value of your cash are wired together right now.

The Prehn Institute | Research
Executive Summary
Bottom Line

The 1970s setup, again

Bottom line:

A rate hike into an oil shock does not cool the cause of the inflation — energy costs — it only squeezes borrowers and slows the economy. History calls the result stagflation, and last time it sent gold up roughly eight-fold. The same ingredients are lining up now.

Oil back above $100
→
Fed raises rates into it
→
Growth slows, prices stay high

The trigger

An energy shock, not a demand boom. Prices are rising because the stuff underneath everything — fuel, fertiliser, freight — got more expensive. Raising rates does not touch that cause.

The trap

The debt is too big to fight inflation properly. At roughly 120% debt-to-GDP, holding rates high enough for long enough would blow up the government's own budget first.

The likely path

Inflate the debt away. Letting inflation run quietly shrinks the real size of the debt — and the real value of savings held in cash.

The response

Follow the smartest money. Central banks now hold more gold, as a share of reserves, than at any point this century. The report explains why that matters to a regular saver.

The Prehn Institute | Research
Two Kinds of Rate Rise
The 1970s Mistake

Not all rate hikes are the same

SituationWhy prices are risingWhat a rate hike doesResult
Hiking into a boomToo much demand chasing too few goodsCools demand at the sourcePrices settle — the tool fits the problem
Hiking into an oil shockEnergy costs push up the price of nearly everythingPunishes borrowers; leaves energy costs untouchedGrowth falls, inflation lingers — stagflation

Why the difference matters

The medicine has to match the disease. When demand is the problem, higher rates help. When energy is the problem, higher rates hit the wrong target — the family with a mortgage, the small business with a loan, the farmer financing next season.

The historical echo

The 1970s are the template. Oil shock, roaring prices, a central bank tightening into a weakening economy. The textbooks had said stagnation and inflation could not happen together. They did, and gold rose from around $100 to about $850.

The tell

Ask which kind of hike this is. When someone says “rates up, gold down,” the important question is whether the hike is into a boom or into a shock. This one is into a shock.

The Prehn Institute | Research
The Oil Shock
On the Ground

$1,000 to fill one combine

$7
per gallon of diesel described by the farmer in the source material
140
gallons in the combine's tank
$1,000
to fill it up once
Bottom line:

An energy shock is a tax on the whole economy. Whatever it costs to grow and move food, the consumer pays at the other end. This is cost-driven inflation, and it is exactly the kind a rate hike cannot fix.

The voice from the field

A veteran American farmer. The source material quotes John Boyd Jr describing diesel at $7 a gallon, with fertiliser, chemicals and equipment all climbing at once, and calling it one of the worst economic times in history for America's farmers.

Why it spreads

Energy sits underneath everything. Higher diesel raises the cost of the tractor, the fertiliser, the lorry and the packaging. Each hand it passes through adds its own higher costs, so the original spike is multiplied several times before it reaches the shelf.

The point

This is not overspending. It is a producer being crushed by input costs he cannot control — the signature of supply-side inflation.

The Prehn Institute | Research
Stubborn Inflation
Why the Tool Misses

Why supply-side inflation is so stubborn

Energy costs push prices up across the board
→
Higher rates raise the cost of borrowing
→
Families and firms cut back and slow the economy
→
But energy is still expensive — so prices stay high

The disease vs the medicine

Rates treat demand; this is a supply problem. When the price of everything is being dragged up by energy, a higher borrowing cost does not make the oil or fertiliser any cheaper. It just weakens the borrower on the other side.

The feedback loop

Costs cascade. The farmer charges more for grain; the haulier charges more for freight; the shop charges more for the loaf. An energy shock does not stay in the energy aisle — it ends up in every aisle.

The one-sentence trap

The medicine does not treat the disease. It just weakens the patient — you kill the growth, not the inflation.

The Prehn Institute | Research
The “Safe” Asset
Already Happened

25 years of holding wealth in cash
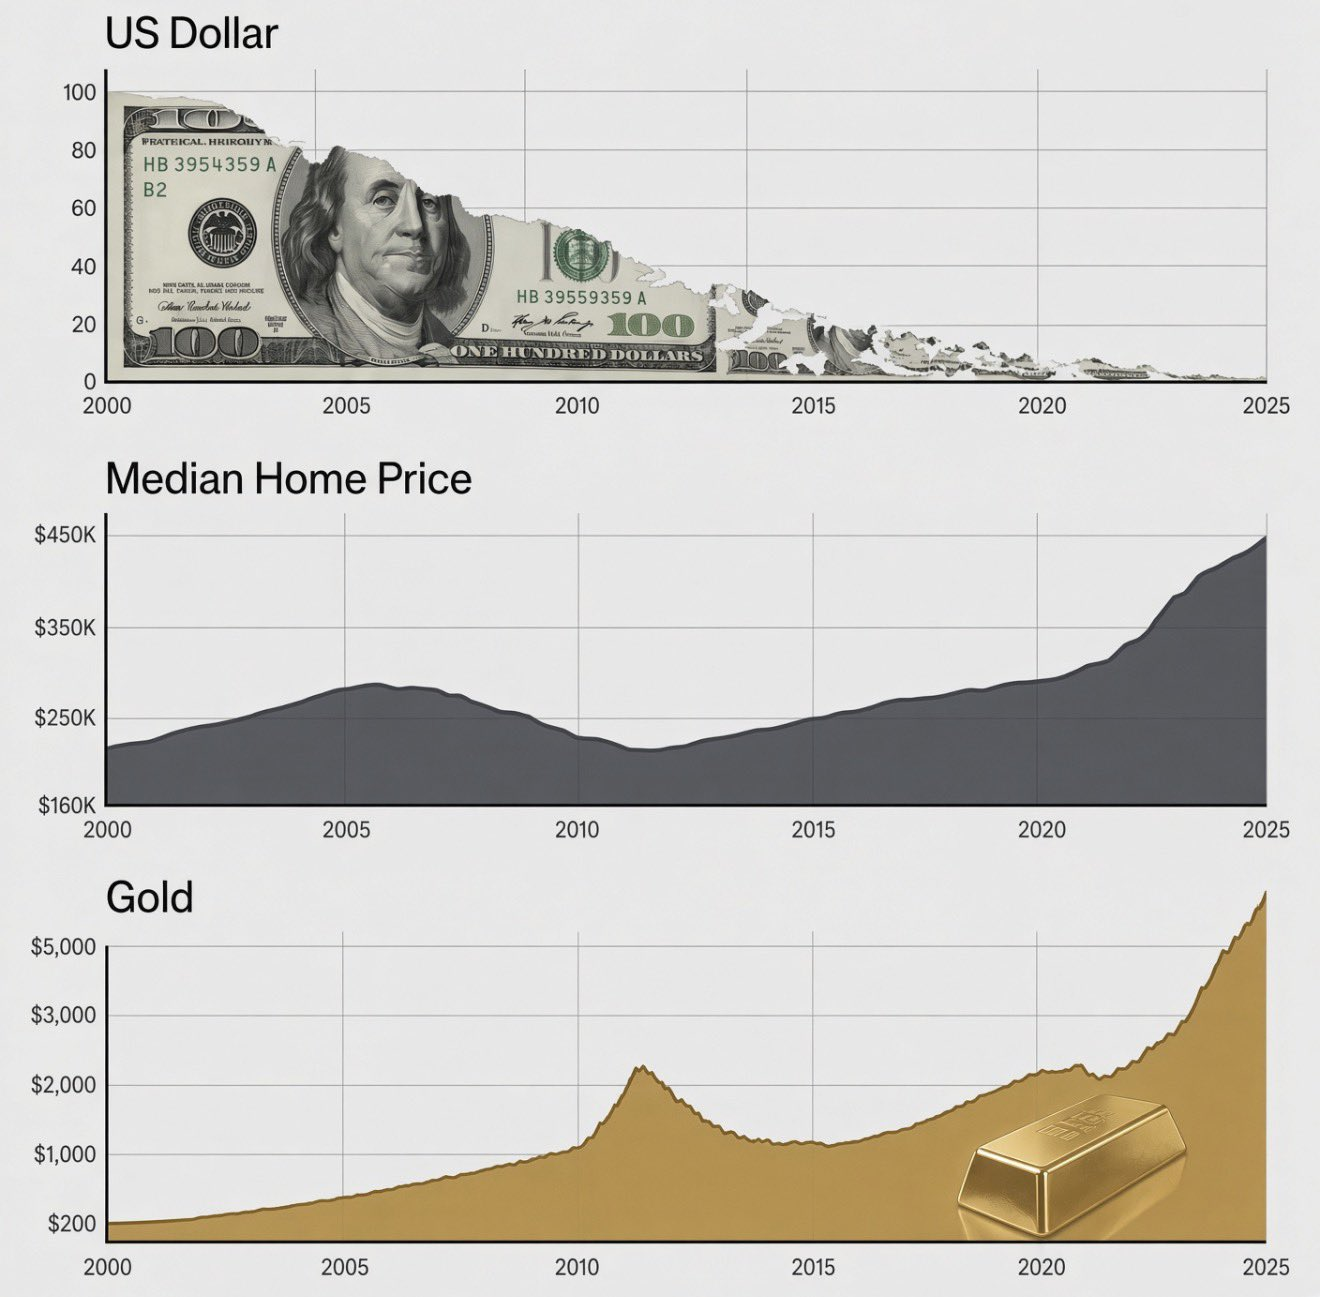
Since 2000: the US dollar's buying power crumbling, the median US home price rising from about $160,000 to about $450,000, and gold rising from about $200 to above $5,000
Source image supplied with the video materials. Since 2000, the dollar's buying power falls while the median home price rises from roughly $160,000 to about $450,000 and gold rises from around $200 to above $5,000. This is history, not a forecast.
Why this chart matters.

It is not a prediction — it is a receipt. It shows what already happened to people who kept their wealth in the thing they were told was safe. The dollar melts; a roof and a hard asset drift further out of reach.
The Prehn Institute | Research
The Debt Trap
Why They're Trapped

Raising the price of their own mortgage

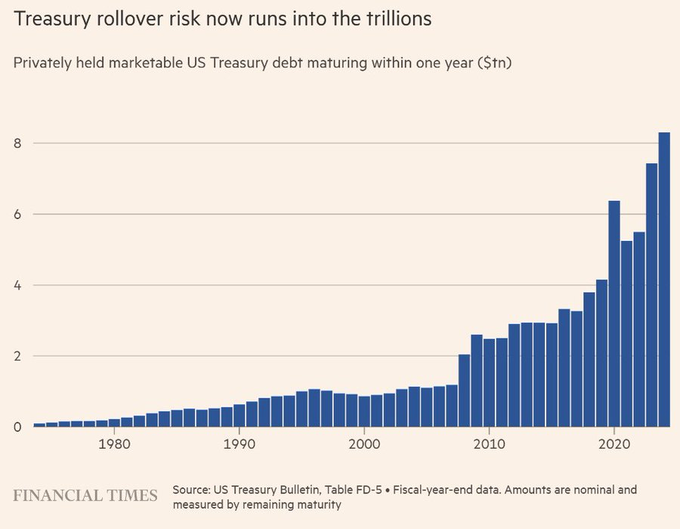
Chart of Treasury rollover risk: privately held US Treasuries maturing within one year, rising into the trillions
Source image supplied with the video materials. Privately held US Treasuries maturing within one year — a rollover wall running into the trillions.

How the government borrows

Treasuries are just IOUs. You lend the government money now; it repays later with interest. The problem is the sheer size of what must be repaid and rolled over.

The rollover

Roughly $8 trillion in 12 months. The source material notes about $8T of government IOUs coming due within a year and needing to be borrowed again — at today's rates, not yesterday's.

The catch

Every rate rise is self-inflicted. Higher rates make the government's own debt more expensive to carry. They are raising the price of their own mortgage.

The Prehn Institute | Research
The Arithmetic
Volcker Could. They Can't.

Why today is not the early 1980s

~3.3%
average rate on the old debt
~5%
rate on rolling it today
~$136B
extra annual interest from rolling $8T at today's rates
MeasureVolcker era (early 1980s)Today
Debt-to-GDP going inDriven down to roughly 30%Back at roughly 120%
Room to raise rates hardYes — the country barely owed anything relative to incomeNo — punishing rates would blow up the budget
Annual deficit backdropSmaller relative to the debtRoughly $2 trillion a year more spent than taken in
The key point.

Paul Volcker crushed inflation with brutal double-digit rates because the debt was small relative to the economy. At 120% debt-to-GDP, the same tool would bankrupt the government first. They can rattle the sabre with a quarter-point. They cannot swing it.

The Prehn Institute | Research
The Old Playbook
Inflate, Then Hike

First you inflate the debt away

Let inflation run a little hot
→
The real size of the debt shrinks
→
Only later raise rates to finish the job
Bottom line:

When a government owes too much and inflation is running, the old playbook is to inflate first and hike later. We are firmly in the inflate-it-away part. The person who pays for that is whoever holds dollars.

How it works

Debt is repaid in cheaper money. If a government owes a trillion and inflation runs at 5–6% for a few years, the debt on paper stays a trillion, but what a trillion can buy shrinks. The debt gets easier to carry — not because it was paid down, but because the money weakened.

Who pays

The saver. Every bit of relief the government gets is lifted from the pocket of whoever saved in the same shrinking dollars. Nobody votes for it, nobody announces it — which is exactly why it is used.

The theatre

Watch what they can afford, not what they say. A small hike lets them look tough while the arithmetic of the debt means they cannot follow through.

The Prehn Institute | Research
Who Buys the Debt?
The Auctions

A wall of debt to sell every week

$457B
Treasuries auctioned in a single four-day stretch, per the source material
$171B
on Monday alone
Weekly
this has to be repeated, week after week

The mechanism

Not enough buyers means higher rates. If demand is weak, the government must offer a higher interest rate to tempt lenders in. Higher rates to sell the debt mean more expensive borrowing everywhere and tighter conditions.

The squeeze on your investments

Money gets pulled from shares into bonds. When Uncle Sam pays a fat rate on his paper, capital leaves the stock market to sit in bonds — a tug of war that can knock the wind out of shares while the value of the cash itself keeps eroding.

The Prehn Institute | Research
The Backdrop
Oil, and the Buyer of Last Resort

The printing press waiting behind the wall

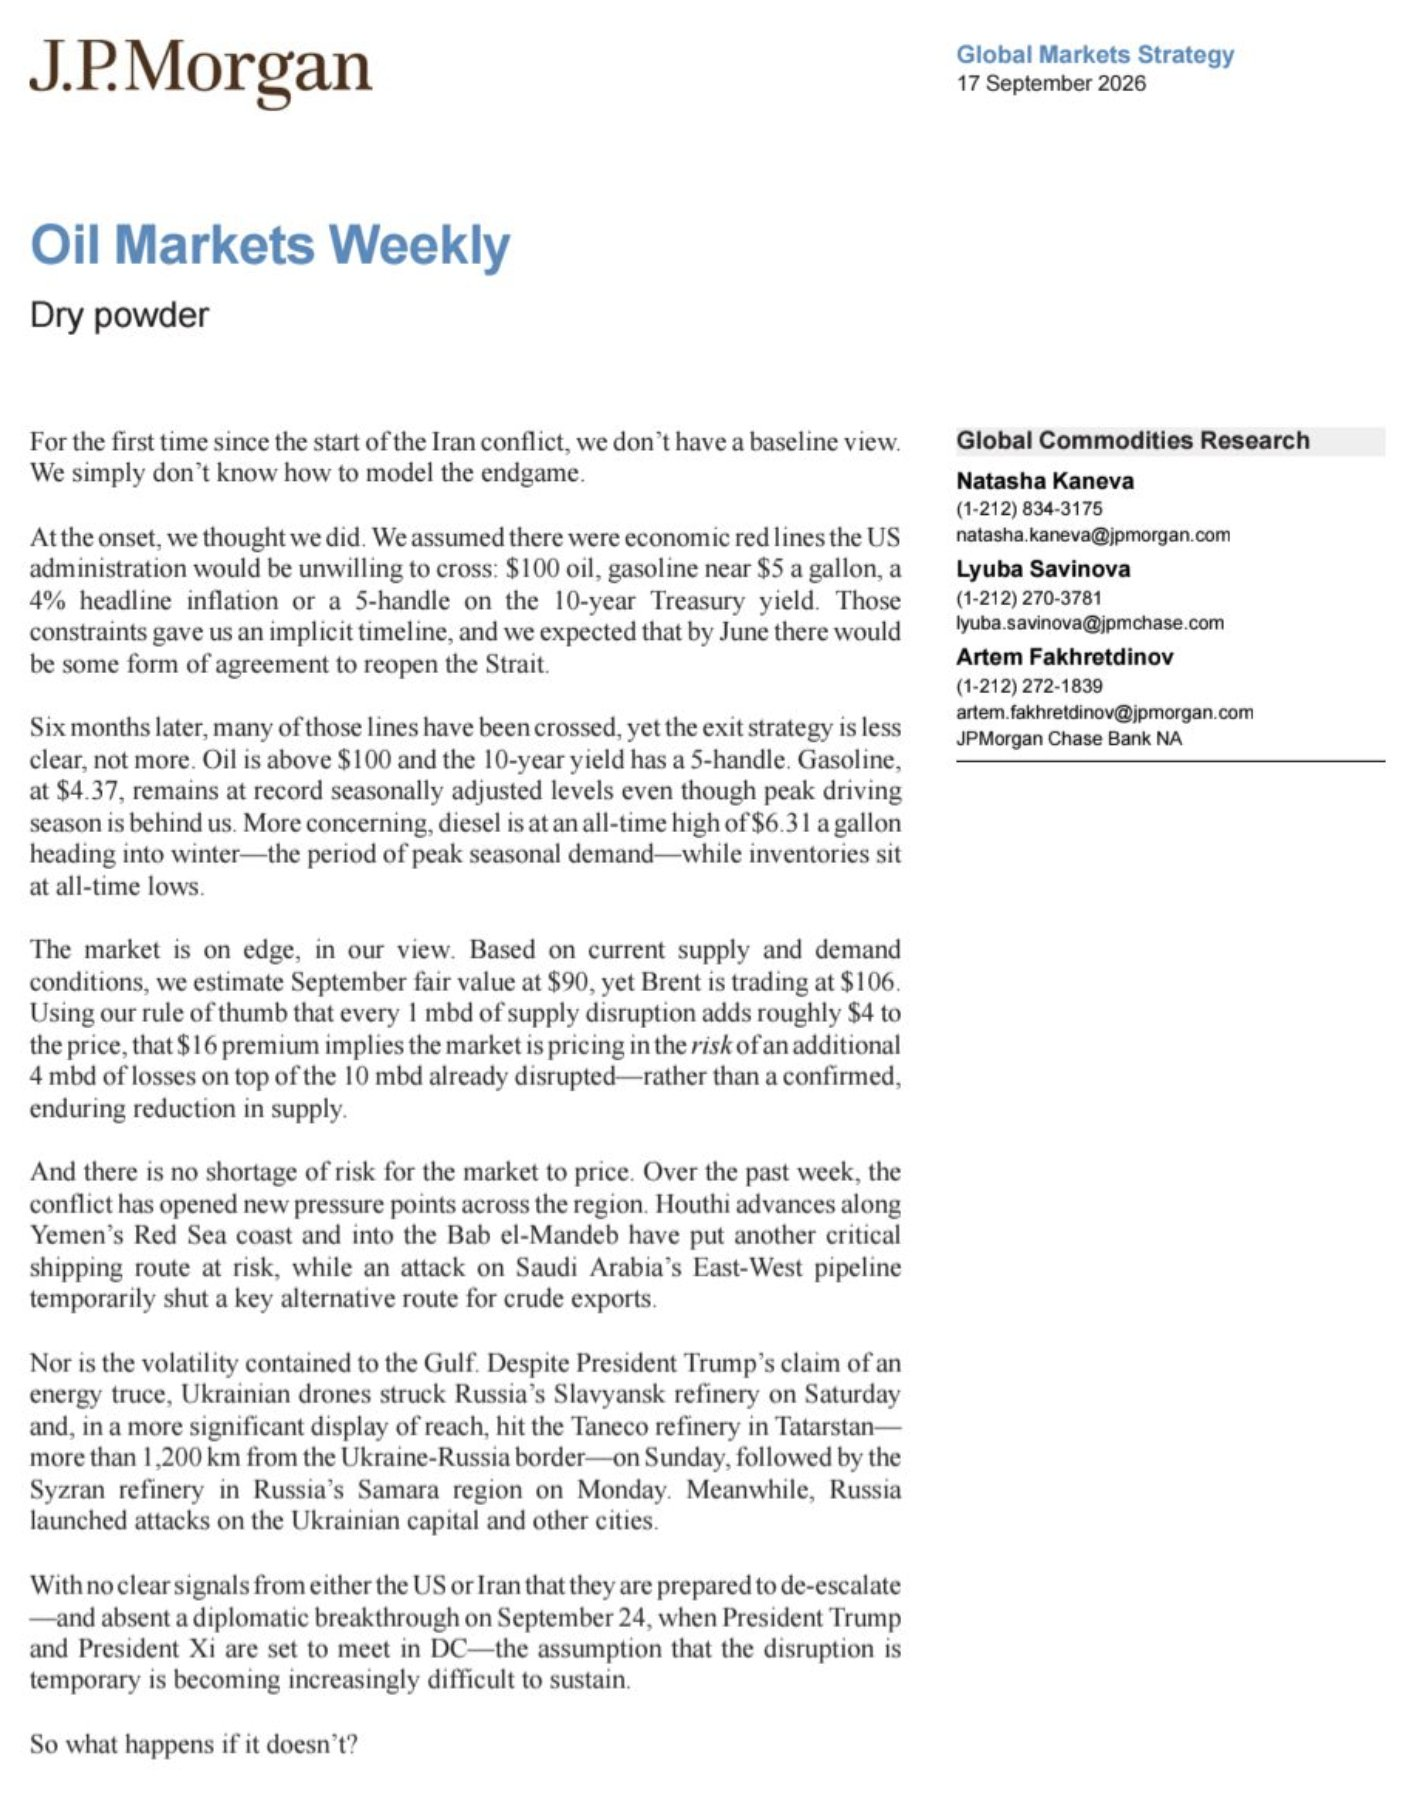
JPMorgan oil market report referenced for the oil backdrop
Source image supplied with the video materials — the oil report referenced for the energy backdrop, with oil back above $100.
Not enough buyers at a price the government can afford
→
The central bank steps in and buys the debt
→
New dollars are printed to soak it up
→
Every new dollar waters down the ones in your pocket
The machine, in one line.

Inflation they can't properly fight, a mountain of debt to roll and sell every week, and a printing press on standby. If you set out to design something to slowly drain the value of cash, this is roughly what you would build.

The Prehn Institute | Research
The Smart Money
Follow the Institutions

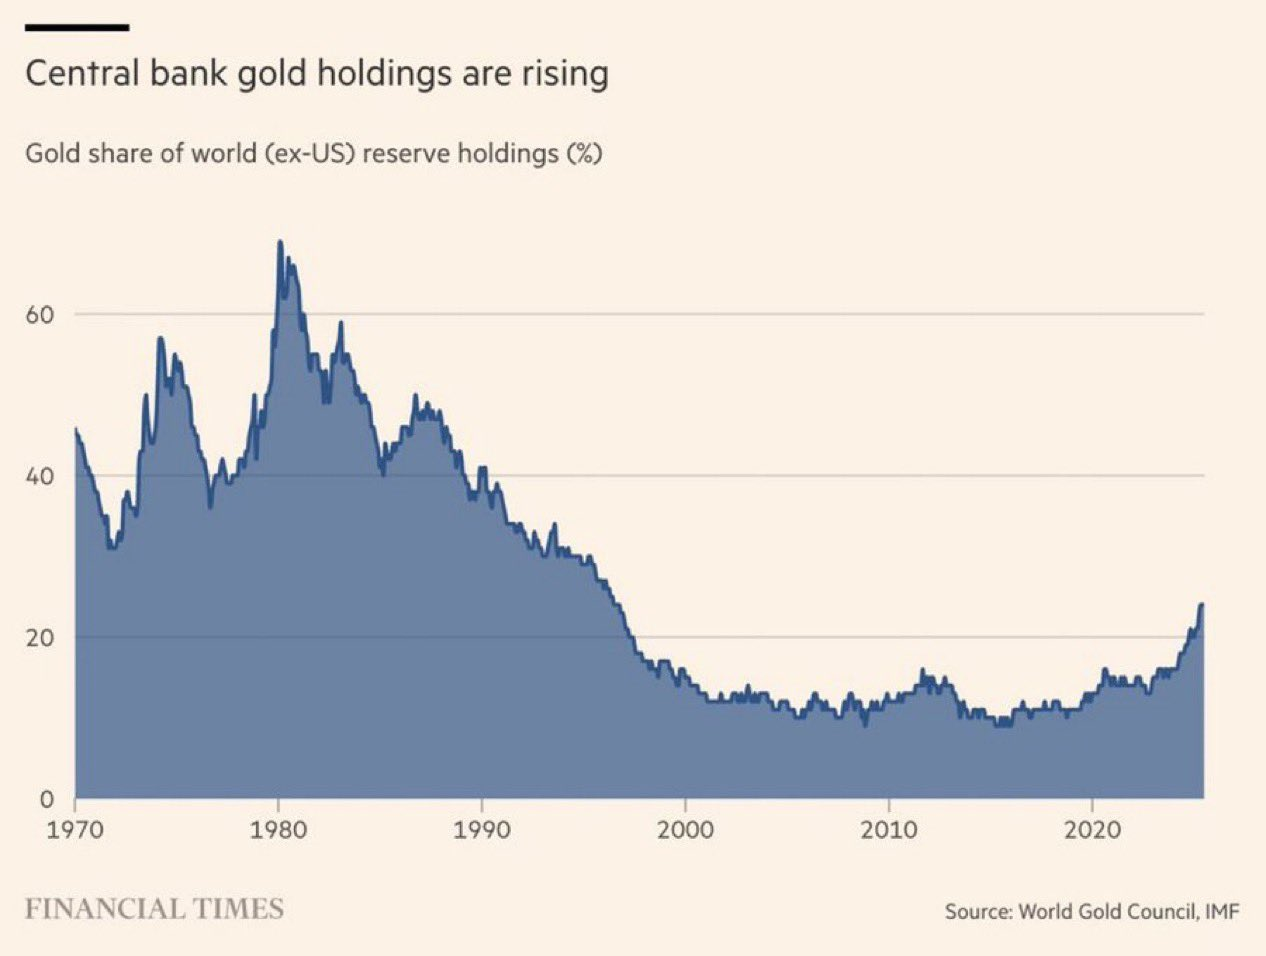
The most gold this century

Chart of central bank gold holdings rising: gold as a share of world reserves collapsing decades ago, drifting, then turning hard upward into today
Source image supplied with the video materials. Central banks' gold, measured as a share of reserves, collapsed decades ago, drifted along the bottom, and has turned hard upward into today.

Who is buying

The people who print the money. Central banks now hold more gold, as a share of reserves, than at any point this century. They are choosing to hold less of their own product and more of the one thing they cannot print.

What it signals

A vote of no confidence in paper. Read alongside the melting-dollar chart, the message is consistent: the institutions closest to the printing press would rather not be on the losing side of it.

Watching it yourself

A personal newspaper for your money. The Winston app tracks gold, silver, the dollar and whatever you hold, in plain English. You do not need any app to get the point — but it helps you notice before the headline, not after.

The Prehn Institute | Research
Why Cash Is the Trap
The Comfortable Mistake

“I'll just sit in cash”

Bottom line:

Cash feels like the one thing that can't go wrong. Over time it is the asset designed to lose. Since 1971, when the dollar's last link to gold was cut, it has lost the overwhelming majority of what it could buy.

The long erosion

1971 was the turning point. Before it, a dollar was a claim on something real. After it, the supply could grow without limit — and it did. The government's own inflation calculator still shows a dollar from back then worth a small handful of cents today.

It doesn't bleed slowly

Calm, then a spike. You get years of quiet and then a sharp jump — as many people saw after the pandemic, when a hotel room that cost a couple of hundred suddenly had a zero bolted on. That was the money getting worse, not the room getting better.

The setup now

The next spike is being loaded. With an oil shock feeding into everything and a printing press on standby, the conditions for another jump are in place.

The Prehn Institute | Research
Gold & Silver
What People Work Out Early

Things that can't be printed

AssetCharacterWhy it's mentioned
GoldThe steady oneThe asset central banks are actively stacking
SilverThe smaller, wilder cousinA tiny market that can sit still for years, then move late and hard

The silver mechanism

A small door, a lot of money. The silver market is tiny next to gold. When big money gets nervous about the dollar and spills into silver as the cheaper way to make the same bet, there isn't enough to go round — so the price can lurch rather than drift. This is a description of the mechanism, not a promise it will happen.

The real point

Diversification, not all-in. This is not advice to buy anything, and a portfolio that is all gold and silver would rob you of sleep. The point is to know what you actually own.

The hidden concentration

Many savers are less spread out than they think. If a large share of recent gains came from a small clutch of AI shares — as it did for many index-fund holders — that is concentration in the most crowded corner, not protection.

The Prehn Institute | Research
Putting It Together
The Whole Picture

One machine, in one place

Rates raised into an oil shock — the 1970s mistake
→
Debt too big to hold rates high enough to kill inflation
→
Inflation left to melt the debt — paid for by savers
→
Central banks hold the most gold this century
Who gets hurt worst.

It is rarely the people who saw it coming. It is the careful ones — the savers who did everything right, kept their money in cash and government paper, and watched it quietly melt while they weren't looking. The aim of this report is to make sure that is not you.

What to hold onto

Understanding first. You do not need to predict the exact month of the next spike. You need to understand the machine well enough to stop holding all your wealth in the one asset designed to lose.

Don't panic

This is not a sell-everything message. Don't panic-sell your shares. Know what you own, and make sure you are actually diversified against the risk described here.

The Prehn Institute | Research
Checklist
Questions for the reader

Five questions before the next spike

The Prehn Institutewinstoninstitute.com

The Institute publishes research and provides instruction. Its published research is open to any reader, and its instruction is given by people who have worked in professional markets. The Institute does not manage money and does not advise on investments.

The Prehn Institute | Research
Sources & Disclosures
References

Sources & disclosures

  1. Video: “The UNTHINKABLE is About to Happen to the Dollar (Gold and Silver are Next)” by Felix Prehn.
  2. Rate decision & backdrop: the Federal Reserve's first rate rise since 2023, oil back above $100, and Treasury yields near 5%, as described in the source materials that accompany the video.
  3. 1970s parallel: rates and inflation rising together, gold rising from roughly $100 to about $850, with an Iran-driven oil shock fuelling the final move.
  4. Oil shock on the ground: farmer testimony on diesel at $7 a gallon and roughly $1,000 to fill a 140-gallon combine.
  5. Debt & rollover: approximately $8 trillion of Treasuries to be rolled within 12 months; average coupon near 3.3% versus roughly 5% today; roughly $136 billion in added annual interest; deficit near $2 trillion; debt-to-GDP near 120% versus roughly 30% before the Volcker hikes.
  6. Auctions: at least $457 billion of Treasury auctions across four days, including about $171 billion on a single Monday.
  7. Smart money: central banks holding the most gold, as a share of reserves, this century.
  8. Charts: the dollar-value-loss chart (dollar versus median home price versus gold, 2000–2025), the Treasury rollover chart, the central-bank gold chart, and the oil report — all supplied with the video materials.
  9. Winston app: markets tracking referenced in the video.

Full educational disclaimer

This report is for educational and informational purposes only and does not constitute financial, investment, legal, tax or accounting advice. It is not a recommendation, solicitation or offer to buy or sell any security, currency, commodity or financial product. No buy/sell rating or price target is provided. All investments involve risk, including the possible loss of principal. Market events, relationships and historical comparisons described here may not repeat, and figures cited are drawn from the video's source materials rather than refreshed with independent research. Illustrations simplify complex systems and may omit factors. Readers should conduct their own research and consult appropriately qualified professionals before making financial decisions. Past performance is not indicative of future results. The Prehn Institute makes no guarantee regarding outcomes.

Author: Felix Prehn, The Prehn Institute.